
Abstract
This study attempts to investigate the asymmetric impacts of oil price and component shocks on categorical economic policy uncertainties (EPUs) in China. A novel multiple thresholds nonlinear autoregressive distributed lagged model (ARDL) was employed to capture the asymmetric impacts of oil price and shocks on EPUs in the short and long run. Additionally, the influence of the Brent oil price on integral EPU was also examined. We find that asymmetric impact is more remarkable in the long run in China. Among the four categorical EPUs, trade policy uncertainty is the most notable in most cases. Based on the results, some implications are provided to policymakers and investors.
Highlights
Asymmetric impact is more remarkable in the long run in China.
EPU declines at a slower rate when oil prices decrease.
Asymmetric impact of oil price shocks on trade policy uncertainty is significant.
Introduction
Crude oil, an important industrial raw material, and its price fluctuations have significant macroeconomic impacts often characterized by asymmetry (Das & Kannadhasan, 2020; Jiang & Cheng, 2021; Loungani, 1986; Mork et al., 1994; Su et al., 2021). Policymakers responsible for mitigating macroeconomic trends to maintain economic stability and growth may have to deal with a trade-off between high inflation and low production stabilization (Sun et al., 2020). Correspondingly, economic policy uncertainties (EPUs) will undoubtedly be affected by such changes in macroeconomic policy (Jiang et al., 2022). Scholars are becoming increasingly interested in the relationship between oil price shock and EPU; accordingly, a growing number of researchers have been evaluating the effect of oil price shocks on EPUs.
Theoretically, growth, investment, and demand all suffer as a result of EPUs impacting oil prices (Antonakakis et al. 2014). Notably, oil price shocks can spread throughout an economy through macroeconomic policies (e.g., monetary and fiscal policies) (Jiang & Cheng, 2021; Pieschacón, 2012). Economic policies are well-known and powerful macroeconomic tools; historically, they have played important roles during oil price shocks—in other words, oil price fluctuation is one of source of EPU (Kara, 2017). Existing studies have demonstrated that different EPUs differently relate to oil price volatility (Jiang et al., 2022; Kang et al., 2017).
The relationship, measurement, and influence of oil price shocks on EPUs have become popular topics of academic interest that have been discussed in numerous papers (Baker et al., 2016; Bloom, 2009). A widely accepted approach is to test the relationship and impact on EPU separately by first disaggregating shocks into supply, demand, and demand-specific shocks depending on the source of the oil price (Antonakakis et al., 2014; Kilian, 2009) decomposed oil prices into three types of shocks: supply shocks, aggregate demand shocks, and precautionary demand shocks, with crude oil production and the global real economic activity index (in terms of dry freight rates) chosen as proxies for oil supply and demand. The effects of different shocks are fully examined and understood by building a structural vector autoregressive (SVAR) model for the three variables. Building on the classification of oil price shocks presented by Kilian and Park (2009), Antonakakis et al. (2014) used a generalized forecast error variance decomposition (Diebold & Yilmaz, 2012) approach to examine the spillover effects between these categorized shocks and EPU. However, according to Ready (2018) and Demirer et al. (2020), this approach does not identify whether fluctuations in precautionary demand are stimulated by concerns about future oil supply or the aggregate demand for oil. Hence, Ready (2018) introduced asset prices into the SVAR model to redefine supply, demand, and risk shocks to overcome these defects. We use this approach to explore the relationship and asymmetric impact between oil price shocks and categorical EPUs (fiscal policy uncertainty, monetary policy uncertainty, trade policy uncertainty, and exchange rate policy uncertainty—henceforth, “policy uncertainty” is abbreviated as “PU”). The reason for this is that we include, in a unified analytical framework, four categories of EPU that are subject to different types of shocks presenting various outcomes: fiscal PU, monetary PU, trade PU, and exchange rate PU. Combining Ready (2018) work on the source of oil price shocks and Huang and Luk (2020) work on categorical EPUs in the same analytical framework allows for a better identification of the influence of oil component shocks on various types of EPUs and their magnitudes.
China is the world’s largest emerging country. After nearly 40 years of opening up to the outside world, it has become an important link in the global industrial chain. While China consumes the world’s largest amount of crude oil, with an external dependence of 69.8%, existing studies on how oil price shocks impact EPUs shows that EPUs differently respond to oil price shocks in the short run and the long run. In one study using a sample of BRIC countries, the impact proved weaker in the short term, but steadily strengthened over long term (Chen, Sun, & Wang, 2019), and the same trend was observed in a study of G7 countries (Sun et al., 2020); notably, this trend has demonstrated asymmetric features (Das & Kannadhasan, 2020; Su et al., 2021; You et al., 2017). Meanwhile, Jiang et al. (Jiang et al., 2022) used a multi-regime-on-scale approach to investigate how fiscal PU (FPU) and monetary PU (MPU) in China responded to global oil price volatility; the study found that China’s FPU and MPU volatility only responded significantly to global oil price volatility in the intermediate to long term in a low oil price volatility regime. Relatively speaking, MPU more strongly reflects the volatility link between China’s EPU and oil prices than FPU. Meanwhile, oil price shocks affect not only monetary and fiscal policies, but also trade (Wei, 2019) and exchange rate policies (Zhu & Chen, 2019) and are thus sources of trade PU and exchange rate PU. On the one hand, because crude oil is a globally traded commodity dominated by the US dollar, crude oil price shocks may affect exchange rate PU; on the other hand, they may also affect trade PU in the context of cost and substitution effects. Wang and Lee (2022) evaluated the associations between categorical policy uncertainty and global oil returns; they found that exchange rate PU has the largest negative average correlation with global oil returns, followed by FPU (negative), MPU (positive), and, finally, trade PU (negative). In contrast to much of the existing literature, Wang and Lee (2022) situate categorical PUs in a non-linear and dynamic analytical framework; however, they exclude the source of oil price shocks and asymmetric impacts from their analysis.
To complement the prior literature, we employ a novel multiple threshold nonlinear autoregressive distributed lag (MTNARDL) model. While we do this, like Pal and Mitra (2019), to analyze the integral oil price, we also assess the asymmetry of component shocks. To clarify how oil price shocks impact China’s EPUs, we classify oil price shocks into supply, demand, and risk shocks (Ready, 2018) and EPUs into fiscal PUs, monetary PUs, trade PUs, and exchange rate PUs. The reason for classifying oil price shocks in this way is that demand and supply shocks stimulate the price of oil, just as they stimulate the price of any other commodity. Not only do different shocks have various time-varying implications on the real oil price, but they also have diverse dynamic effects on economies. In particular, global demand shocks may have direct and indirect repercussions for the economy by impacting the prices of oil and other industrial commodities (Kilian, 2009).
This paper contributes to existing literature in three main ways. First, this study sought to generate a more comprehensive conclusion on the relationship between oil price shock and EPU by investigating the asymmetric impact of the pass-through from oil price and component shocks to China’s categorical PUs; prior literature only highlights fluctuations in oil prices, ignoring disaggregated shocks. More specifically, we add to the literature by introducing Ready’s (2018) innovative reasonable decomposition approach; that is, by analyzing the asymmetric impact of oil price shock on China’s categorical PUs by decomposing the oil price shock into a supply shock, a demand shock, and a risk shock according to the source of the shock to gain new insights on the impact of categorical EUPs, thus expanding the research perspective. Second, this study more precisely evaluates the impact of oil price shock on EPUs by employing multiple threshold models that distinguish between small to large variations in oil price shocks and capture the responses of categorical PUs, In particular, this study split supply shock, demand shock, and risk shock into different quantiles to explore asymmetric transmission across minor to major fluctuations—this approach has a significant advantage over standard nonlinear autoregressive distributed lag (NARDL) models, which simply identify oil price fluctuations. This is, as far as we know, the first study to apply these models to investigate the asymmetric impact of oil price shocks on categorical PUs in China. Finally, our analysis is unique in the present literature since it combines fiscal PU, monetary PU, trade PU, and exchange rate PU with oil price shocks in the same analytical framework; this approach stands as a valuable theoretical support for policymakers seeking to adapt policies to different types of oil price shocks.
The rest of the article is structured as follows. Section 2 provides a brief overview of existing research on oil price changes, disentangling shocks, and the EPU nexus. The methodology and data are provided in Sections 3 and 4. Section 5 presents the empirical results and discussion. Section 6 offers the conclusions.
Literature Review
Since Hamilton (1983) seminal work, early literature on the impact of oil prices has put a spotlight on two main topics: macroeconomic activity and financial markets. In terms of macroeconomic activity, the main foci have been the mechanisms and magnitudes of the effects of oil price shocks on macroeconomic variables such as output, investment, trade, and inflation (Blanchard & Gali, 2007; Cologni & Manera, 2008; Crucini, 2000; Cunado & Gracia, 2005; Du et al., 2010; Hamilton & Herrera, 2004; Jiménez-Rodríguez & Sánchez, 2005; Jones et al., 2004; Cuado & de Gracia, 2003; Peter Ferderer, 1996). The impacts of oil prices on stock markets in financial markets have also been studied (A & B, 2010; Antonakakis et al., 2014; Arouri & Rault, 2012; Filis et al., 2011; Kang & Ratti, 2013a; Kilian & Park, 2009; Lee & Ni, 2002; Maghyereh, 2006; Papapetrou, 2001). When oil price shocks are considered as whole (i.e., without distinguishing between the sources of the shocks), negative shocks outweigh positive ones in terms of their impact. However, as research progresses, there are some extent asymmetries in the impact of the oil price on either macroeconomic or financial markets.
Regarding the influence of oil shocks on EPUs, numerous studies suggest a direct relationship between oil prices and economic policy (Gelb, 1988), advising that oil price volatility significantly affects short-term uncertainties. Hence, changes in the oil price may likewise be one of the main drivers of EPU (Barrero et al., 2017). Through an analysis of data from G7 countries, Hailemariam et al. (2019) observed the time-varying impact of oil prices on EPU (Yang, 2019; Yin, 2016) and argued that oil price shocks cause uncertainty in the economy. Studies have shown that economic activity is severely influenced by oil price. When economic policies are frequently adjusted in order to smooth out economic fluctuations, they become uncertain.
Policymakers make relevant economic policy adjustments according to economic activities in a timely manner. When output is affected, the corresponding fiscal or monetary policies may be adopted. When import and export are affected, the corresponding trade or exchange rate policies may be adopted. On a micro level, oil is the indispensable feed stock for production and oil prices determine the cost of oil and its related products. Producers will adjust their production plans to maximize profits based on oil prices, which will affect production and thus the macroeconomy (Hamilton, 1988; Sorana et al., 2018; Wen et al., 2018). From a macro perspective, higher oil prices stifle output, while lower oil prices do not positively affect output or have the same degree of impact (Mork et al., 1994). Frequent policy adjustments cause economic agents (e.g., consumers, enterprises) to have uncertain expectations and influence their economic behavior. However, the extent to which the oil price affects EPU depends on the source of the shock. For this reason, Kilian (2009) isolated the supply shocks from the real price of crude oil due to political events in the member countries of the Organization of the Petroleum Exporting Countries (OPEC) from other oil supply shocks, crude oil market-specific demand shocks, and aggregate industrial commodity demand shocks. By quantifying the magnitude and timing of these shocks, he revealed. This finding is supported by a number of researchers (Antonakakis et al., 2014; B et al., 2018; Kang & Ratti, 2013a; Ro Ba Ys, 2012). Following Kilian’s analytical approach, Lippi and Nobili (2012).
Macroeconomic variables fluctuate in response to domestic oil supply shocks as well as supply shocks generated abroad. Not all demand shocks are similar and the correlation between US economic activity and oil prices is altered depending on the different kinds of shocks and their sources, which is a qualification of the results in Kilian (2009). Similarly, Kolodzeij and Kaufmann (2014) analyzed the linkage between these costs and oil prices, but challenged Kilian (2009) findings by showing that the conclusions regarding the insignificance of supply shocks and the importance of demand shocks are not reliable. However, the impact of oil price shocks is also not perfectly consistent across economies. Rehman (2018) used Kilian (2009) decomposition of oil prices as the basis for an analysis of EPU in a sample of markets using the SVAR framework. The results highlight that EPUs in India, Spain, and Japan respond to the global oil price, but aggregate demand shocks do not trigger any changes. Only in the context of China and India are oil-specific demand shocks significant in high volatility states. Chen, Sun, and Li (2019) examined the relationship between China’s industrial economic growth, global EPU (GEPU), and oil price shocks using a combination of Granger causality tests and VAR models. They found that oil prices and GEPU had positive and negative effects on China’s industrial economic growth, respectively.
Component oil price shocks can critically impact economic activity, including stock markets and international trade. Arouri et al. (2014) found that an increase in EPU in major net oil importing countries on the Gulf Cooperation Council (GCC) stock market had a persistent negative impact on stock returns, and that this impact interacted with changes in oil prices. According to Kang and Ratti (2013b), oil price shocks and EPU are interrelated and affect stock market returns. Positive oil market-specific demand shocks substantially increase EPU and reduce real stock returns. As for international trade, Novy and Taylor (2020) found that firms selectively cut import orders out of oil price shocks and China’s economy: monetary policy reactions to oil price shocks worried fixed costs and risk in the face of uncertainty, leading to a contraction in international trade activity that was greater than that of domestic trade activity; the 2008 to 2009 trade collapse is excellent evidence of this phenomenon. As international trade is very sensitive to exchange rates, the impact of EPU shocks on exchange rates may be transmitted to trade. Using an empirical analysis of bilateral data for 16 major FDI-inward countries, Choi et al. (2021) found that EPU in host countries significantly reduced FDI inflows and that this effect was more severe in countries with insufficient financial deepening. Although FDI is generally considered to be the most stable form of international capital flow, it is also subject to EPU due to its high fixed costs and investment risks. With respect to China’s real exports, Wei (2019) found that oil supply and EPU shocks posed negative impacts, whereas oil aggregate demand and oil ratio demand shocks posed positive impacts. In the meantime, both oil supply and aggregate oil demand shocks have a positive impact on China’s real imports.
Thinking with such existing literature, this study analyzed the asymmetric impact of oil price shocks from different sources on different types of PU. Existing studies have treated all kinds of EPUs as an integral whole or used only one EPU to analyze the impact of oil prices and shocks (Su et al., 2021; Wang & Lee, 2022; Wen et al., 2019); this approach makes it hard to identify which kind of PU was impacted. From an empirical perspective, researchers have used a conventional quantitative structural model (Wei, 2019), a time-varying parameter structural vector autoregression model (TVP-SVAR) (Wang & Lee, 2022; Wei, 2019), and a wavelet-based BEKK-GARCH model (Chen, Sun, & Li, 2019) to evaluate the impact. To capture the asymmetric and nonlinear relation more precisely, we follow Pal and Mitra (2019) and employ two thresholds and four thresholds NARDL models for China’s categorical economic policy uncertainties.
Methodology
Disentangling the Oil Price
Ready (2018) proposed a novel approach to decompose oil price into supply, demand, and risk shocks; in this study we borrow his method. Based on Ready (2018), three proxy variables are required to construct the SVAR model. He firstly defined “demand shocks” as the portion of returns of global oil producing firms, which is orthogonal to the innovations to the volatility index (VIX) of the Chicago Board Options Exchange (CBOE). The “risk shock” is defined as the innovations to the VIX, which denotes uncertainty in financial markets; therefore, residuals of oil price variations, which are orthogonal to both demand and risk shocks, are expressed as supply shocks. Ready (2018) reasoned that supply shocks are typically caused by specific events; nevertheless, because oil producers have natural hedges against supply difficulties, price increases caused by oil demand would benefit oil producers. More specifically, Ready’s (2018) approach can be divided into the following two steps. Firstly let

The supply, demand, and risk shocks are respectively denoted as st, dt, and vt. Oil price change is denoted as Δpt.
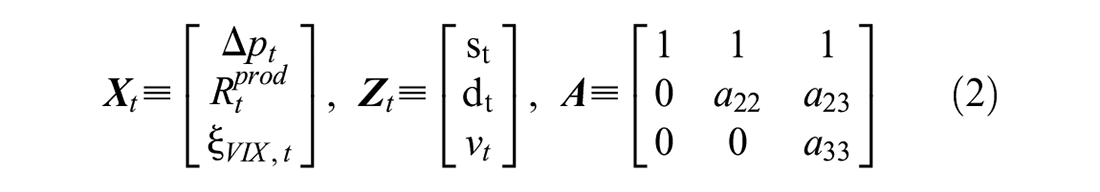
Secondly, Ready (2018) imposed the following condition to ensure orthogonality among three shocks:

Asymmetric Approach
The MTNARDL model proposed by Pal and Mitra (2015); Pal and Mitra (2016) was inspired by a seminal nonlinear ARDL suggested by Shin et al. (2014), wherein the regressor(s) can be decomposed into positive and negative partial sum components to investigate the asymmetry. Shin et al. (2014) built their work upon that of Pesaran et al. (2001), which proposed a conventional ARDL model. We present these methods one by one below.
ARDL model
Firstly, consider an ARDL equation:

where EPU stands for economic policy uncertainty. We assess the integral EPU and four categorical EPUs one by one. Oil price is presented as Oil and will also be replaced with variety shocks subsequently. The first difference operator is
NARDL model
Shin et al. (2014) proposed a nonlinear ARDL to assess the asymmetry of Express Oil as follows:

where


where

Furthermore, the standard Wald test can be used to test the short and long-term asymmetry.
Multiple threshold NARDL
The MTNARDL proposed by (Pal & Mitra, 2015, 2016) split the regressor into different quantiles to explore the asymmetric transmission of the regressor with minor to major fluctuation. For instance, we pulled into two thresholds at the 30th and 70th quantiles (denoted as

In specification (8),


where

where

Eventually, the asymmetry is estimated by standard Wald test both in the long-term short-term. One advantage of MTNARDL is that they are suitable regardless of whether variables are integrated of order one I(1) or zero I(0). Another advantage, according to Pal and Mitra (2019), is that the model can concurrently examine the impact of the regress on the positive and negative outliers of the regressors. However, there are two limitations of the MTNARDL model: one is that when threshold increases, the sample size employed for estimate decreases. For example, the sample is divided into two parts when there is a single threshold, while four thresholds lower the sample size to one-fifth of the original, it’s well known that fewer samples diminish estimate accuracy. In this study we extract more than 250 observations, and we split the series into a maximum of five partial sums. As a result, we still have about 50 observations, which is considered sufficient for the regression. Another drawback is that the model can’t be utilized when any variables are higher than order one, thus we run a unit root test first.
Data
Our data is divided into two parts. The first part is used for oil price decomposition and the second part is used to analyze the asymmetry between oil component shocks and China’s EPUs. The data definitions are shown in Table 1. The categorical EPUs of China provided by Huang and Luk (2020) are monthly data, so we ultimately set all variables to monthly frequencies, spanning the period from January 2000 to March 2021. Table 2 shows the descriptive statistics of the underlying variables and Figure 1 is a visual perspective of the time series for the data.
Data Definition.
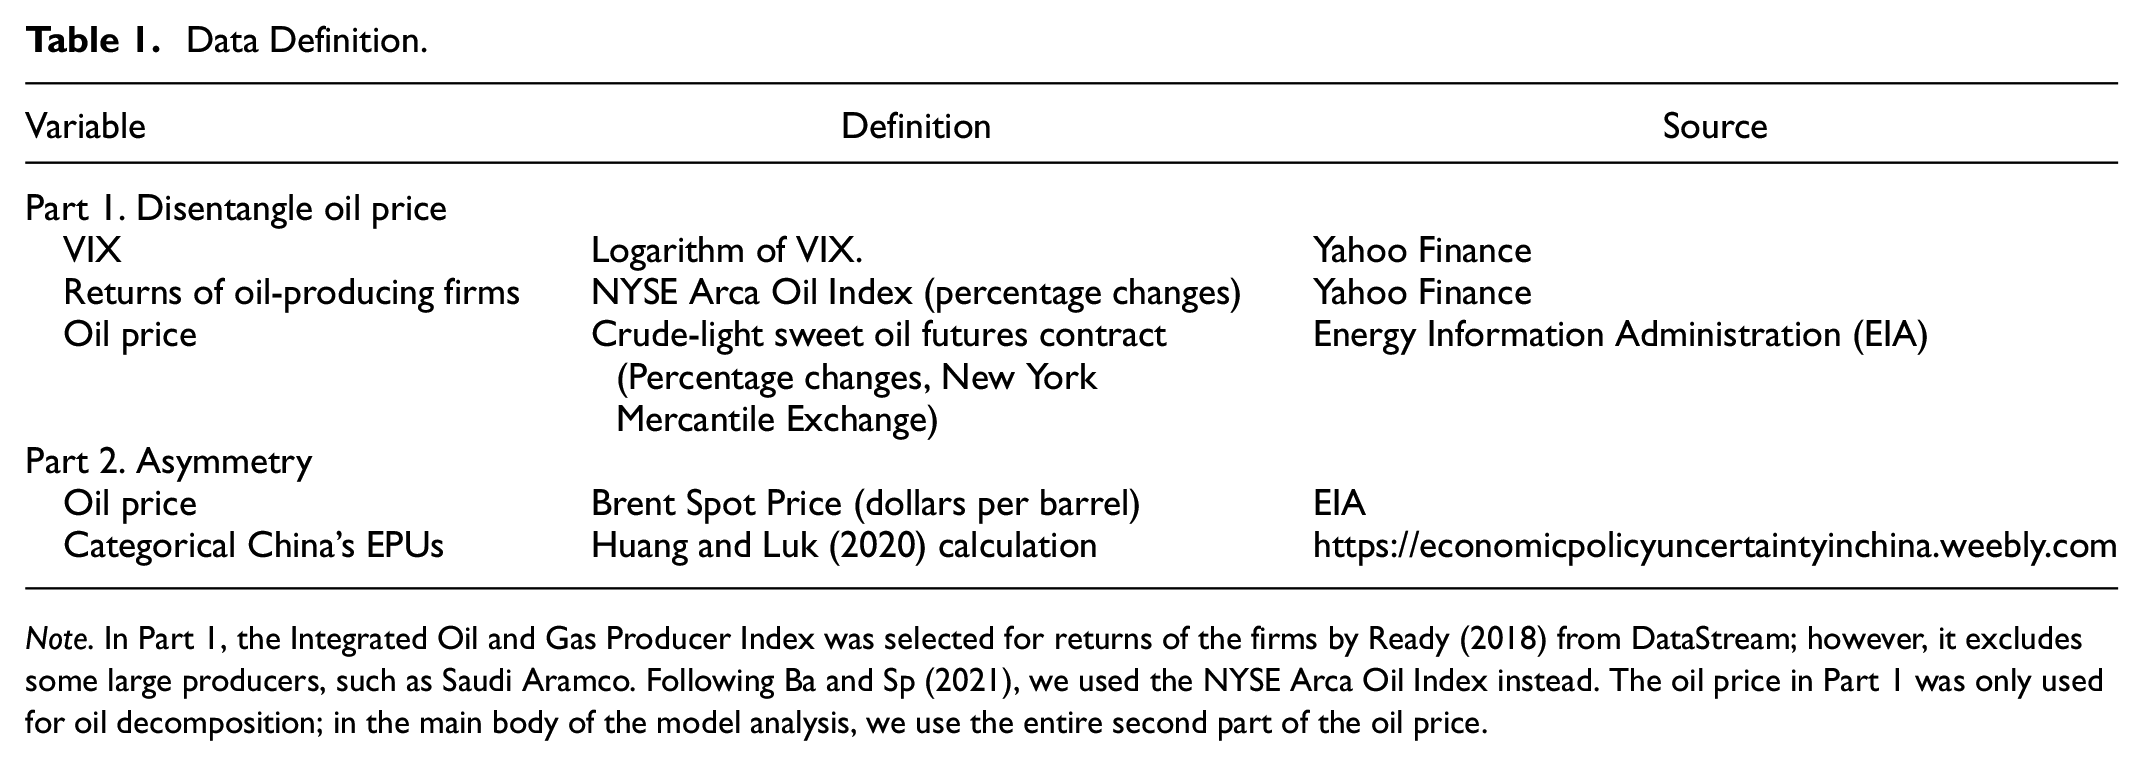
Note. In Part 1, the Integrated Oil and Gas Producer Index was selected for returns of the firms by Ready (2018) from DataStream; however, it excludes some large producers, such as Saudi Aramco. Following Ba and Sp (2021), we used the NYSE Arca Oil Index instead. The oil price in Part 1 was only used for oil decomposition; in the main body of the model analysis, we use the entire second part of the oil price.
Descriptive Statistics.


Variations of oil price and China’s categorical EPUs.
Empirical Analysis and Discussion
Following Pal and Mitra (2015, 2016, 2019), in ARDL, NARDL, and MTNARDL models, underlying variables should integrated if they are of order one I(1) or zero I(0). Hence, before conducting an asymmetric analysis, we conducted a unit root test by using an ADF test (Fuller, 1979) and a PP test (Phillips & Perron, 1988); we present the results in Table 3. The results indicate that all series are stationary at level value or first difference, namely I(0) or I(1); thus, the conditions for the application of the model are met.
Unit Root Tests.
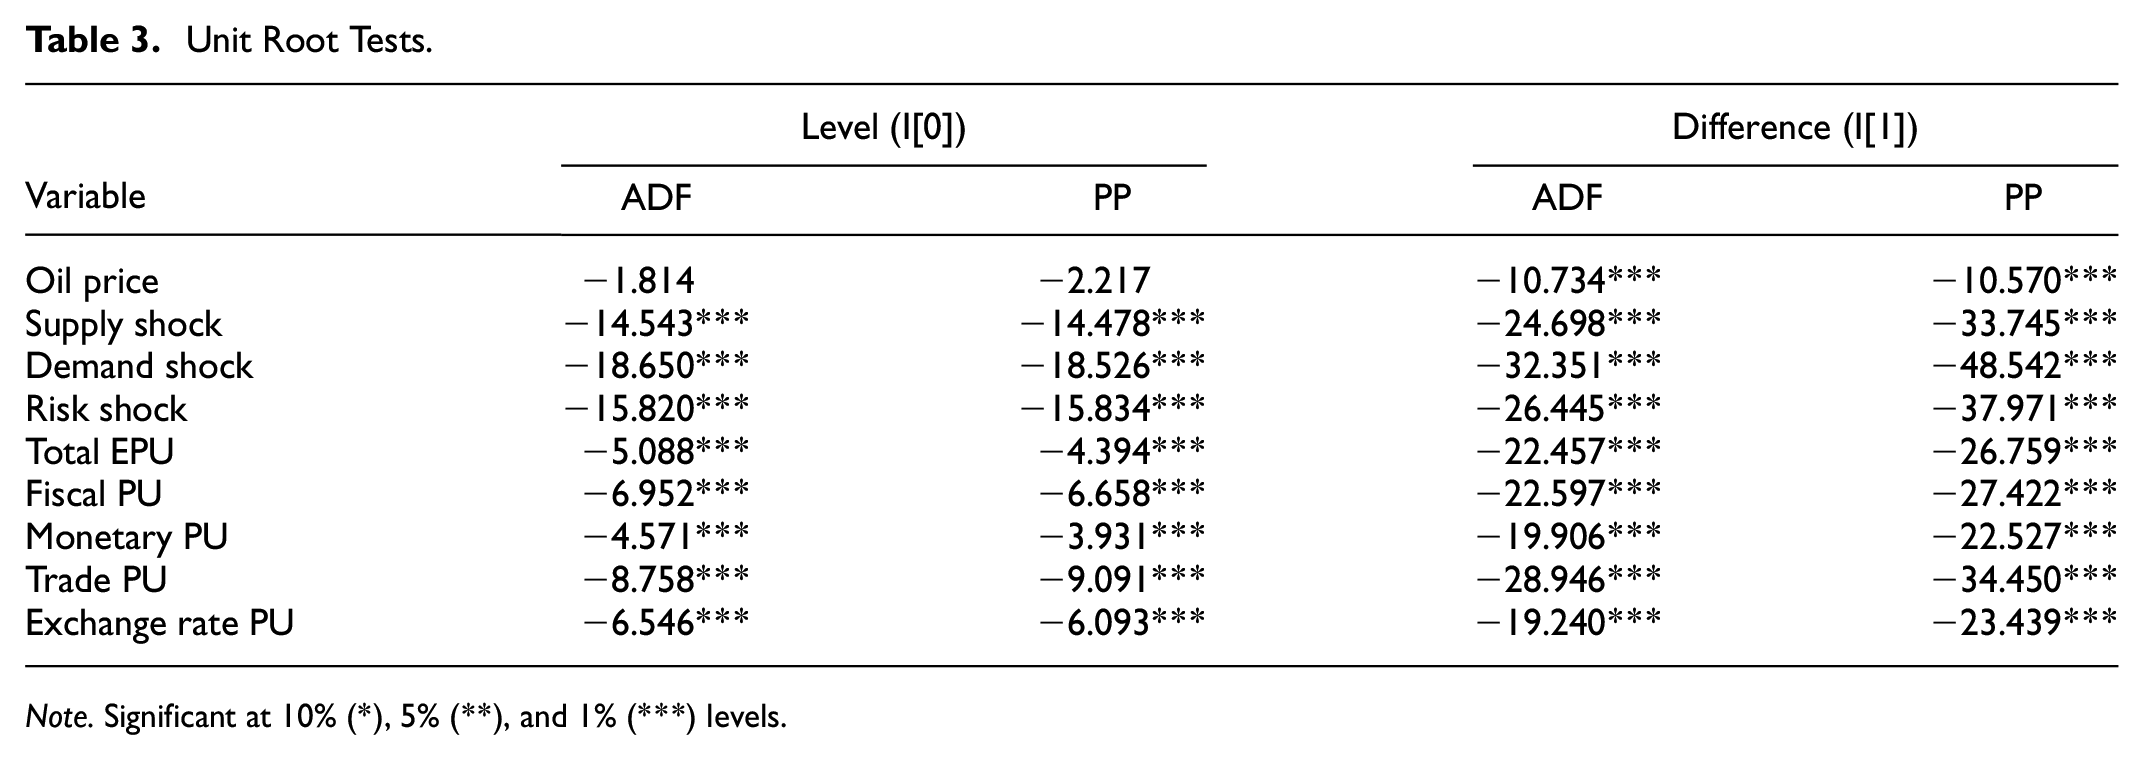
Note. Significant at 10% (*), 5% (**), and 1% (***) levels.
The cointegration relation among the variables was first evaluated by the ARDL model. Table 4 displays the results of the linear ARDL. For all four panels, the coefficients shown on the top half are for the short term and those on the bottom are for the long term. The F-statistics raw presents the value of the Wald test which was compared with the asymptotic upper bound critical value estimated by Pesaran et al. (2001). Besides, the −1 in brackets indicates the lagged one-period value. Due to the significance of the F-statistics, cointegrated relationships were confirmed not only between oil price and categorical EPUs, but also between most component shocks and categorical EPUs. However, the asymmetric effect cannot be evaluated using the ARDL model. To achieve our target, we built the NARDL model to split the independent variables—that is, oil price and variety shocks—into two partial sums to differentiate the responses of EPUs to increases (positive variation) and decreases (negative variation) in the oil price and to shocks. The results of the NARDL are displayed in Table 5.
ARDL Result.

Note. Significant at 10% (*), 5% (**), and 1% (***) levels. The F-statistic was calculated by the Wald test (with H0: θ1 = θ2 = 0) and was compared with the upper bound critical value.
NARDL Results.

Note. Significant at 10% (*), 5% (**), and 1% (***) levels. The F-statistic is calculated by the Wald test (with H0: θ1 = θ2 = 0) and is compared with the upper bound critical value.
The F-statistics in Table 5 re-verify the cointegration among underlying variables. This is consistent with the result of the ARDL. Wald-short provides the F-statistics of the Wald test which used to evaluate asymmetry in the short term (with H0: φ2i = φ3i), so does Wald-long which test the long-term asymmetry (with H0: θ2 = θ3). Panel A shows that, generally, in both the short term and the long term, there is only an asymmetric influence between oil price and trade PU. More explicitly, in the short term, there is an asymmetry between oil price and monetary PU, trade PU, and exchange rate PU, while in the long term, an asymmetry exists between oil price and total EPU, fiscal PU, and trade PU. These asymmetric results in the short term are similar to those reported by Pal and Mitra (2016, 2019).
The Wald-short only shows the asymmetric impacts of short-run supply shocks on trade PU, but the asymmetric impact of long-run supply shocks can be observed in all categorical EPUs. According to our findings, demand shocks have considerable asymmetric impacts on fiscal PU, trade PU, and exchange rate PU in the long term, but no asymmetry exists in the short term. From the perspectives of both supply and demand shocks, the asymmetric impact is much more significant in the long term than in the short term; this suggests the possibility of a sticky of economic policy, with most significant changes occurring in both the short and long term due to trade PU. Further, the asymmetric effect of oil price and three component shocks on trade PU in the short and long term is always significant. This may be because China is the world’s second-largest trading nation and international trade is very sensitive to such shocks. Regarding risk shocks, we follow Ready (2018) and Li and Guo (2022) and display unexpected variations in market discount rates.
In the above-mentioned analysis, the NARDL model does not precisely identify all small to large variations in independent variables. Therefore, to examine the asymmetric impact more precisely, we employed the MTNARDL model with the 30th and 70th quantile thresholds and thus split the variables into three partial sums. The results of the two-threshold NARDL model based on equation (10) are shown in Table 6. The significant coefficients of
Results of Two-Threshold MTANARL Model.

Note. Significant at 10% (*), 5% (**), and 1% (***) levels. The F-statistic is calculated by the Wald test (with H0: θ1 = θ2 = 0) and is compared with the upper bound critical value.
With quantiles of 20th, 40th, 60th, and 80th, we decomposed the oil price series into five partial sums to ensure the results were legitimate and to discover any probable unequal link between oil price and categorical EPU. Table 7 shows the outcomes of equation (11). Similarly, the preceding conclusions have been tested and are correct. In Tables 4 and 5, some of the coefficients of the three kinds of shocks on fiscal policy uncertainty are not remarkable. It is very clear that there are no asymmetric impacts in the short term, but that there is a very strong asymmetric impact in the long term.
Results of Four-Threshold MTNARDL Model.
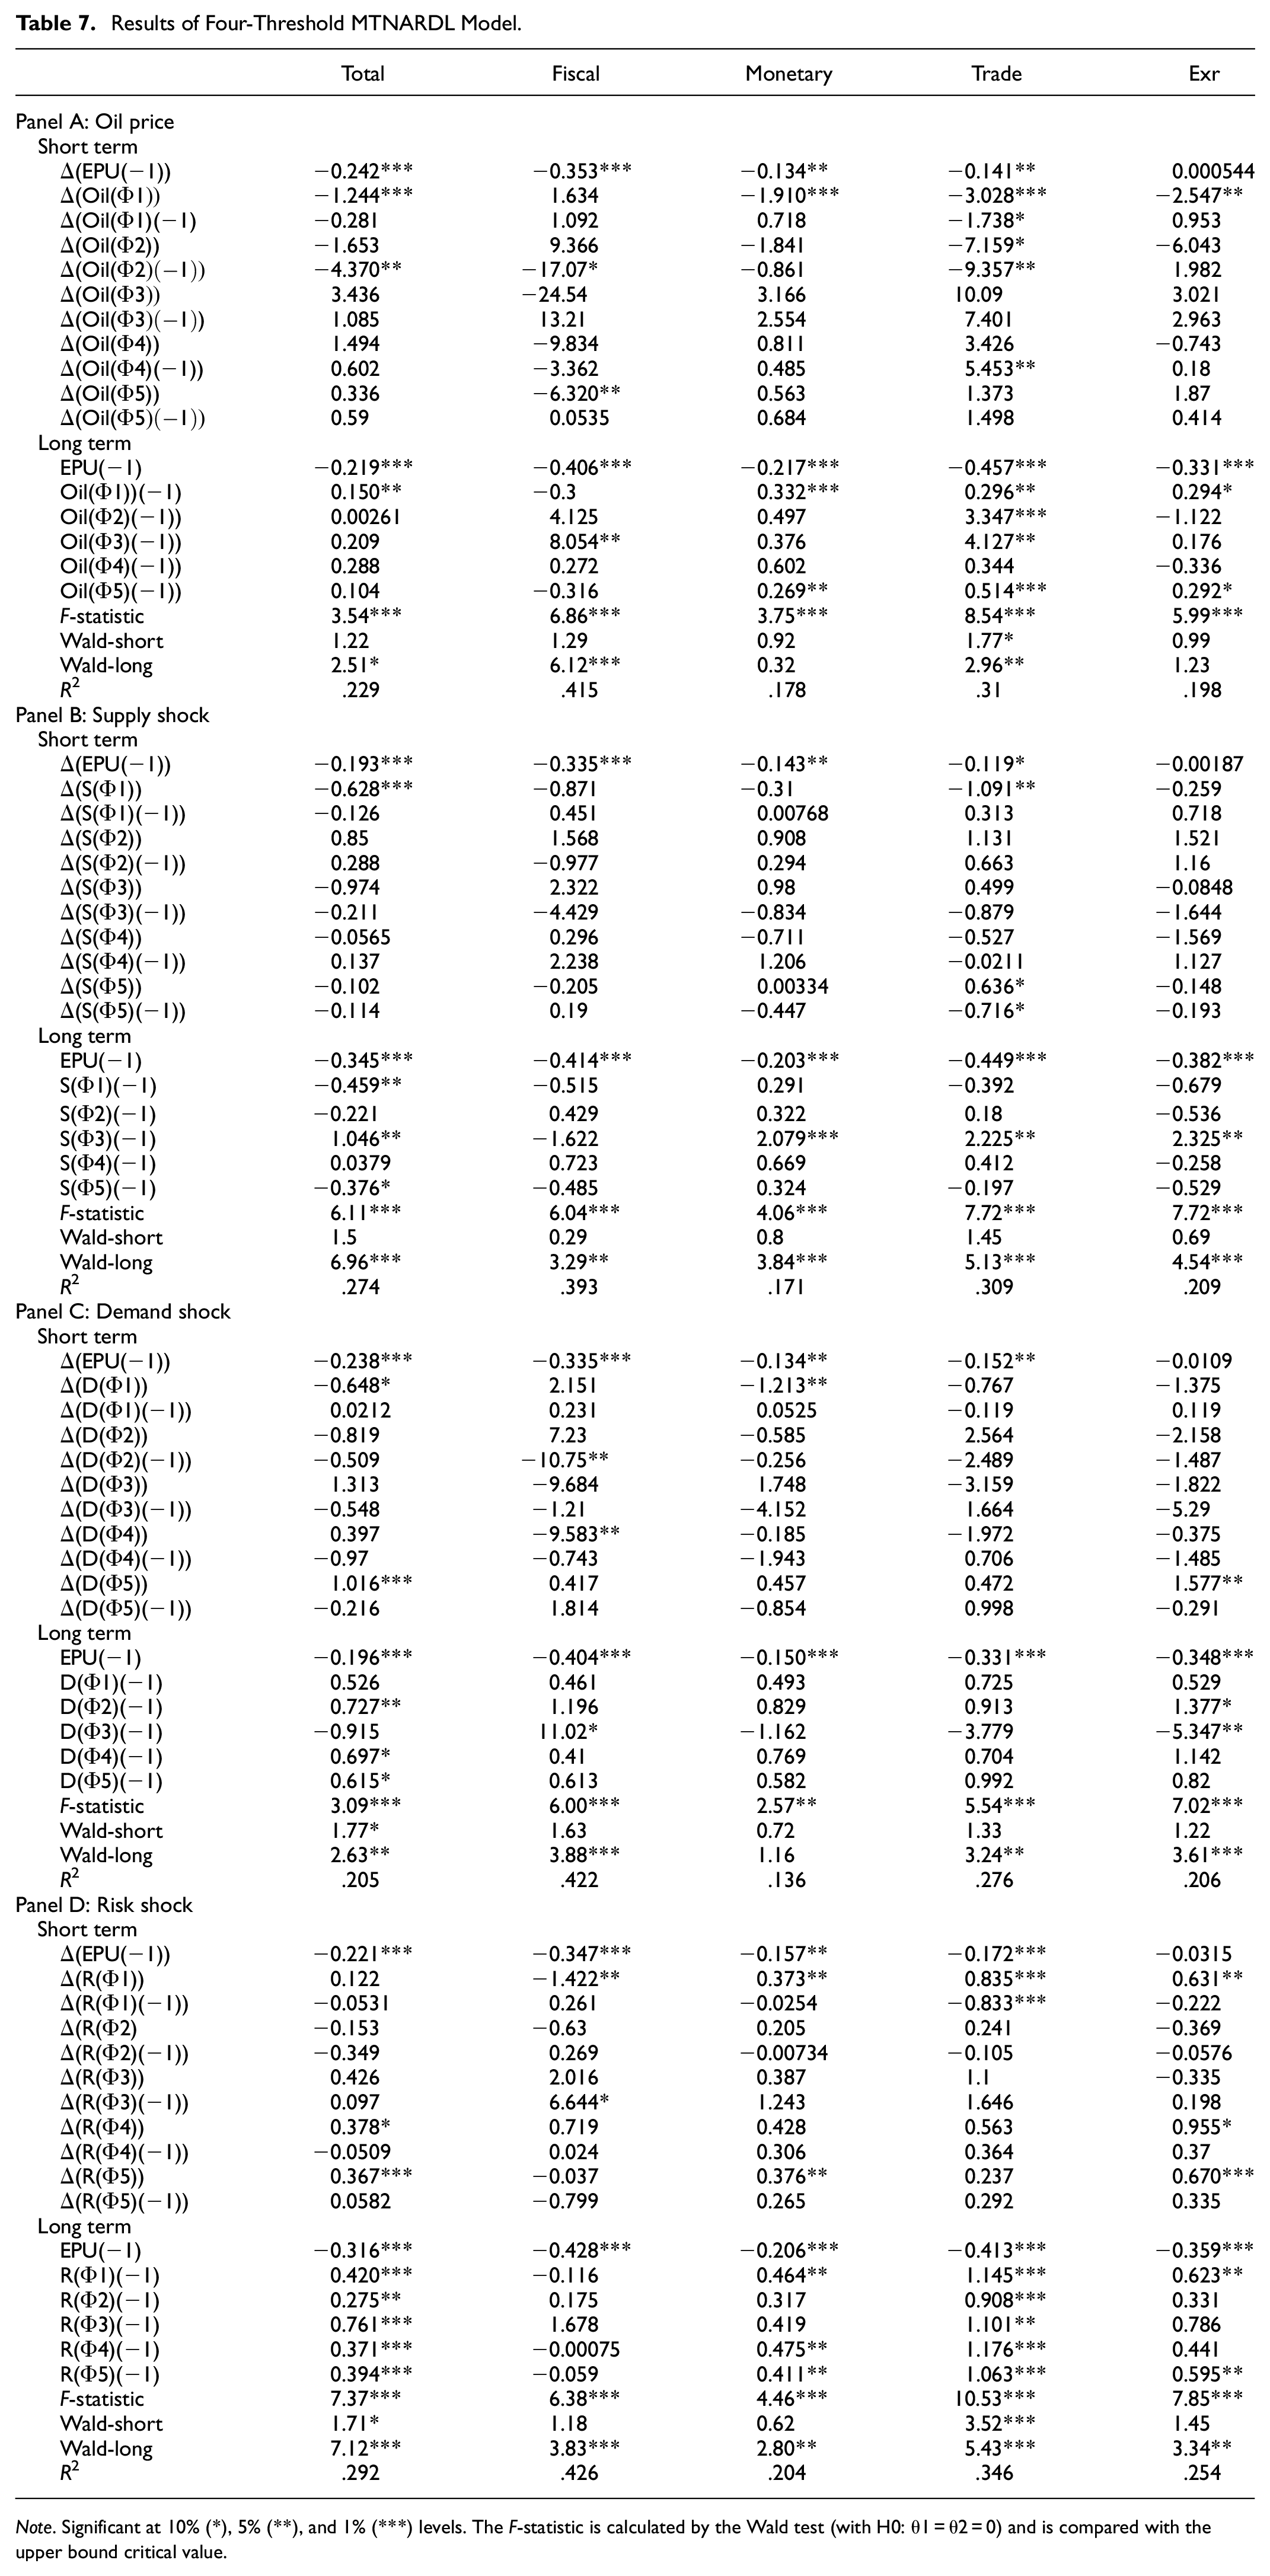
Note. Significant at 10% (*), 5% (**), and 1% (***) levels. The F-statistic is calculated by the Wald test (with H0: θ1 = θ2 = 0) and is compared with the upper bound critical value.
Regarding MPU, demand shocks bring significant negative impacts. Notably, referring to
Regarding trade policy uncertainty, the impact of the lowest threshold supply shock is only reduced in the short run (refer to
Regarding exchange rate PU, the coefficients of
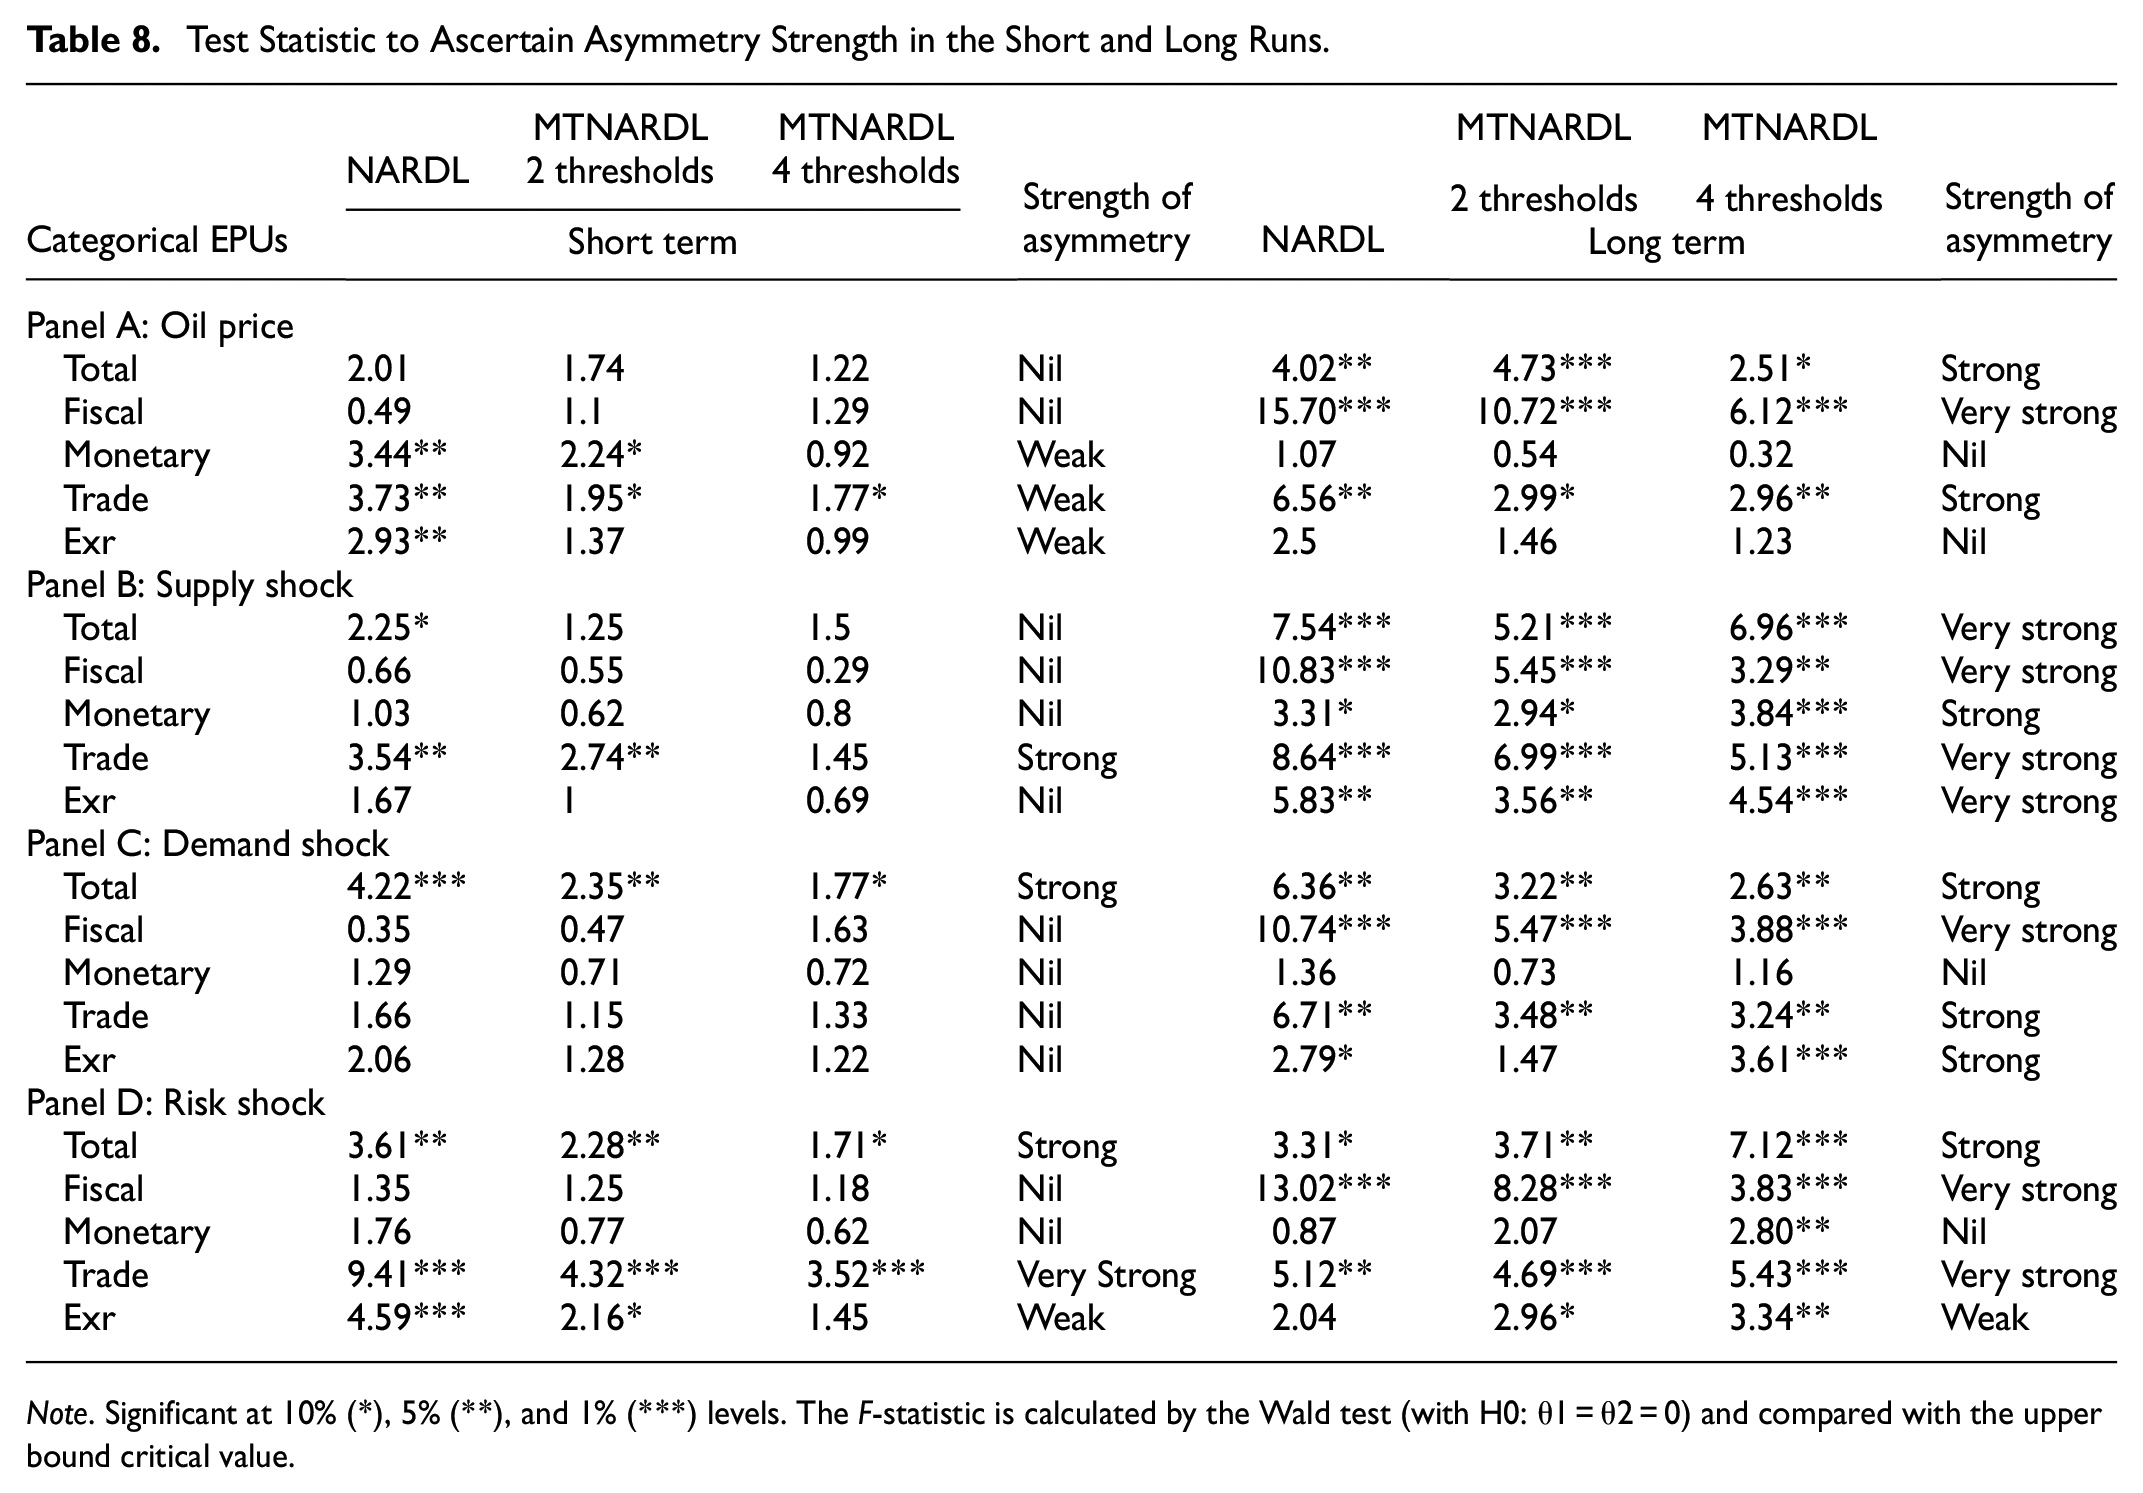
Regarding the NARDL and two and four thresholds MTNARDL models, Table 8 sums up the results of the influences of various shocks on categorical EPUs. To assess the strength of the asymmetric influence in the short and long runs, we collected all Wald short and Wald long values from Tables 5 to 7. The null of no asymmetry in Panel A solely applies to short-run fiscal PU. The rest have weak asymmetric effects. While this implies a weak asymmetric transmission among monetary PU, trade PU, exchange rate PU, and oil price change, the asymmetric impact between oil price and fiscal PU and trade PU are strong in the long run.
Test Statistic to Ascertain Asymmetry Strength in the Short and Long Runs.
Note. Significant at 10% (*), 5% (**), and 1% (***) levels. The F-statistic is calculated by the Wald test (with H0: θ1 = θ2 = 0) and compared with the upper bound critical value.
Panels B and C of Table 8 show almost identical results. In particular, the strength of asymmetry is nearly absent in the short term for all models (NARDL, MTNARDL with two and four thresholds), but asymmetry is very strong in the long term. This indicates that the supply and demand shocks have the same effect on categorical EPU. (i.e., null in the short term, but very strong in long term). These results show that the effects of both supply shock and demand shock are almost equal; demand shock does not lead the impact (Antonakakis et al., 2014; B et al., 2018; Kang & Ratti, 2013b; Ro Ba Ys, 2012). In Panel D (risk shock), asymmetry is very strong for trade PU, but weak for exchange rate PU in the short term; however, in the long term it is very strong for fiscal and monetary PU.
Conclusion and Policy Implications
We examined the asymmetric responses of categorical EPUs to oil price and shocks. We followed the approach of Ready (2018) and Li and Guo (2022) and decomposed the oil price change into supply, demand, and risk shocks. Consequently, we set up an empirical structure to catch uneven pass-through utilizing the MTNARDL model provided by Pal and Mitra (2015, 2016). In contrast with traditional NARDL, which disentangles the independent variable to a positive and negative fractional total, we decomposed the oil price change and variety shocks into three and five partial sums. On the basis of the analysis, we yielded careful assessments and more point by point and moment results. More completely, we feature the consequences of the ARDL and NARDL models to uncover the nexus among underlying variables.
The empirical results are as follows: First, the strength of asymmetry between oil price and monetary PU, trade PU, and exchange rate PU is weak in the short term. More specifically, through an analysis of the NARDL model, oil price proved very significant in these three kinds of EPUs in the short term. However, the asymmetric influence only exists given trade PU in the MTNARD model (two and four thresholds). In the long run, the strength of asymmetry is very strong in fiscal PU and trade PU. This implies that when oil prices fall the EPU declines at a slower rate, but increases at a faster pace when they rise. Second, with respect to supply shocks, there are strong asymmetries for all categorical EPUs in the long run, wherein only trade PU has strong asymmetry in the short run; for demand shocks, strong asymmetry exists in the long run for all categorical EPUs except monetary PU, and no asymmetry exists in the short term for all categorical EPUs. Third, regarding the risk shock, very strong asymmetry exists in trade PU in the short and long term, while it only exists in fiscal uncertainty in the long term. Most notably, the asymmetry between oil price shocks and trade PU is significant in most cases. These findings are highly consistent with the economic reality, which is inextricably linked to China’s important role in global industrial chains and reflects the depth of its participation in the global division of labor.
Our empirical analysis indicated that asymmetric impact is more remarkable in the long run in China. It is unprecise to expect that oil price and component shocks have indistinguishable and remarkable impacts on straight out EPU because every EPU holds various sources and channels of transmission. Accordingly, oil price shocks may impact EPUs in a different manner. Future studies may expand on the current one by applying this framework to different countries or industries. Moreover, the usage of MTARDL could be extended.
Our empirical results have three key policy implications. Firstly, Chinese enterprises should pay more attention to the asymmetric influence supply shocks have on trade PU both in the short run and long run; in particular, they should be attentive to the fact that this impact intensifies as the oil price declines. Export enterprises should adjust their quotations based on the production cost to ensure the international competitiveness of their products in global markets. Import enterprises should keep an eye on the price of their import products in order to guarantee business profits and consumer welfare. Secondly, both Chinese enterprises and policymakers ought to identify the source of oil price shocks; long-run supply and demand shocks have the greatest impact for all categorical EPUs. Production and investment activities of enterprises need to be flexibly adapted and some policy tools should be followed up over time. Thirdly, because the asymmetric relationship between oil price shock and trade PU is significant in most cases, enterprises and policymakers need to prioritize trade issues.
Footnotes
Declaration of Conflicting Interests
The author(s) declared no potential conflicts of interest with respect to the research, authorship, and/or publication of this article.
Funding
The author(s) received no financial support for the research, authorship, and/or publication of this article.