
Abstract
Tourist experience research has been increasing in practitioners and academics. The study collected 1,079 tourist experience related articles published in the Web of Science (WOS) core database to summarize research on tourist experience from 2007 to 2019 and to explore research hotspots and trends related to the topic. CiteSpace analysis was used from the selected 1,045 articles to identify and visualize the evolution of knowledge. The results revealed that the major disciplines for research tourist experience are Hospitality Leisure Sport Tourism disciplines. The most influential authors are mostly from high-yield institutions. The high-yield countries (regions) are in the USA, China, Australia, England and Italy. In addition, three hotspots research topics and contemporary trends are presented.
Introduction
Tourist experience has always been at the heart of the travel industry (Loureiro, 2014). In the last dozen years, studies on tourist experience have been drastically advanced and published. Thus, it is quite essential to provide a review of the tourist experience literature and situate it within the visualized context. This study aims to identify major knowledge clusters, most influential and high-yield countries (regions), institutions, authors, most co-citation journals, current research hotspots, and research trends on the tourist experience related publications in the WOS core database from 2007 to 2019. In this way, this study presents a holistic overview visualization of tourist experience literature based on CiteSpace software. In addition, it can assist academic researchers and management practitioners in learning about topics and trends of interest in the field of tourist experience.
This paper is arranged as follows. First, based on literature analysis, this study forwards current concepts on tourist experience, analyzes the research value of tourist experience, identifies the shortcomings of current research on tourist experience and presents a new solution. Then, the method section describes CiteSpace, data collection and using CiteSpace procedure. The results section a comprehensive research outputs will be explained, and finally, the conclusions provide an excellent understanding of key findings and propose future research direction. Here follow the three sections of the introduction.
What is the Concept of Tourist Experience?
While the difficulty of defining the concept of a tourist experience due to multifaceted nature (H. Chen & Rahman, 2018), many scholars have presented insights into various definitional components. Among others, components can be tourist factors such as tourist perceptions(e.g., Yoo & Gretzel, 2011) and motivation (e.g., D. Wang et al., 2012); psychological factors such as seven experiential dimensions (e.g., J. H. Kim et al., 2012); temporal factors such as pre-trip, during-trip and post-trip (e.g., Gretzel et al., 2006); influence factors such as meaningful experiences (e.g., Gallarza et al., 2013; Noy, 2004); evaluation factors such as tourist experience quality (e.g., Jin et al., 2015; Wu & Li, 2017), etc. Furthermore, an emotional arousal may be considered a result of a tourism experience (Oh et al., 2007). Clawson and Knetsch (1966) proposed the before the trip and after the tourist include influences and personal outcomes. Apparently, the definition of tourist experience does not appear to have reached a consensus on academics.
Experience varies from person to person due to subjectivity and emotional (Uriely, 2005). Hence, types of personal resources, external factors and situational factors have a decisive influence on experience formation mode (Walls et al., 2011). In this review, we define tourist experience as: An individual’s subjective evaluation and undergoing of events relevant to his/her tourist activities in pre-trip, during-trip and post-trip (Tung & Ritchie, 2011).
Why is Tourist Experience Important?
As has been highlighted in recent tourism literature, tourist experience is viewed as a hot topic for both practitioners and academics (Bosangit et al., 2015) and this research has developed over several decades. Tourist experiences are a core process of memorable trips (Coelho et al., 2018), and also be viewed as socially and culturally produced (Tussyadiah & Fesenmaier, 2009).With the development of the experience economy, morphing from service-based to experience-based (Pine & Gilmore, 1998), such as VR application (Barnes, 2016; Moorhouse et al., 2018). Experience may be recognized as the key to success, innovation and competitiveness in travel (Ellis & Rossman, 2008; Stamboulis & Skayannis, 2003). Sustainable tourist experience can enhance destination sustainability and experience value as a means of competitive edge (Lu et al., 2017; Smit & Melissen, 2018). Conversely, negative tourism experiences result in undesirable future behaviors and influence tourists’ negative experiences (Kin et al., 2020). However, tourism experience as the remedy to nostalgia has positive effects in return for cravings causing pain and guiding future research (Christou, 2020). Sorensen et al. (2018) considered the tourist experience occupy this critical place in tourism industry, mainly because tourist experiences are experiences of place and the place experience is central to value creation in tourism. From a marketing perspective, the tourist experience is the moment when tourism consumption and tourism production meet, and can create value (Andersson, 2007). It identified as a key means to attract new tourists or keep repeat visitors (Subramaniam et al., 2018). For in person travel experience, tourist experience as a spatially and temporally interconnected process involving pre-trip, during-trip and post-trip stages (Gretzel et al., 2006; T. Zhang, 2020). It’s worthwhile considering that traveler activities should consider a perfect trip planning and arouse a desire in the pre-trip stage (Volo, 2010).
Against this background, some scholars have made significant progress in the total number of publications on the tourist experience field since 2007 (Figure 1). These research analysis are presented from different perspectives, including the qualitative approach to digging factors of memorable tourism experiences (J. H. Kim et al., 2012; Sthapit & Coundounaris, 2018); quantitative approach to explore the effect of rural tourism experience economy on place attachment (Inversini, 2018; Loureiro, 2014); tourist experience to the impact of the whole tourism process (D. Wang et al., 2016); tourist experience and multidisciplinary research, such as Sociological aspect (Larsen, 2007), Psychological aspect (Skavronskaya et al., 2020; Wei et al., 2019), and Management (Chung et al., 2020; Sorensen & Jensen, 2015); the relationships between social media and tourist experience (Conti & Heldt Cassel, 2020; J. Kim & Fesenmaier, 2017), etc. However, according to these studies, despite the tourist experience having enormous potential and requires further study (Pizam, 2010) little thoroughly understand about the overall knowledge theory of tourist experience. Thus, many scholars suggest the need to provide commentary on tourist experience development research in the last decade. To deal with these concerns and suggestions, we provide a review of the existing literature in the area. This will deepen tourist experience study and continue to provide useful references for other researchers.

Number of publications per year.
Tourist Experience, Knowledge Mapping and CiteSpace
In the academic world, reviews and examinations of previous research are defined as valuable activities (Webster & Watson, 2002) because the process of developing academic disciplines relies on the continuous construction of knowledge theory. Knowledge mapping is a process of charting, mining, analyzing, sorting, and displaying knowledge (Shiffrin & Börner, 2004), and providing a comprehensive and transparent format to visualize them (Speel et al., 1999).With the extensive application of visualization tools, science and technology management domain has attracted much attention due to use visualization analysis (Boyack et al., 2002). CiteSpace is one of the visualization tools, including bibliometric analysis, data mining algorithms and visualization methods developed (C. Chen, 2004), and reducing cognitive burden to understand the intricacies of structure (C. Chen, 2006). In order to verify the rationality of the above discussion, we searched for relevant literature in the WOS core database. In tourism research visual context, Yu et al. (2021) presented 159 articles of the pro-environmental behavior of tourists overall characteristics, core knowledge, and knowledge evolution with the help of CiteSpace and Vosviewer. Jiang et al. (2019) analyzed the network structure of the tourism crisis and disaster management field by using CiteSpace. Q. Zhang et al. (2016) designed a visual map on the knowledge domain of smart tourism research in China. Fang et al. (2018) further proposed the overall visualization structure of climate change and tourism with CiteSpace as a scientometric analysis. Su et al. (2019) studied intangible cultural heritage literature from the WOS core database by applying CiteSpace research tools. Furthermore, CiteSpace has been widely used for academic research by visualization knowledge structure, obtaining visualization in study of acupuncture for lower back pain (Liang et al., 2017), analyzing knowledge mapping of social commerce research (Cui et al., 2018), exploring Alzheimer’s disease knowledge domain and emerging trends (Liu et al., 2019).
Despite CiteSpace becoming increasingly prevalent among various academic fields, as far as we know, no one has tried to use CiteSpace to analyze tourist experience literature. Previous reviews on tourist experience research have adopted quantitative methods (e.g., J. Kim & Fesenmaier, 2017), qualitative methods (e.g., Tung & Ritchie, 2011), and a combination of quantitative and qualitative methods (e.g., H. Chen & Rahman, 2018). Therefore, in order to provide a holistic overview visualization of tourist experience literature based on CiteSpace software to analyze publications in the WOS core database from 2007 to 2019. Specifically, we set the following four key objectives: (1) to identify the major disciplines on tourist experience research; (2) to understand the top contributors and research cooperation features among scholars; (3) to illustrate the knowledge evolution of the main co-citation network; (4) to suggest the emerging topics for future research directions on tourist experience. Only in this way can we get a clear and intuitive picture of the evolution of tourist experience knowledge and theories, and the cutting-edge development trends. Of course, this study is truly desirable. It not only points out the direction for future academic research on tourist experience, but also presents several practical significance for management practitioners.
Methodology
Theory and Conceptual
Research Front
Price (1965) first proposed a research front concept. He found scientists more accustomed to citing recently published articles. In a certain field, a research front usually involves scientists actively citing the main articles. A research front is formed from 40 to 50 recent articles. More importantly, a research front appears to reflect up-to-date theoretical trends and topics in the research field (C. Chen, 2006).
Intellectual Base
In bibliometric terms, there is the most visible difference between the two. One is the citing articles compose a research from, while the other is the cited articles make up an intellectual base (Persson, 1994). Besides, Persson (1994) also found an intellectual base appears to remain constant over the long term. C. Chen (2006) described the formation of an intellectual base based on the co-citation network formed by cited literature.
Knowledge Map
Knowledge map is conceived as a process based on the analysis of the features or meanings of knowledge areas, and use these methods or tools to visualize them in a comprehensive way (Speel et al., 1999). It has become a major step in knowledge management and is applied to many fields to construct knowledge maps. C. Chen (2003) found that the knowledge map aim was to visualize knowledge and carry out knowledge discovery by extracting published literature.
CiteSpace
This study applied a bibliometric tool CiteSpace 5.4.R1 by Prof. Chaomei Chen to identify articles on tourist experience in the WOS core database from 2007 to 2019. CiteSpace is a scientometrics and visualization software. Specifically, CiteSpace software can perform comprehensive analysis and generate visualization maps of countries, authors, institutions, keywords, cited literature and journals. Using the CiteSpace software can help researchers understand the basic knowledge of the discipline, find classical literature in the field, discover research frontiers, and clarify the context of research evolution (C. Chen, 2016). Compared to previous visualization tools, the clarity and interpretability of visualization are enhanced by CiteSpace software’s visual analysis capabilities (C. Chen, 2006).
Data Collection and Processing
There are three steps in collecting data for CiteSpace analysis. The first step is to build a bibliographic database that has a highly referred purpose by giving wide-rang reputable journals. The WOS is the most commonly used resource in literature, including SCI, SSCI, AHCI, ESCI, and CPCI databases cover approximately 12,000 top journals worldwide (Corley et al., 2013; Gerbic & Stacey, 2005). Generally, the ideal data source of bibliometric analysis derives from WOS (van Leeuwen, 2006).The data format processed by CiteSpace software is also based on the WOS data download format (C. Chen, 2015).Therefore, this study chose the WOS core database as the data source to provide more complete references bibliographic information and citation information.
The second step is selecting references, which is to search in the WOS Core database using the appropriate keywords. The researcher should ensure the validity and representativeness of keywords and check the relevance of each study. To acquire the highest possible number of references are related tourist experience, the words searched by using the terms “tourism experience,” “tourist experience,” “travel experience” or “traveling experience” in title, abstract, or keywords of the references (Cavanagh, 1997; Polit & Beck, 2004). Search words are determined mainly from top travel journals and books. Usually, these journals have high impact factors, such as Tourism Management (13.761), Annals of Tourism Research (13.44), International Journal of Hospitality Management (11.129), and Journal of Travel Research (10.508), etc. In addition, the type of literature is limited to journal articles and conference papers (Nunkoo et al., 2013) and select the English language as the search strategy. 1,079 references related to tourist experience were published. With CiteSpace removing duplicates, a total of 1,045 records were retained in the 2007 to 2019 timespan. However, the reasons for choosing this period (2007–2019) are, on the one hand, the number of published tourist experience articles has been increasing and has reached 15 since 2007 (Figure 1). On the other hand, tourist experience has remained an important focus of attention since the 1970s and has become a key research issue in academe and practice. (e.g., Filep & Pearce, 2014; Frochot & Batat, 2013; Jennings & Nickerson, 2006; Prebensen et al., 2014).
The third step is to pre-struct the “data folders” and “project folders,” then select the “Plain text” format and export them as the “Full Record and Cite References” in a “data folders” named download-xxx. Finally, run CiteSpace software, select countries, authors, institutions, keywords, reference and cited journals nodes according to the requirements, and carry out visual mapping of the literature. In addition, based on C. Chen (2015) suggestion, CiteSpace analysis sets the relevant thresholds as follows: (1) We collected data on tourist experience literature from 2007 to 2019, and we selected 1 year as time slice as the 12 years timespan is small. (2) To gain more intuitive and comprehensive atlas display, the set Top N = 50, it means to extract N references with the highest citation times in each time slice. The larger N is, the more comprehensive the network is generated. (3) In Threshold Interpolation setting, C, CC, and CCV are set to 2, 4, and 3 respectively. C is the lowest citation times. Only literature that meets this condition can participate in the following operation. CC is the co-citation times in this slice. CCV is the normalized co-citation time. (4) In network pruning modes analysis, this study utilizes a pathfinder network pruning method as to its completeness. For other indicators, using default values in CiteSpace analysis. In terms of charts generated, each three-line table is generated based on the corresponding visualization map. Specifically speaking, as the visualization maps run complete, we have easy access to the automatically generated narratives on the visualization map by clicking generate a narrative under export on top of CiteSpace software, including major cluster, citation counts, bursts, centrality and sifma. Based upon these contents, it’s easily drawn charts in this study.
Using CiteSpace Procedure
To review the tourism experience literature from 2007 to 2019 in a more intuitive and comprehensive way, using CiteSpace, major paths research were detected. More specifically, we set the following four main analysis contents in turn:
Cluster Analysis
Clustering is a process of collecting physical or abstract objects into multiple groups based on analyzing the similarity of objects. The clusters label generated from using title terms and LLR (log-likelihood ratio) weighting algorithm. LLR adopted professional words to stand for the core concept of each cluster. Usually, there are similar high elements within a cluster, and vice versa (C. Chen, 2003). For example, we are drawing on past literature and other relevant disciplines research to build the knowledge clusters in tourist experience research by using title terms and LLR weighting algorithm. Thus, it lays a foundation for acquiring knowledge of tourist experience research.
Collaboration Analysis
The bibliographic record analytical process consists of title, abstract, and authors with addresses by CiteSpace (C. Chen et al., 2007). For example, the authors are called co-authors or co-authorship if there is a collaborative relationship between authors. Besides, scientific collaboration has developed the primary form in scientific research. In this study, the authors, institutions and countries’ collaborative networks are analyzed. Collaboration research focuses on identifying major knowledge maps and most cited countries/institutions/scholars in tourist experience fields. For example, the cooperative relationship between co-authors, co-institutions, and co-countries. This not only broadens the way of academic exchange and knowledge dissemination (C. Chen, 2006), but also helps to solve complex scientific problems (Sonnenwald, 2007).
Co-Citation Analysis
Co-citation refers to the frequency of two earlier literature being cited at the same time by the later literature (Small, 1973). We construct the co-citation network map of journals by using the graph-theoretical method in Citespace (C. Chen, 2004), which provides clues to understanding the evolution of the journal specialty mechanism development and mapping the intellectual structure of science. In fact, all the analysis found was effectively related to co-citation in the CiteSpace knowledge map. C. Chen et al. (2010) discussed the character and interpreted the structure and dynamics of co-citation clusters from a multiple-perspective co-citation analysis. This review analyzes the co-cited journals about tourism experience.
Keyword Co-occurring Analysis
The effective way to hot research topics and trends is analysis frequency of popular keywords used in articles and references with citation bursts. A time zone view of the keyword map can clearly identify the evolution of the tourism experience research content (2007–2019); and the burst of citation will project the most recent research trends. Therefore, CiteSpace is considered a way of identifying future research directions with this type of burst change. There are two main procedures in keyword co-occurring analysis by CiteSpace. One is to calculate the keywords frequency by extracting keywords, then separate and classify them; the other is keyword co-occurring analysis based on acquiring keyword co-occurring matrix (C. Chen, 2004, 2006).
Results
Tourist Experience Knowledge Clusters
Drawing past literature and researching relevant disciplines will help the establishment of new disciplines (Li et al., 2017). Table 1 presents the top 10 academic disciplines of tourist experience research on the Web of Science, the greatest contribution is Hospitality Leisure Sport Tourism (673 articles, 62.32%), followed by Management (146 articles, 13.52%) and then Environmental Studies (110 articles, 10.19%). It shows that scholars are more inclined to interdisciplinary research into tourist experience, especially the play an important role in Hospitality Leisure Sport Tourism.
Top 10 Academic Disciplines.

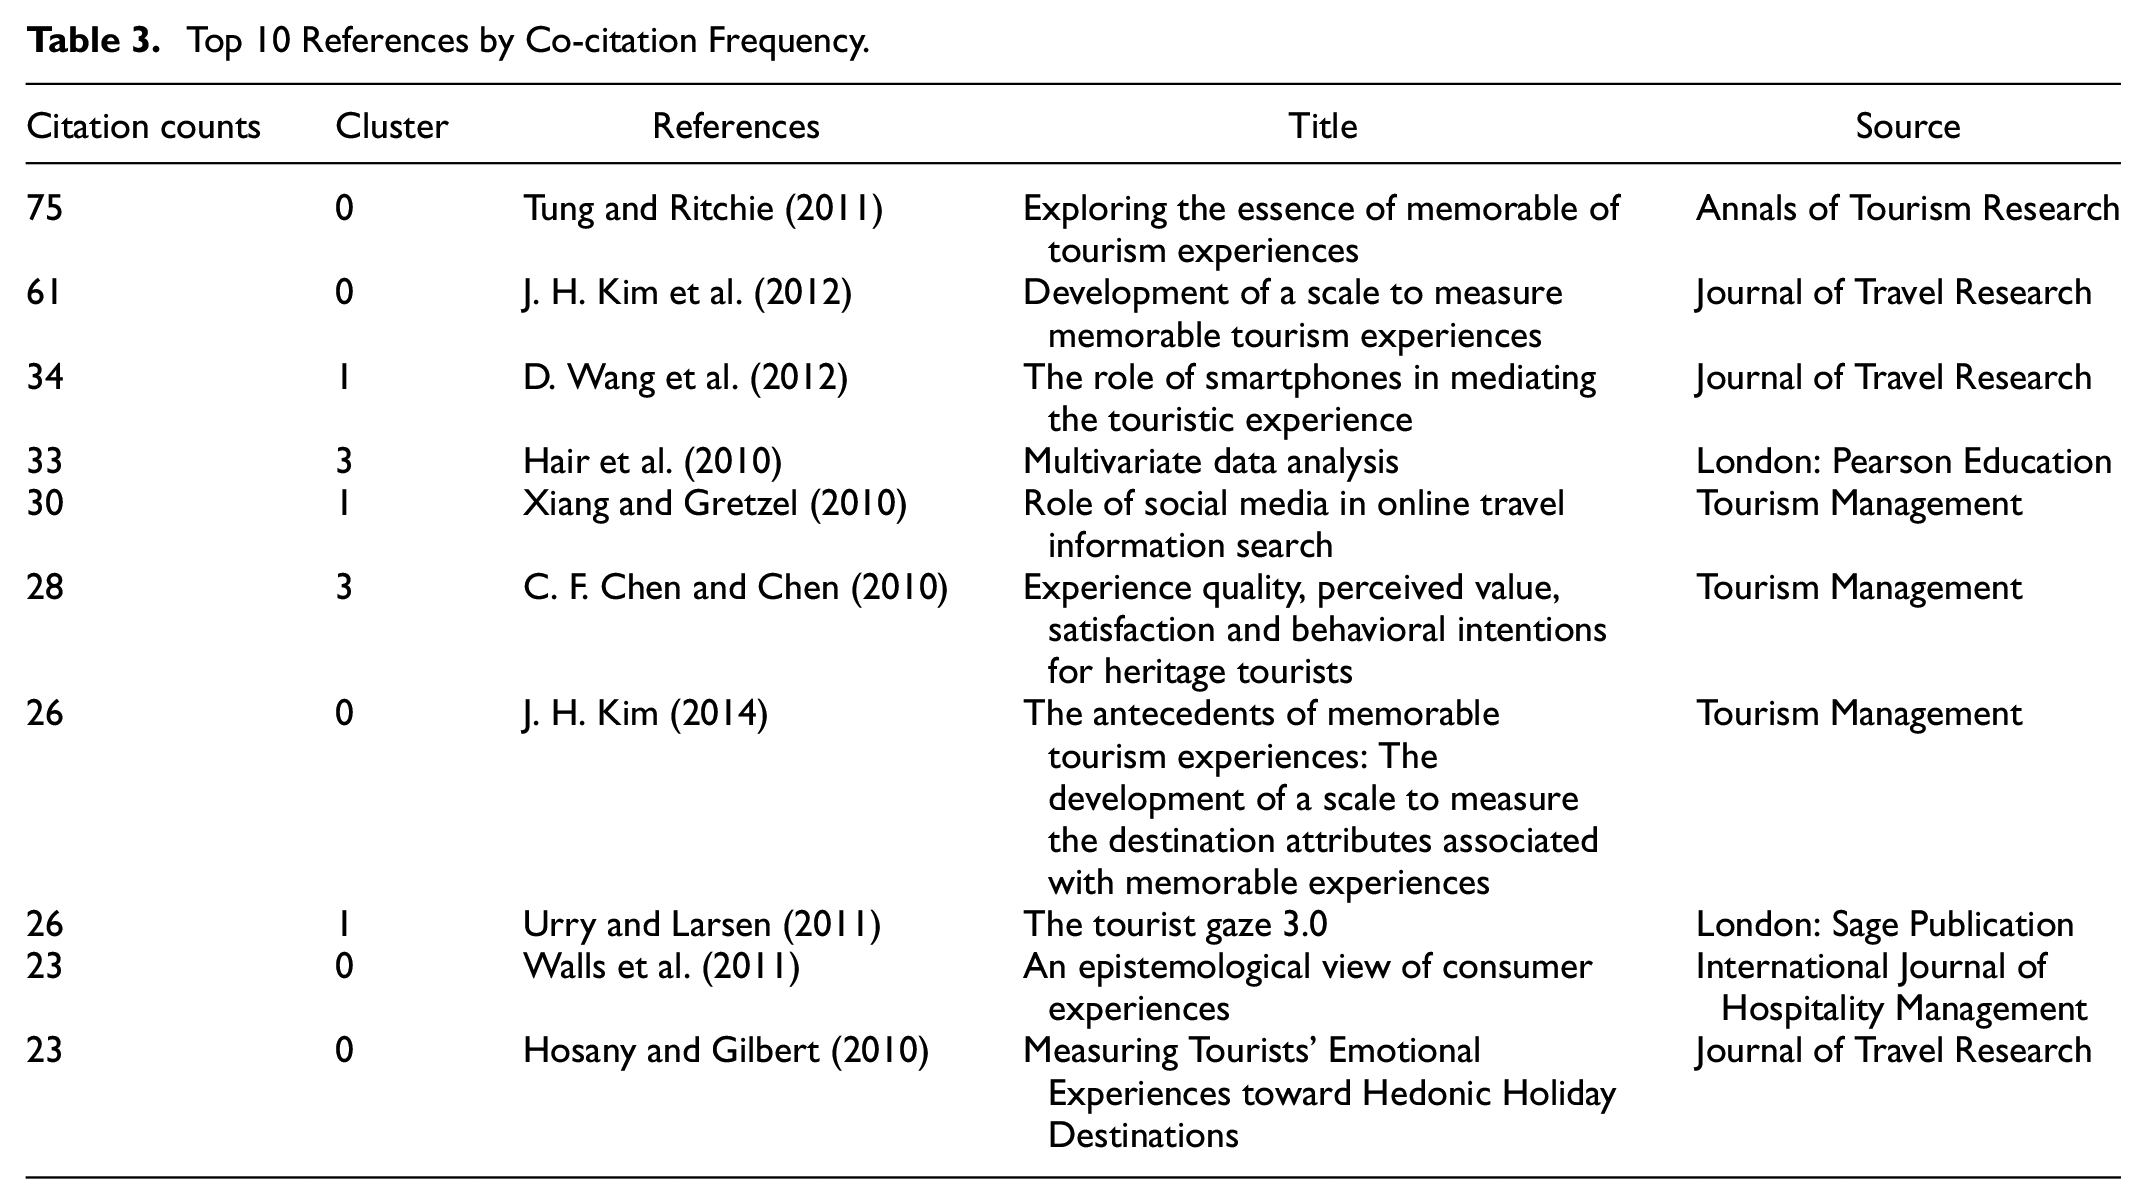
However, the most cited articles usually mean their ground-breaking contributions (C. Chen et al., 2012). Therefore, to identify the most cited literature and understand the classify of tourist experience knowledge clusters, we performed a visual network analysis on the reference co-citation by using CiteSpace (Figure 2). Generally speaking, based on the modularity Q values ranging from 0 to 1, the closer relationships within clusters as modularity Q values close 1. Of course, the modularity Q values are reasonable between 0.4 and 0.8. The silhouette values represent the average contour value of the clusters, which gives an overview of the relative quality of the clusters and the configuration of the data. The values of silhouette should be between -1-1, and the closer you get to value 1, the better the consistency. In Figure 2, this includes 565 references cites and 1,507 co-citation links. The larger the circles on the graph, the higher the frequency of citations. The color of this circle represents the corresponding citation time. Among them, the transition from green to yellow denotes a shift in citation time from far to near. The cluster ranked first was auto-ethnographic study (#0) with 61 member references. The cluster #0 silhouette value was 0.746, showing the cited literature is highly relevant. The most-cited article was Tung and Ritchie (2011) paper entitled “Exploring the essence of memorable tourism,” published in Annals of Tourism Research with 75 citations. This article points out the concept of tourism experience has become a hot topic in current tourism research, using in-depth interviews method and from a psychological perspective, revealing four key dimensions of the memorable tourism experiences (MTEs): affect, expectations, consequentiality and recollection. The second most-cited article was J. H. Kim et al. (2012) paper entitled “Development of a Scale to Measure Memorable Tourism Experiences,” which was published in Journal of Travel Research with 61 citations. This article developed a reliable measurement scale to recognize the influence factor on memorable tourism experiences. J. H. Kim (2014) continued to research the scale to measure the destination attributes associated with MTEs. These articles adopt auto-ethnographic research methods to acquire first-hand information and explore future trends and lay the foundation for further academic research in the tourist experience field.

A network map of reference co-citation from 2007 to 2019.
The second largest cluster (#1) contains 55 member references, the silhouette value was 0.746 and the mean cite year was 2012. The most-cited article was D. Wang et al. (2012) paper entitled “The Role of Smartphones in Mediating the Touristic Experience,” published in the Journal of Travel Research with 34 citations. The article found that analysis smartphones have significantly influenced touristic experiences. Xiang and Gretzel (2010) articles also from #1, and research confirms social media on the online tourism domain has grown gradually. The third largest cluster (#2) contains 46 member references, the silhouette value was 0.973, showing high consistency among cited literature. In addition, the other clusters with more specific details were present on Table 2.
Ranking of the 10 Clusters.

Table 3 lists the top 10 references based on co-citation frequency, and 10 references with co-citation frequencies of over 23. As observed, these references are only from cluster #0, #1, and #3, revealing the importance of three clusters in the tourist experience field.
Top 10 References by Co-citation Frequency.
Country (Region) Collaboration Network
In terms of the network of countries (regions) cooperation, there are 42 countries (regions) and 119 collaboration lines constituted between 2007 and 2019. As Figure 3 and Table 4 show, the USA ranks first with 246 published articles by institutions, followed by China (175), Australia (130) and England (100). In Figure 3, larger circles indicate that a country or region has more publications on tourist experience research. The color of this circle indicates the corresponding country or region publication time. Among them, the purple circles represent the key cooperation, with a high degree of centrality. As a developing country, China has ranked second, which made a very positive contribution to tourist experience research and also indicated we should encourage other developing countries to participate in this research and strengthen exchanges and cooperation with each country. Meanwhile, Australia in the Asia-Pacific region ranked third. The remarkable change also confirmed previous researchers’ findings on the importance of the Asia-Pacific region growing. The Asia-Pacific region mainly includes Australia, Malaysia, New Zealand, Japan, China and other Asian countries, they have contributed 14.8% (2002–2006) tourism publications in 11 leading hospitality and tourism journals (Severt et al., 2009). The United Nations World Tourism Organization [UNWTO], 2010) indicated a stable political environment and sustained economic growth accelerated tourism and hospitality industry development in the Asia-Pacific region. This followed assistance in the growth of tourism and hospitality research (Tang & Law, 2006). In general, the number of publications depends on the number of resources available, such as research funds, research institutions and research scholars.

A network map of countries (regions) from 2007 to 2019.
Top 10 Countries (Regions) by Frequency and Centrality.

Centrality is an indicator to measure the importance of nodes in a network, which is used to determine the significance of literature. Usually, it is marked with purple circles, as shown in Figure 3. The thicker the circle, the higher the centrality. The key research centrality value is equal to or greater than 0.1. See Table 4 regarding the centrality ranking, the top three regions were Australia (0.39), USA (0.23) and England (0.21), and the centrality began in 2009, 2008, 2008, respectively, showing the three regions play a crucial role in tourist experience research because the centrality of the node is proportional to the node impact. Whereas, Taiwan (China) ranked third in terms of publication counts, no centrality is observed (0.00). On the contrary, despite only publishing 33 articles, the Netherlands has a high centrality of 0.16. Therefore, we can draw the conclusion that there may be discord in terms of ranking to research output and centrality value. Moreover, on the basis of the Figure 3 lines show that the top 10 countries have close academic networks in general from 2007 to 2019. For example, Australia had extensive cooperation with other countries, such as the USA, China, South Korea and Canada. While Chinese researchers had relatively less cooperation with Spain and Italy from European countries. In a word, we should constantly increase globalization cooperation to expand the academic networks in the tourist experience research field.
Institution Collaboration Network
From 2007 to 2019, 138 nodes and 75 lines were presented by the network map of institutions in Figure 4. As shown, the larger the circle, the more institutions publication, and the color indicates the corresponding publication time of institutions. As we have observed, according to the relatively independent nodes, the loose structure and fewer close relationships can be inferred the intensity of cooperation is weak inter-institutions in tourist experience field. That is to say, the institutional network of strong-strong cooperation has not yet formed. Table 5 shows the number of publications in the top 10 institutions. Among them, the institution with the most published papers was the Hong Kong Polytechnic University (47) from China, followed by the Griffith University (19) from Australia and Purdue University (17) from the USA, which is consistent distribution of the top three countries in Table 4. However, we found more universities with great scholars not shown up in this study, such as the University of London, University of California System and State University System of Florida, etc. mainly because the WOS core database included research is relatively small, much research was published in journals of other databases and was not collected in this study.
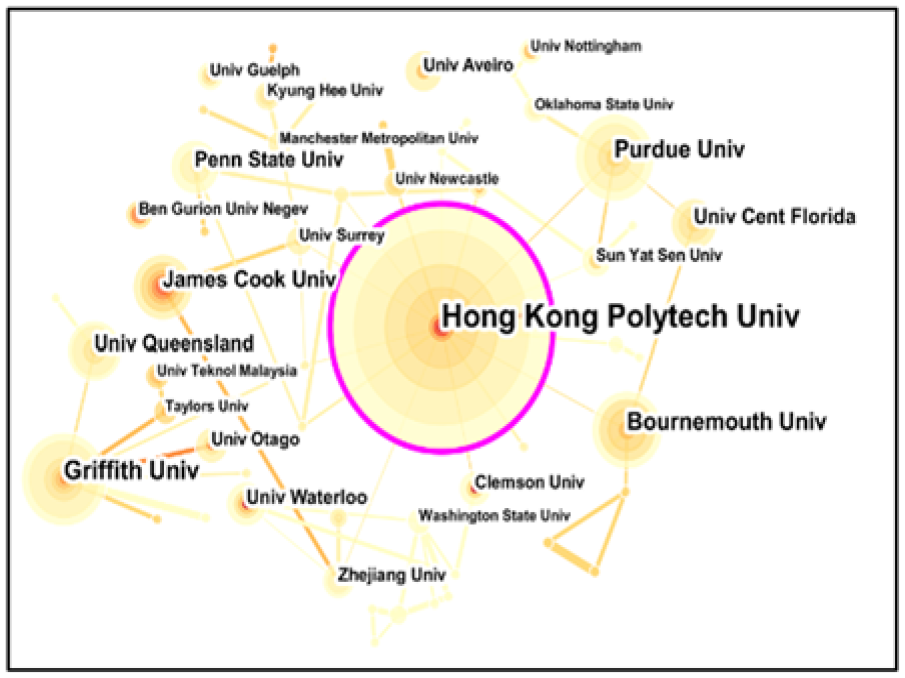
A network map of institutions from 2007 to 2019.
Top 10 Institutions by Frequency.

In terms of the largest contributors, Table 5 presents Australia ranked top in tourist experience research with three institutions, including Griffith University, James Cook University and University of Queensland, ranking second, fifth, sixth, respectively. Moreover, Hong Kong Polytech University and University of Waterloo established a cooperative relationship in 2009, while other institutions partnerships started after 2012 and mainly around 2016.
Author Collaboration Network
In terms of co-authors, we generated a network map between 2007 and 2019 on the tourist experience field (Figure 5). As shown, smaller circles indicate that author’s lower publication and the circle color represents the corresponding time of the author’s publication. The result shows that Kirillova Ksenia is most frequently contributing from Hong Kong Polytech University published eight articles, followed by Tung Vincent Wing Sun from Hong Kong Polytech University (7) and Lehto XiWnran from Purdue University(6). As you can see from Figure 5, the large nodes with high-yield publications published. Instead, the smaller the nodes, the fewer the number of publications. And the loose network structure indicates less collaboration between authors. In general, the enhancement of authors’ cooperation will contribute to the development of the discipline. Moreover, there are some omissions by the authors as these setting words searched for information incomprehensive. For instance, Prof. D. Buhalis uses “tourism experiences” in study while we do not use it to consult literature. Therefore, the results have certain limitations. In further research, we ought to broaden the words searched to make the research more understanding.

A network map of authors from 2007 to 2019.
Table 6 contained the top 10 authors based on frequency. It is clear that Kirillova Ksenia, Tung Vincent Wing Sun, Suntikul Wantanee and Law Rob (ranking 1, 2, 4, 9, respectively) are all from Hong Kong Polytech University. Obviously, we can draw the conclusion that scholars from Hong Kong Polytech University make enormous contributions in the tourist experience research field. In addition, most scholars’ partnerships developed around 2015.
Top 10 Authors by Frequency.

Journal Co-citation Network
In relation to the journal co-citation analysis, Figure 6 shows that 283 publications with 848 links depict the journal co-citation network. Generally, the larger the dimension of the node or circle, the more journals are cited, so they are proportional to each other. The color of the node is based on the cluster to which the item belongs, it represents the corresponding citation time. The line between two nodes indicates the correlation of the journal’s co-cited links, and the colors of the lines represent the time of first co-citation . Based upon the analysis, the co-citation frequency of Tourism Management is most prominent with 725, followed by Annals of Tourism Research (716) and Journal of Travel Research (434).

A network map of journal co-citation from 2007 to 2019.
In terms of centrality, table 7 shows the top three journals were Annals of Tourism Research (0.08), Journal of consumer research (0.07) and Journal of business research (0.06), showing the three publications make an important contribution to tourist experience research. The average 5-year impact factor for the Journal of Marketing, Tourism Management and Journal of Travel Research, reflecting most of the increase in co-citation came from journals with higher impact factors. Moreover, the top 10 cited journals are solely focused on tourism research field except for the Journal of Consumer Research, Journal of Marketing Research, Journal of Business Research and Journal of Marketing. This finding suggests that broadening the room for the development of tourist experience also strengthens the integration of subject knowledge. And it also means we could construct many studies on theories and knowledge of hospitality and tourism under the Economics and Management discipline.
Top 10 Cited Journals by Co-citation Frequency.

Research Hotspots and Trends of Tourism Experience
To provide insights for these analyzes, explanation and predictive development in tourist experience field, we will use keywords as node type construct a time zone view of keywords (Figure 7). As shown, the triangle represents the frequency of occurrence of keywords. The larger the triangle, the higher the frequency of keywords, and its color represents the corresponding occurrence time. The lines between the triangles represent the links between keywords. For example, if two keywords appear in an article at the same time, there is a link between them. As observed, the current main academic research topics include tourist experience, satisfaction, model, behavior, destination image, authenticity, attitude, consumption, and perceived value.

A time zone view of keywords.
Regarding the bursting of keywords citation, which is an indicator of implying the most active area of research (C. M. Chen, 2014). As shown in Figure 8, each blue bar shows the time variation range of keywords, each red bar represents the year the keyword exploded, and the strength of burst represents the variation degree of keyword frequency in a specific time period (Liao et al., 2018). For instance, the keyword leisure was a hotspot topic on tourist experience research from 2009 to 2012, where the value of burst strength value is 3.9104.Leisure gradually became less popular after 2012. In Figure 8, we can find that researchers focused on considering visitors’ behave or to impact on the quality of experience (Noy, 2004; Trauer & Ryan, 2005) and achieving the feeling of authenticity in tourist experience (Buchmann et al., 2010), etc. In terms of keywords centrality, authenticity, leisure, experience, travel experience, motivation and quality have high centrality, more details were present in Table 8. According to Figures 7 and 8, and Table 8, the research hotspots over time may be divided roughly into three aspects:
Tourism and tourist experience. Sensation seeking (SS) is a personality trait and associated with tourist behavior, and personality traits may influence travel styles and destination choices (Lepp & Gibson, 2008). Subsequently, Agapito et al. (2013) pointed to the sensory dimension of tourist experiences that was regarded as an important topic. de Suntikul and Jachna (2016) considered the emotions are varied forms on tourists’ travel experience. Kerr et al. (2020) found dark tourism reminds adults of recalling past tragic fights, faults and follies. Lindberg and Jensen (2020) explored the adventure regime of tourism experiences. In addition, some researchers explore the environmentally responsible behavior of tourists engaged in ecotourism experience based on perceived value, satisfaction and activity involvement (Chiu et al., 2014). Therefore, tourist experience research focuses more on tourists’ behavior direction.
Consumption and tourist experience. The current tourism product concentration on service-dominated needs to be expanded to accommodate physical environment and local cultural tourism (Suntikul & Jachna, 2016). The tourist experience of a place made popular by fiction, it also needs to incorporate cultural, media, literary studies and visitors (Ryan et al., 2008).The memorable local food experience has a significant influence on tourist willingness to recommend (Adongo et al., 2015; Chang et al., 2021). Moreover, with the rapid development of information technology, smart systems have permeated travel and life (Vila et al., 2020). As shown in Figure 8, the keywords mobile technology indicate a demand for tourist experience smart systems. In addition, applying these technologies can enhance travel satisfaction (Ghaderi et al., 2019; Huang et al., 2017). Obviously, hotspot topic consumption is related to the tourist experience market.
Management and tourist experience. In Figure 8, we can find geographical keyword China appearing, reflecting that tourism destination is vital in tourist experience research. From 1955 to 2011, tourism destination research included destination image, tourist experience and stakeholder involvement, structural equation modeling, and customer relationship management (C. H. Wang & Chen, 2014). The tourism destinations are complex systems, in order to enhance authentic tourism experience, suggesting the management of network, personal relationships, trust and reciprocity (Egbert et al., 2017). Therefore, tourism management involves many aspects. We should actively strengthen different disciplines exchanges and improve the effectiveness of tourism management through interdisciplinary research.

Top 18 keywords with the strongest citation bursts.
Top 20 Keywords by Frequency and Centrality.

Conclusions
Although tourist experience studies have become more comprehensive and vital, there are still empty spaces where no scholars apply Scientometric analysis in tourist experience fields. In this literature review, we depicted tourist experience visual network map from 2007 to 2019 by CiteSpace to acquire the overall development characteristics, research hotspots and trends. Thus, this review contributes academic researchers and management practitioners to quickly understand the field of tourist experience what is happening and what is coming. There are, of course, plenty of useful results. The hospitality leisure sport tourism, management and environment are mainly disciplines for researching tourist experience literature and theory, so the literature presented is more inclined to interdisciplinary research. The auto-ethnographic study and social networking site and reminiscence bump are top clusters with most co-citation references is Tung and Ritchie (2011).
In terms of the network of countries, institutions, authors and journal cooperation. First, the major contributions in tourist experience research are from the USA, China, Australia and England, in which the remarkable change also confirmed previous researchers’ findings on the importance of the Asia-Pacific region growing. A stable political environment and sustained economic growth accelerated tourism and hospitality industry development in the Asia-Pacific region (UNWTO, 2010). Then, the most productive institutions are Hong Kong Polytech University, Griffith University, Purdue University and Bournemouth University. Kirillova Ksenia, Tung Vincent Wing Sun, Lehto Xinran and Suntikul Wantanee play an important role in cooperative networks. However, there is a certain gap between the research results of our teams and the reality. This may be due to incomplete data collection or limited search word standards that led to some institutions or great scholars’ being absent from this study. Finally, articles mostly from Tourism Management, Annals of Tourism Research and Journal of Travel Research being often referred to as top travel journals, also included other fields with high impact factor is Journal of consumer research and Journal of Marketing. This indicated broadens the room for the development of tourist experience.
Furthermore, the research hotspots, the current main academic research topics include tourist experience, impact, behavior, destination image, authenticity, memory, food, smartphone and quality of life, and three research steams are divided roughly over time, including tourism and tourist experience, consumption and tourist experience, and management and tourist experience. The trends of tourist experience have switched from conceptual and impact factor research, to assessing the challenges of tourist experience research, and the ultimate realization of the feeling of authenticity in tourist experience.
This study ultimate goal is to construct the knowledge of discipline development and identify the existence of relationships based on visual network maps in the tourist experience field from 2007 to 2019. However, to broaden the breadth and depth of research, further research could be undertaken in the following aspects: (1) add more databases (e.g., Scopus or Google scholar) and analyze the comparison among Google Scholar, Scopus and WOS core database. We obtained data merely from the WOS core database, which is not full-scale. WOS mainly collects primarily journal articles, excluding books published by scholars, and thus, the data collected is not completely representative (C. Chen, 2017); (2) expand the word searches for information and time scope, and the article types. We should collect word information from as many directions (e.g., academic journals and consultant experts) and time periods as possible, and focus on reviews and other related works published; (3) different knowledge domains can be combined with scientometric analysis to provide more comprehensive visualized knowledge maps. For example, Ucinet as network analysis integration software, could be used to analyze the cluster, centrality and distribution degree among networks. (4) adopt scientometric analysis tools such as CiteSpace to apply to more areas of tourism research. In all, there remains sufficient space for enlargement of tourist experience research, and scholars are needed to actively consider these issues in future research.
Footnotes
Declaration of Conflicting Interests
The author(s) declared no potential conflicts of interest with respect to the research, authorship, and/or publication of this article.
Funding
The author(s) received no financial support for the research, authorship, and/or publication of this article.