
Abstract
Infectious diseases are common challenges faced by people around the world, which jeopardize public health, as well as human well-being in various aspects of social and economic development. Although much progress has been made in spatial epidemiology, there is still very little scientific understanding of knowledge domain mapping with scientometric analysis. Based on a total of 4,552 literature records collected from the Web of Science Core Collection™, quantitative changes, research frontiers, research hotspots, and collaboration networks were analyzed by CiteSpace. The results show that both total publications and sum of times cited per year exhibit a rapid development trend in recent decades. The USA, England, and France are highly active in the field. The network of documents co-citation analysis is validated with almost same importance of documents, and primary research frontiers are landscape genetics, modeling and spatial analysis, and tropical diseases. The clustering of the keywords co-occurrence analysis network is heterogeneous and highly reliable, and research hotspots are related to phoma stem canker, vector preference, and aerosol chemical component. Scholars in the field of spatial epidemiology are closely connected, and they have been in a stable cooperative network, as well as institutions. Overall, scientometric analysis based on CiteSpace provides a sound tool to better understand the frontiers, hotspots, and emerging trends in the research domain of spatial epidemiology.
Introduction
Infectious diseases are a common challenge facing populations around the world under globalization background. With the development of economic globalization, the flow of people and goods has accelerated, and infectious diseases are increasingly globalized. Some infectious diseases can rapidly diffuse into other regions or countries in a short period of time, and thus evolve into global public health events. Infectious diseases threaten human health, as well as various forms of social and economic well-being (Bergquist & Manda, 2019; Bloom & Cadarette, 2019). According to World Health Statistics 2019, the diseases including HIV, TB, malaria, hepatitis, and neglected tropical diseases (NTDs) accounted for an estimated 4.3 million deaths in 2016, of which HIV and TB are the primary causes of high mortality resulting from infectious diseases worldwide (Hayman & Baker, 2019). Their emergence is believed to be determined mainly by socio-economic, environmental, and ecological factors (Jones et al., 2008). Therefore, ending the epidemics of these diseases has been set as one of the target of the SDGs.
Spatial epidemiology refers to the use of geographical information system and geospatial analysis techniques to describe and analyze the geographic distribution characteristics and development patterns in disease risk, public health and epidemic events (Elliott & Wartenberg, 2004; Ostfeld et al., 2005). Since the 1800s, geographic analysis has been used to characterize the transmission and possible causes of infectious disease epidemics (Elliott & Wartenberg, 2004). Many areas of spatial epidemiology, such as epidemic mapping (Paireau et al., 2018; Wesolowski et al., 2018), risk assessment related to point or line sources (McGill et al., 2019; Mercer et al., 2017; Solano-Villarreal et al., 2019), geographical correlation studies (Wang, Yin et al., 2019), and cluster detection and disease clustering (Al-Ahmadi et al., 2019; Melo et al., 2020), have made progress. In fact, a novel geographical agent-based simulation model was created to investigate the transmission of COVID-19 (Alvarez Castro & Ford, 2021).
Some studies have evaluated the advancement in the research field by reviewing the associated literature on spatial epidemiology. The latest advances in methods for investigating local spatial variations in diseases were examined. Understanding the intricate links between environment and health required advancements in exposure modeling and mapping, better study designs, and new technologies of surveillance of huge health databases (Elliott & Wartenberg, 2004). Because the effects of landscape structure on epidemiological processes were frequently overlooked, it was thought that a real integration of landscape ecology and epidemiology would be beneficial (Ostfeld et al., 2005). Complex transmission pathways were incorporated to epidemiological analysis and novel insights were offered for understanding disease spread across the landscape (Numminen & Laine, 2020). Developing geospatial analysis tools improved exposure assessment by enabling the depiction of uncertainty and allowing for more relevant inferences to be drawn from data (Beale et al., 2008). Geographical approaches were widely utilized in epidemiology, including geocoding, distance computations, spatial clustering, spatial interpolation, and spatial regression (Auchincloss et al., 2012; Kirby et al., 2017). In further, considering spatially distributed factors, spatial epidemiology of networked metapopulation provided a useful modeling framework for examining the dynamics mediated by emergent disease transmission (Wang & Li, 2014). With the increasing popularity of these researches, spatial measuring errors have been discovered to be a widespread threat to the validity of spatial epidemiology studies, and the different process that cause these errors should be exposed (Zhang et al., 2016). Several spatial decision support systems have been created in the last 10 years to help with data collecting, data analysis, and decision-making, but standardization for system functions and system development, as well as flexible interfaces, have yet to be addressed. Furthermore, real-time distributions of the causative agents and their vectors can be updated rapidly by linking remotely-sensed environmental records with terrestrial-monitored data (Bergquist & Manda, 2019). Remote-sensing and host telemetry data were used to examine spatial and temporal trends in anthrax mortalities in a plains zebra population (Huang et al., 2021).
While some research has been carried out on spatial epidemiology, there has been a shortage of scientometric analysis in this subject and mapping knowledge domains in terms of co-citation analysis, co-occurrence analysis, and collaboration network. Therefore, the primary aim of this study was to investigate the important changes along with the research frontiers and research hotspots of spatial epidemiology. The specific issues addressed in this paper were to: (1) understand the quantitative changes in total publications and times cites on spatial epidemiology, as well as distribution in country, institution, research area, and journal; (2) identify the clusters of network in the documents co-citation analysis, and detect the burst of citation; (3) investigate emerging topics of spatial epidemiology and clusters of network with keywords co-occurrence analysis; (4) explore collaboration network of author and institution based on documents related to spatial epidemiology.
Materials and Methods
Data Collection and Preprocessing
The literature records related to spatial epidemiology were collected from the Web of Science Core Collection™ including SCI-EXPANDED on July 30, 2020. A search strategy was constructed using the topics including “spatial” and “epidemiology.” We refined the literature records through a two steps process. In step one, 90 records were excluded by setting the document type as article, review, and proceedings paper. As a result, 4,570 records were obtained and saved to plain text as the original data to be processed in CiteSpace. In step two, duplicate records were removed with the function of Duplicates Removal in CiteSpace. In the end, a total of 4,552 literature records were included and used for scientometric analysis in CiteSpace.
CiteSpace Overview and Main Functions
Scientometrics is an applied discipline that uses quantitative methods and data and information visualization to explore the process and inherent laws of scientific development together with the development trends of the research topic (Li & Chen, 2017). CiteSpace is a free Java program for visualizing and evaluating emerging trends and transitory patterns in scientific literature, which based on scientometrics and data and information visualization (Chen, 2004). It is developed as a computational tool for visualization of progressive research domain, namely mapping knowledge domains. The main focus of this tool is to find key points in the evolution of a research topic or a field, particularly academic turning points and critical points (Chen, 2006). CiteSpace initially concentrated on literature co-citation analysis, together with mining the knowledge clustering and distribution in citation space. With the continuous update of CiteSpace, it not only provides the mining of citation space, but also does the co-occurrence analysis function among other knowledge units.
CiteSpace has a number of features, for identifying rapidly growing research areas, discovering citation hotspots in published papers, converting a network into clusters, and tagging clusters with phrases from cited articles automatically that help with network and historical patterns analysis and interpretation (Zhang & Li, 2018). CiteSpace facilitates structural and temporal analysis of diverse networks from published papers, including document co-citation networks, collaboration networks, and keyword co-occurrence networks.
In the various maps generated using CiteSpace, the size of the nodes in the author collaboration networks represents the number of papers published by the author, institution or country, and the connections between nodes reflect the strength of the collaboration relationship (Guo et al., 2020). The size of the nodes in the network map of co-citation analysis corresponds to the times of citations. The co-citation of document reflects the number of citations to a single document. The co-citation network of authors represents the frequency of the authors’ publications have been cited. The node size in the co-citation network of journal reflects the frequency of articles in a journal has been cited, and the links between them reflects the strength of the co-citation. For scientific collaboration network, a paper was symbolized as a node and the size of the node can be displayed according to the cited times, while the links between the nodes reflects the collaboration strength.
Results and Discussion
General Characteristics of the Publications on Spatial Epidemiology
Changes in total publications by year and sum of times cited by year on spatial epidemiology were compared with plotting a line chart (Figure 1). The graph shows that there has been a gradual rise in the quantity of both total publications and times cited since 1989. The first article on spatial epidemiology was published in the journal Parasitology in 1989. Less than 20 articles were published each year from 1989 to 1993. Sum of times cited by year also increased slowly during this period. Since 1994, the number of articles published each year showed a slow growth trend and raised from 21 in 1994 to 103 in 2005, with an average annual growth rate of 49.27%. Similar growth trend was found for the total citation times by year from 1994 to 2005, with an average annual growth rate of 93.61%. After 2005, both the number of articles and sum of times cited by year began to grow rapidly, indicating that researches on spatial epidemiology have gradually become a research hotspot for scholars. This can be attributed to the promotion of research in this area by the SARS outbreak in 2003. In particular, the total number of articles in the past 5 years accounted for 42.55% of the total publications in all years. For the number of times cited, this ratio is 52.69%.

Total publications and sum of times cited by year on spatial epidemiology from 1989 to 2019.
A total of 158 countries around the world have published articles on spatial epidemiology. Apart from China, few countries with a large amount of literature are from Asia. The United States, England, and France were the top countries with the largest number of total publications. These countries have published 1270, 707, and 435 articles respectively. There are 249 institutions published more than 10 articles on spatial epidemiology, which shows that this field has attracted the attention of scholars in most regions of the world. The University of Oxford, the University of California, Davis, and the London School of Hygiene & Tropical Medicine placed first three positions in terms of total publications.
From the perspective of subject classification, the publications on spatial epidemiology mainly involve research areas such as public, environmental, and occupational health, infectious diseases, and environmental sciences ecology, accounting for 21.16%, 16.35%, and 15.54% of the total publications respectively. The PLOS ONE journal published 176 articles related to spatial epidemiology, ranking first among all journals, followed by PLOS Neglected Tropical Diseases (131), Preventive Veterinary Medicine (113), and Geospatial Health (92).
Research Frontiers of Spatial Epidemiology with Co-citation Analysis
Documents co-citation analysis (DCA) refers to the frequency with which two articles are cited jointly in the reference lists of the cited documents (Small, 1973). Then, a co-citation relationship is formed. DCA is considered as a process to mine for the relationship from the citation space. It can be performed on documents, authors, or journals. Figure 2 shows a merged network of DCA on spatial epidemiology, which was pruned with pathfinder in CiteSpace. The network consists of 1,480 nodes of documents cited and 2,826 co-citation links for the period of 1989 to 2019.

A visual network and clustering of documents co-citation analysis on spatial epidemiology.
Clustering function provided by CiteSpace was used to identify clusters more precisely in the DCA network. As an evaluation index of network modularity, the Modularity Q value of the DCA network is 0.914, indicating a good clustering obtained by the network. The network was reasonably divided into dispersedly coupled clusters. The silhouette value is a parameter proposed by Rousseeuw (1987) to evaluate the relative quality of the clusters. Specifically, clustering is evaluated by assessing the network homogeneity. A high silhouette value indicates a network with higher homogeneity. The average silhouette value is 0.751 in this study, which implies that the clustering of the DCA network is homogeneous and highly reliable. The silhouette values for the largest 22 clusters of DCA on spatial epidemiology are above 0.9 that further confirms the validity of clustering (Table 1).
Summary of the Document Co-citation Clusters on Spatial Epidemiology.

To identify the distinctive feature of an cluster, noun phrases were extracted by a log-likelihood ratio (LLR) algorithm from the keywords lists in the documents that cited the particular cluster in this study. Specifically, the LLR is calculated by comparing the likelihood of determining a keyword in one cluster with the likelihood of determining exactly the same keyword in another cluster (Zhao et al., 2020). The reason for choosing LLR algorithm is that it is useful for determining the uniqueness and coverage of a term to the cluster (Chen et al., 2010). Figure 2 obviously shows that #0 landscape genetics is the biggest cluster, with the greatest quantity of member references. The potential use of landscape genetics in the study of infectious diseases has become a rapidly developing scope of landscape genetics (Kozakiewicz et al., 2018). Modeling and spatial analysis of infectious diseases epidemics are also important research areas of spatial epidemiology, such as #1 modeling disease spread, #4 spatial analysis, and #9 spatial pattern analysis. Other relatively large clusters are mainly for the study of given infectious diseases, for example #2 tropical diseases, #3 malaria epidemiology, #6 sudden oak death, and so on. The mean year of publication for each cluster in Table 1 indicates that it is formed by generally old documents.
The most cited articles are probably considered as landmarks in the field of spatial epidemiology owing to their original contributions (Chen et al., 2012). Table 2 exhibits bibliographic information for the top 10 highly co-cited documents related to spatial epidemiology. Frequency is the number of times a document is cited. #0 cluster has four documents in the first 10 highly co-cited documents. Each of the remaining clusters has only one document. The article published by Ostfeld et al. (2005) entitled “Spatial epidemiology: an emerging (or re-emerging) discipline” belongs to the #5 cluster and has been cited the most in total, reaching 60 times. The review briefly describes approaches to spatial epidemiology and suggests that a real combination of landscape ecology and epidemiology would be effective (Ostfeld et al., 2005). The second-ranked document which published by Bousema et al. (2012) entitled “Hitting Hotspots: Spatial Targeting of Malaria for Control and Elimination” belongs to the #3 cluster has also been 50 times cited. The study claimed that targeting malaria “hotspots” is a very effective method to minimize malaria spread at all levels of diffusion intensity (Bousema et al., 2012).
Top 10 Highly Co-cited Documents in Spatial Epidemiology.

The betweenness centrality for a node in the network is a useful indicator that reflects the importance of the node’s position in the network, and is used to find and assess document importance (Chen et al., 2012). In CiteSpace, betweenness centrality scores are normalized to the unit interval of [0, 1]. As shown in Table 2, the centrality of top 10 highly co-cited documents are less than 0.04, implying that the significance of these documents is not significantly different.
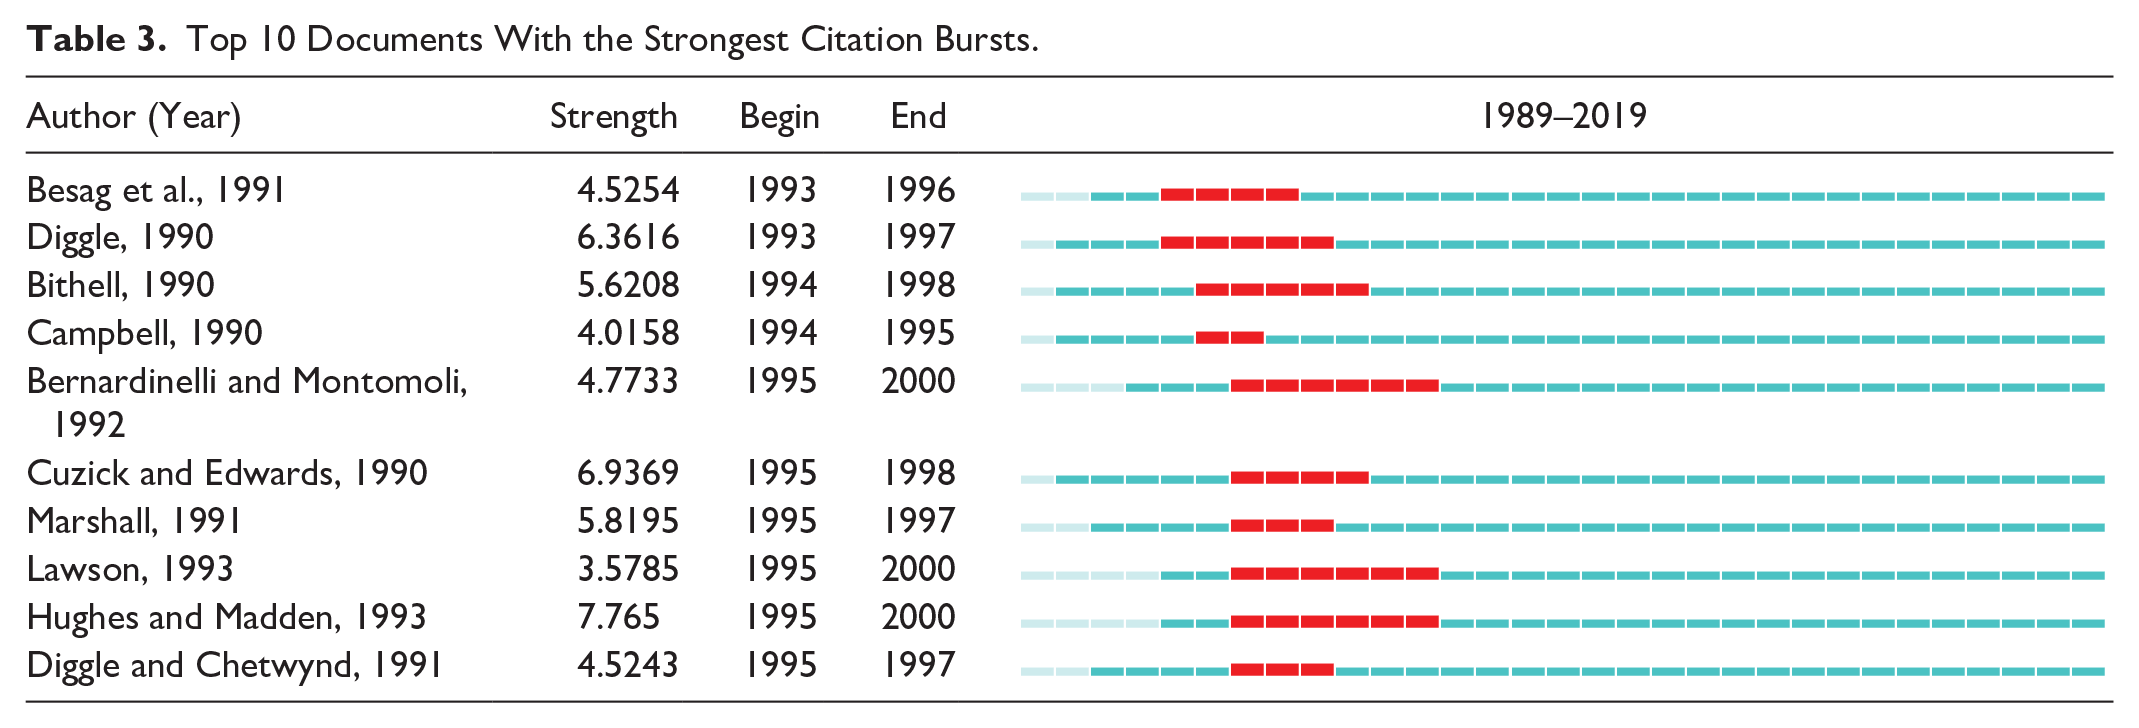
In CiteSpace, a weighted automaton model proposed by Kleinberg was used to detect a burst of the node in the network (Kleinberg, 2003). Burst of citation is an indicator to identify current topics and a most active area of research on spatial epidemiology. Specifically, if lots of nodes in a cluster have strong bursts of citation, so this cluster generally represents the emerging trends of the research field. Table 3 lists the first 10 documents with the greatest bursts of citations. In the last column of the table, the red bars indicate that the strongest citation bursts occurred during this period, and the blue bars represent the period that covers burst detection. The article published by Hughes and Madden (1993) entitled “Using the beta-binomial distribution to describe aggregated patterns of disease incidence” had a maximum citation burst strength for 5 years. The document with the second strongest bursts of citation was published by Cuzick and Edwards (1990) entitled “Spatial clustering for inhomogeneous populations,” which appeared from 1995 to 1998. In this article, a new method for recognizing spatial clustering of occurrences in populations with inhomogeneous density has been proposed. The document with the third-ranked citation burst strength was published by Diggle (1990) entitled “A point process modelling approach to raised incidence of a rare phenomenon in the vicinity of a prespecified point,” which lasted 4 years from 1993 to 1997. A methodology for fitting a class of non-uniform Poisson point process models to data comprising of the locations of all events of some phenomena of interest within a defined flat region was proposed in this report (Diggle, 1990).
Top 10 Documents With the Strongest Citation Bursts.
Research Hotspots of Spatial Epidemiology With Keywords Co-occurrence Analysis
Analysis of word frequency is to extract the high and low frequency distribution of keywords in large numbers of documents that can express the core content for certain knowledge domain, so as to highlight new research trends and hotspots related to spatial epidemiology. The basic principle of keywords co-occurrence analysis (KCA) is to count the times that a group of keywords appear in the same set of documents, and measure the relationship between them using this amount of co-occurrences (Shi & Yin, 2021). Using CiteSpace, a visual network map and clusters of keyword co-occurrence analysis on spatial epidemiology was generated and a total of 20 clusters were obtained in Figure 3. Nodes represent keywords, and the size of nodes implies the co-occurrence frequency of keywords. The width of the connection line between nodes represents the strength of co-occurrence between keywords. The network of KCA consisted of 1,036 nodes of keywords and 1,697 co-occurrence connections for the period of 1989 to 2019.

A visual network and clustering of keyword co-occurrence analysis on spatial epidemiology.
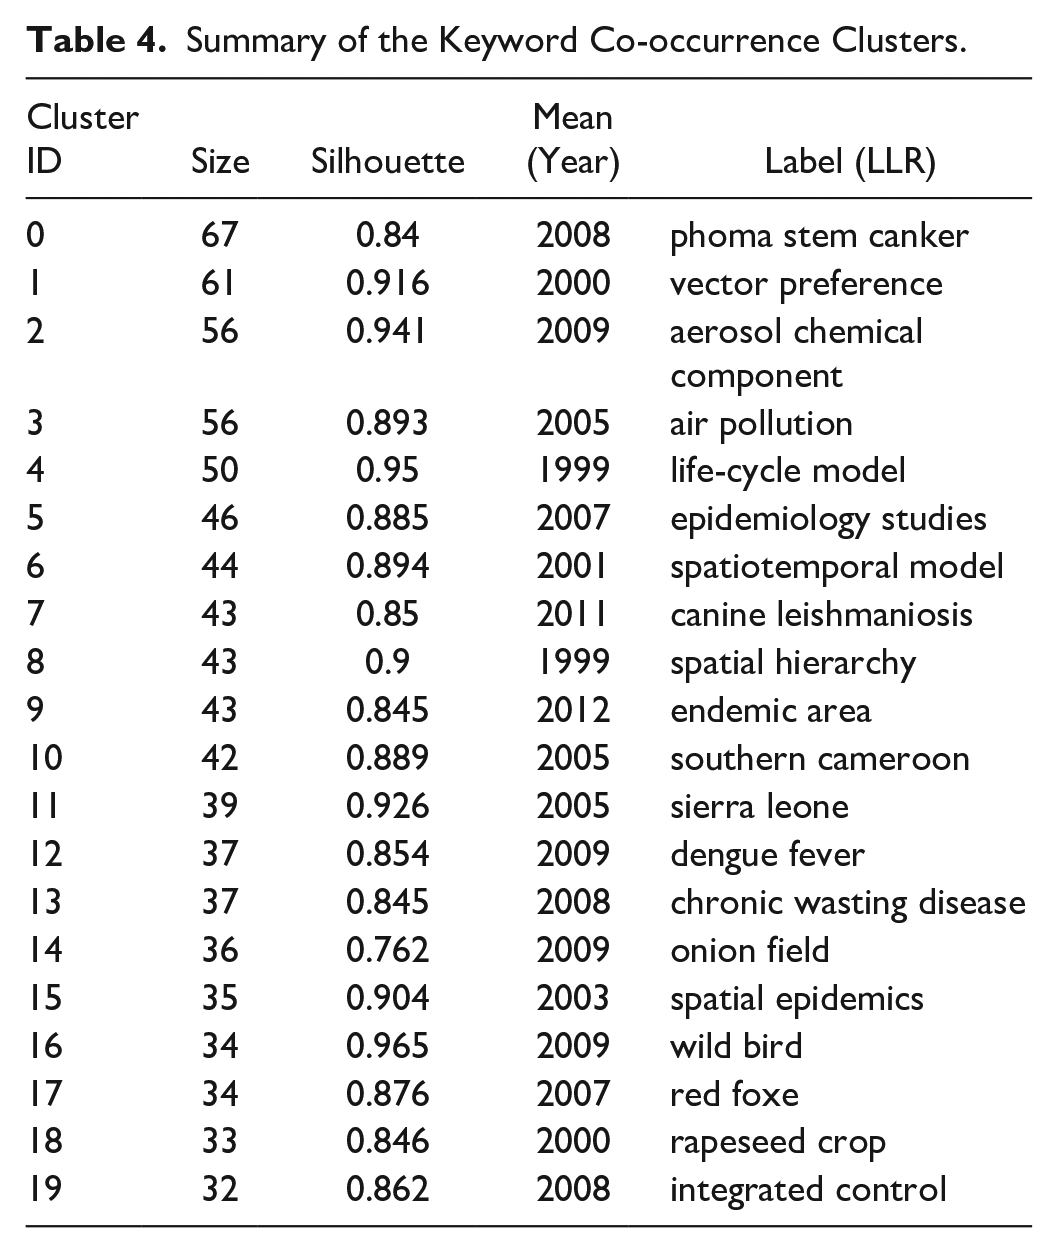
Clustering was also conducted in CiteSpace and the LLR method was used to extract cluster labels from the document keywords. The Modularity Q value of the KCA network is 0.778, showing that the network can result in a good clustering. The average silhouette value is 0.545 in this study, which shows that the clustering of the DCA network has heterogeneity and highly reliability. As shown in Table 4, most of the silhouette values of the largest 20 clusters of KCA on spatial epidemiology are above 0.8 and the validity of clustering was confirmed again. #0 cluster is related to phoma stem canker, which focuses on the spatial pattern of the disease and modeling the spatial spread of the disease. #1 vector preference mainly involves the effect of vector preference for diseased hosts on the spread of a plant (McElhany et al., 1995). #2 aerosol chemical component reveals that epidemiologic research has pay more attention on the respiratory outcomes in relation to aerosol chemical component (Sioutas et al., 2005).
Summary of the Keyword Co-occurrence Clusters.
The top 10 keywords in spatial epidemiology are further listed in order according to the co-occurrence frequency in Table 5. Except for the high centrality of keyword “population,” the centrality of other keywords ranges from 0.01 to 0.06. From the frequency of keywords co-occurrence, the frequency of “epidemiology” is the largest, up to 2399. After “epidemiology,” there are three keywords with a co-occurrence frequency greater than 500, namely transmission, disease, and infection. High co-occurrence frequency of these four keywords suggest that the research focuses of epidemiology in relation to the factors that determine the presence, infection, transmission, and absence of diseases are still the basis of spatial epidemiology research. The co-occurrence frequency of other keywords such as “risk,” “prevalence,” “risk factor,” “model,” “population,” and “spatial analysis” is between 289 and 407. Several studies have conducted to estimate infection risks for neglected tropical diseases (Clark et al., 2020), identify the environmental niche of visceral leishmaniasis (Ding et al., 2019), and predict risk of poliovirus circulation with different spatial model (Mercer et al., 2017).
Top 10 Highly Co-occurred Keywords in Spatial Epidemiology.

Collaboration Networks of Researches on Spatial Epidemiology
In the early 1960s, Price, known as the father of scientometrics, began to conduct quantitative research on scientific research cooperation (Li & Chen, 2017). The well-known square root law was proposed by Price, which asserts that the square root of the total number of authors publishing in a field contributed half of the literature on that subject (Nicholls, 1988). The term “research collaboration” refers to researchers working together for achieving a common objective of creating novel scientific knowledge (Katz & Martin, 1997). In the collaboration network obtained by CiteSpace, the size of node corresponds to the quantity of documents published by the authors or institutions.
The author collaboration network on spatial epidemiology research consisted of 860 nodes of authors and 1,471 collaboration links from 1989 to 2019 (Figure 4). The network shows that a large number of scholars have carried out research in the field of spatial epidemiology and maintained a close collaboration. Obviously, in terms of spatial epidemiology, Clements is the author with the most articles (Table 6), and he is mainly devoted to the application of geographical information systems to support surveillance and resource mobilization decisions (Hamm et al., 2015; Owada et al., 2019; Suwannatrai et al., 2019). Both Vounatsou and Utzinger are from the Swiss Tropical and Public Health Institute, which pursue research in statistical modeling of space-time data arising in the areas of epidemiology and integrated control of neglected tropical diseases (Giardina et al., 2014). These two authors jointly published 20 articles on spatial epidemiology, with a total of 846 times cited, mainly related to infection risk, spatial mapping, and geospatial modeling (Chammartin et al., 2013; Houngbedji et al., 2016; Lai et al., 2019). In case of the affiliation, most of the authors in the top 10 total publications work for department or school related to the epidemiology, public health, geography, and environment.
Top 10 Authors Based on Total Publications Related to Spatial Epidemiology.


Author collaboration network based on publications related to spatial epidemiology.
The institution collaboration network on spatial epidemiology research consisted of 372 nodes of institutions and 464 collaboration connections for the period of 1989 to 2019 (Figure 5). The node “Harvard University” in the network has the largest centrality value at 0.39, which indicates that Harvard University occupies an important position in the network and has research partnerships with many other institutions. As shown in Table 7, the University of Oxford ranked first with 118 documents related to spatial epidemiology, together with a high centrality value of 0.19, which has carried out many research in Parasitology (Kraemer et al., 2019), tropical medicine (Pullan et al., 2011), infectious diseases (Forna et al., 2020), and public environmental occupational health (Lambin et al., 2010). It can be found that the USA is the primary contributor to spatial epidemiology research, because in addition to the Harvard University, there are four other institutions in the top 10 total publications.
Top 10 Institutions Based on Total Publications Related to Spatial Epidemiology.


Institution collaboration network based on publications related to spatial epidemiology.
Conclusions
In this study, a scientometric analysis was performed on spatial epidemiology literature from the Web of Science Core Collection™. Research frontiers and hotspots with emerging trends were identified based on the documents co-citation analysis, keywords co-occurrence analysis, and collaboration networks with CiteSpace.
Spatial epidemiology research generally shows a rapid development trend in recent decades. The growth trend of the total publications by year is largely consistent with that of total times cited by year on spatial epidemiology. The process has three distinct stages, namely the initial stage from 1989 to 1993, the slow growth stage from 1994 to 2005, and the rapid growth stage after 2005. The USA, England, and France, together with the institutions from these countries, are highly active in the field of spatial epidemiology. The subject classification of publications reveals that spatial epidemiology is a frontier multidisciplinary subject, which mainly involves epidemiology, statistics, demography, geography, and public health. Large numbers of publications on spatial epidemiology are sourced from the journals including the PLOS ONE, PLOS Neglected Tropical Diseases, and Preventive Veterinary Medicine.
The high silhouette values confirm the validity of the DCA network, while the low centrality values exhibit almost same importance of documents with regard to spatial epidemiology. Landscape genetics, modeling, and spatial analysis of infectious diseases epidemics, and tropical diseases were found to be the primary research frontiers with the DCA in knowledge domain map of spatial epidemiology. Despite of the relatively large cluster of tropical diseases, documents related to malaria epidemiology can be also found to be cited largely.
The clustering of the KCA network is heterogeneous and highly reliable because of high Modularity Q value and silhouette values. The largest three clusters of KCA on spatial epidemiology are related to phoma stem canker, vector preference, and aerosol chemical component. Although epidemiology has always been a research hotspot, great progress has also been made in related researches on transmission, disease, and infection.
Scholars in the field of spatial epidemiology are closely connected, and they have been in a stable cooperative network, as well as institutions. The USA plays an important role in the research on spatial epidemiology. Both the Harvard University and the University of Oxford occupy a key position in this research field, especially in Parasitology, tropical medicine, infectious diseases, and public environmental occupational health.
In conclusion, this study provided a perspective to the emerging trends of spatial epidemiology. To a certain extent, CiteSpace was just a software tool to visualize and analyze network so as to explore the research frontiers and research hotspots. Deeper and more rigorous researches are needed in the future. Further study will be conducted by improving the search strategy and expanding the scope of the database.
Footnotes
Declaration of Conflicting Interests
The author(s) declared no potential conflicts of interest with respect to the research, authorship, and/or publication of this article.
Funding
The author(s) disclosed receipt of the following financial support for the research, authorship, and/or publication of this article: This research was funded by the Chongqing Municipal Natural Science Foundation (No. cstc2018jcyjAX0497), the Humanities and Social Sciences Research Project of Chongqing Municipal Education Commission (No. 16SKGH096), and the National Natural Science Foundation of China (No. 41301351).