
Abstract
This paper aims to design a novel AFCM-SMOTENC-APRIORI model to mine the default feature attributes of small enterprises. It can overcome the problem that the data characteristics of “small defaulting small enterprises and large non-defaulting small enterprises” make it difficult to mine the defaulting feature attributes of existing small enterprises. We used 1,231 small enterprise credit data from a city commercial bank in China to make an empirical analysis. We found that 23 feature attributes are strongly associated with default and 87% of the association rules are the same between the extended data and the original data mining. It shows that the data mining results with SMOTE-NC are highly consistent with the results of the original data mining, and the model is robust and reliable. It can be used as a reference for the credit risk identification of small enterprises in commercial banks.
Keywords
Introduction
Small enterprises are the cornerstone of the global economy and employment. There are many of them, and they provide a large number of jobs (Chai et al., 2019). With the spread of COVID-19 across China, forcing the economic model to shift from a “contact economy” to a “distance economy” poses a great challenge for small enterprises (Belitski et al., 2022). Small enterprises are engaged in labor-intensive and “touch” services. The transformation of the economic model hinders the further development of small enterprises. With their reliance on long-tail customers, small enterprises have always faced the problems of difficult and expensive financing (Nizaeva & Coskun, 2019; Y. Sun et al., 2022). From 2019 to the end of 2021, the inclusive loans provided by Chinese financial institutions to small and micro enterprises increased from 31,973.4 billion yuan to 72,111.8 billion yuan (China Banking and Insurance Regulatory Commission [CBIRC], 2019). With the increase in the number of inclusive loans provided by financial institutions to small and micro enterprises, financial institutions also need to control their default risk and grasp the fundamental reasons for their default. However, due to the unbalanced characteristics of more non-default samples and fewer default samples in the credit evaluation data of small enterprises, it is easy to focus on high-frequency events (non-default rules) and fail to effectively mine important low-frequency events (default rules) in association rule mining (Mahdi et al., 2022). In practice, mining the feature attributes strongly associated with defaulting small enterprises is the key to the identification of credit risk features, that is, the exploration of default rules is more important (Calabrese et al., 2019).
Feature attributes can reflect the characteristics of small enterprises with different loans under the same indicator. For example, the indicator of “Residence status of business owners” in the credit evaluation of small enterprises includes five types: “Self-owned or mortgage,”“Family building,”“Rent,”“Collective dormitory or common housing,”“Other, unknown or missing data.” Each type is a feature attribute of small loan enterprises. It is a finer dimension relative to indicators, which can not only reflect the characteristics of small loan enterprises, but also reveal the fundamental causes of enterprise default. Existing research on credit risk focuses on indicator screening, score solving and credit rating grading (Ashofteh & Bravo, 2021; Shi et al., 2020; Xia et al., 2018; L. Yu et al., 2021). Some scholars have also made a detailed analysis of the indicators, including the comparison of default probability between blacks and whites, and the comparison of default probability between customers with high loan amounts and low loan amounts (Karlan & Zinman, 2010; Pope & Sydnor, 2012). However, few can reveal the relationship between the feature attributes of small enterprises and default status, especially the relationship between different intervals and the default status under quantitative indicators, reflecting the fundamental causes of small enterprises’ default. Inadequate understanding of the default feature attributes and non-default feature attributes of small enterprises can easily lead financial institutions to make incorrect credit decisions, thus triggering small enterprise credit risk and increasing the pressure on financial institutions’ credit risk.
To solve the above problems, this paper designs a novel AFCM-SMOTENC-APRIORI model to mine the default feature attributes of small enterprises. Then, we use the credit data of 1,231 small enterprises from a city commercial bank in China to make an empirical analysis. We found that among the 23 indicators that can significantly identify the default status of small enterprises, there are 23 feature attributes strongly associated with non-default. This means that the default risk of small enterprises with these feature attributes is relatively low, which can be used as a reference for credit granting. At the same time, we also found that among these 23 indicators, there are 23 feature attributes strongly related to default, showing that the default risk of small enterprises with those feature attributes is relatively high. This was especially true when: the return on total assets of a small enterprise is in the range [0.0000, 0.0344); the turnover speed of accounts receivable of a small enterprise is in the range [0.0484, 3.9500); the enterprise has less than five patents in the same industry; the product sales scope of small enterprises is unclear, or it is not in the two ways of domestic sales and export sales; the personal credit card of the legal representative (or the person in charge of the enterprise) of a small enterprise has a default record or missing data; and the legal person has held the position for less than 2 years. The financial information of small enterprises is not perfect, and financial institutions often do not know much about. The feature attributes of large enterprises can’t help financial institutions make credit decisions for small enterprises. The features found in this paper, especially the default features, can help credit decision makers understand small businesses, identify small businesses with high default risk as early as possible, and then make correct credit decisions, thus reducing the risk pressure of financial institutions.
The contribution of this paper includes the development of a new integrative methodology that combines AFCM, SMOTE-NC, and APRIORI. Another contribution is developing insights and relevance of complex relationships between the feature attributes and default status. More broadly, this study provides initial evidence and relationships for generalized defaulting association rules for financial institutions to mine the root cause of small enterprise defaulting. This study also addresses some of the methodology issues facing previous techniques applied to credit evaluation. For example, the proposed methodology addresses the Boolean of quantitative data, the mining of low-frequency rules and the exploration of the complex relationship between feature attributes and credit risk, all of which limit the application power of previous techniques.
Following the Introduction, the article consists of five sections: Literature Review, Research Design, Empirical Analyses, and the Conclusion.
Literature Review
The difficult and expensive financing of small enterprises has been a focus of academic research. For a long time, scholars have believed that small enterprises are affected by credit rationing, and the borrowers of small enterprises are either refused loans or the loan amount is lower than their loan application amount or the loan interest rate is unbearable (Chai et al., 2019; Y. Zhang et al., 2021). This is mainly because financial institutions may face disproportionately high monitoring costs due to the opaque information of small enterprises and the relative scarcity of mortgage assets compared with large enterprises or high achieving enterprises (Rostamkalaei & Freel, 2016). In addition, Freel et al. (2012) found that in addition to the above possible reasons, a reason why the demand for credit of small businesses can’t be met is that small businesses not applying because they may be reluctant to apply due to the prospect of being rejected is almost twice that of being rejected. One of the key measures to solve the credit rationing of small businesses is to identify the credit risk of small businesses, so as to ensure that the probability of default can be accurately estimated (Y. Sun et al., 2022).
As for credit risk identification, the existing literature mainly focuses on credit evaluation indicator screening, credit score solution and credit rating. Those are the ways to predict loan customers’ default status. Indicator screening mainly adopts the filtering method, embedding method and hybrid method to reduce the indicators, and then uses the indicators retained after reduction to predict the default status of customers (Hou et al., 2014; Sefidian & Daneshpour, 2019; J. Sun et al., 2015; L. Yu et al., 2021; C. Zhang & Hu, 2020; Zhou et al., 2021). The credit score is used to represent the level of customer credit risk, and its solution mainly includes measurement and statistics, artificial intelligence and goal optimization (Ashofteh & Bravo, 2021; Luo, 2020; Mancisidor et al., 2020; Xia et al., 2018). The credit rating division consists of four mainstream methods: default probability threshold, credit score range, customer number distribution and default loss rate division (Chai et al., 2019; Krink et al., 2008; Shi et al., 2020). To improve the prediction effect of loan customer default, Bagging, Boosting, SMOTE and other methods that can retain a small number of default sample information have also been widely used (Niu et al., 2020; Shen et al., 2021; J. Sun et al., 2018).
In terms of feature attribute mining, Karlan and Zinman (2010) found that the borrower with a higher loan amount is less likely to default. Pope and Sydnor (2012) found that the default probability of black borrowers was 36% higher than that of white borrowers by using used the Prosper data and Logit regression empirical analysis. Hildebrand et al. (2017) found that the loan projects with group leaders bidding had a higher default probability than those without group leaders bidding by the credit transaction data of the Prosper platform from February 2007 to April 2008. Bai et al. (2019) used the combination of a fuzzy rough set and fuzzy C-means method to build a credit risk evaluation model. Using the loan data of 2,044 farmers, they concluded that the education level and skills of farmers are highly related to their credit quality. The above literature makes a systematic analysis of credit risk, but it has not yet mined the feature attributes strongly associated with credit risk to find out the root cause of credit risk. In particular, when there are few default samples and more non-default samples, it is more difficult to explore the causes of the default. Therefore, this paper designs a combination method to explore the root causes of small business default.
Association rule analysis is the key technology of big data analysis, which can explore the correlation or relevance between different transactions from a large amount of data (Luo, 2020). APRIORI was proposed by Agrawal et al. (1993) to mine association rules. Subsequently, various scholars optimized this method and applied it widely in various fields. Lazcorreta et al. (2008) used this algorithm to analyze the behavior of individual users in a Web information system, and helped users choose the best customized links. Xie et al. (2020) optimized this algorithm to analyze the evolutionary characteristics of regional traffic congestion, laid the foundation for formulating advanced regional traffic control strategies, and helped to alleviate traffic congestion. Based on this algorithm, Luo (2020) dug into the association rules and association degree between poverty indexes and poverty degree, and studied in-depth the causes of poverty among residents. As the purpose of this study is to mine the correlation between each feature attribute of small enterprises and default status, it is consistent with the performance of the APRIORI algorithm in mining the correlation between data items, and the algorithm has an extensive practical basis in various fields. Therefore, this paper adopted this method to analyze the default feature attributes and non-default feature attributes of small enterprises.
Research Design
Interval Division of Quantitative Indicators
In practice, association rules are generally divided into Boolean association rules and quantitative association rules. Boolean association rules deal with qualitative indicators with discrete values (Kabir et al., 2017), and quantitative association rules are used to deal with quantitative indicators with continuous values (Alataş & Akin, 2006). For example, if the association rule antecedent X is “female” and the association rule subsequent Y is “Default,” this rule is a Boolean association rule. If the association rule antecedent X is “industry prosperity index = 102” and the association rule subsequent Y is “non-default,” this rule is a quantitative association rule. The mining of quantitative association rules generally needs to convert quantitative data into Boolean data processing, that is, it is generally processed in an interval way (Alataş & Akin, 2006).
To ensure that the quantitative indicator interval division of small enterprises meets the goal of “the smaller the distance within the class, the greater the distance between classes,” this paper uses Adaptive Fuzzy C-means (AFCM) algorithm to convert the quantitative indicator value into Boolean data. The characteristics of this method are as follows. By solving the adaptive function composed of the distance between classes and the distance within classes of different feature attributes of the same indicator, a small enterprise quantitative indicator interval division model with improved fuzzy C-means is constructed. Following this the cluster number corresponding to the maximum of the adaptive function, that is, the optimal interval number, is obtained. This reflects the interval division idea of “the smaller the distance within the class, the greater the distance between the classes” of different feature attributes of the same indicator, which makes up for the deficiency that the clustering number of the existing fuzzy C-means algorithm needs to be set subjectively. More specifically, the objective function, cluster number and conditions are given by (Y. Sun et al., 2022)

Where


For quantitative indicator X, under the conditions of meeting

Where
We can explain Equation 4 as follows. The smaller the distance from the indicator value
We need to calculate the clustering center vector C and membership matrix U through continuous iteration until the difference between the iteration result of step K + 1 and that of step K is less than the threshold

Furthermore, the constraint conditions to ensure the maximum of Equation 4 are given,

The value L(l−1) of cluster number l−1 is not only greater than the value L(l−2) corresponding to cluster number l−2, but also greater than the value L(l) corresponding to cluster number l, ensuring that L(l−1) is the maximum value; at that point the clustering number l−1 is the optimal clusters of the quantitative indicator interval, and the clustering process ends.
To facilitate intuitive understanding, the implementation flow of the Adaptive Fuzzy C-means algorithm is shown in Figure 1.

Principle of adaptive fuzzy C-means interval division.
Association Rule Mining of Small Enterprise
Default Sample Expansion Based on SMOTE-NC
Due to the unbalanced characteristics of more nondefault samples and fewer default samples in credit evaluation data, it is easy to focus on the non-default high-frequency rules and fail to effectively mine the important low-frequency rules of default in association rule mining (Mahdi et al., 2022). Therefore, before mining association rules, it is necessary to expand the low-frequency default samples according to the unbalanced distribution characteristics of small enterprise data, to make up for the impact of data imbalance on low-frequency event association rules mining. In this paper, a default sample expansion model is constructed by Synthetic Minority Oversampling Technique-Nominal Continuous (SMOTE-NC). For the quantitative indicator
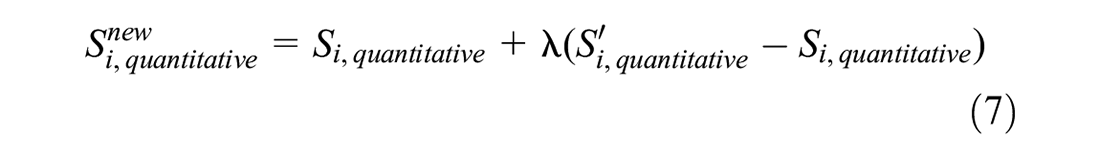
Where

According to the distribution characteristics of unbalanced data of default and non-default of small enterprise data, the small enterprise default sample expansion model of SMOTE-NC is established to expand the samples of low-frequency default small enterprises, so as to balance the default and non-default samples in the data set and avoid the impact of data imbalance on the mining of association rules of low-frequency events. The difference between this method and the classical data expansion method SMOTE is that SMOTE cannot directly expand the data of qualitative indicators. It needs to digitize the qualitative indicators and then expand them according to Equation 8; SMOTE-NC does not need to numerate the qualitative indicator, it only needs to count the frequency of the feature attributes of qualitative indicators. This meets the data requirements of feature attribute mining in this paper, and makes up for the fact that of SMOTE cannot directly expand the qualitative indicators and the expanded qualitative indicator data classification is not clear. For example, if the feature attribute “male” contained in the “gender” indicator is assigned as 1 and “female” is assigned as 0.8, the newly generated sample of SMOTE may be 0.89 through interpolation, so it is difficult to determine which attribute the value of 0.89 should be.
Mining Default Feature Attributes of Small Enterprises Based on APRIORI
In order to mine the default feature attributes of small enterprises, it is necessary to establish association rules between the feature attributes of small enterprises and their corresponding default status. Support and Confidence are two measurement criteria that can accurately describe the correlation between variables (Mahdi et al., 2022). The degree of support f(X→Y) refers to the probability of simultaneous occurrence of the preceding item X (i.e., the feature attribute contained in the evaluation indicator) of the association rule and the subsequent item Y (i.e., default status) of the association rule (Hong et al., 2020),

Where T represents the number of small loan enterprises, count(*) represents the frequency of corresponding events, and count(XY) represents the frequency of simultaneous occurrence of feature attribute X and default status Y. Equation 9 depicts the regular relationship between feature attribute X contained in the small enterprise credit evaluation indicator and default status Y. The greater the support f(X→Y), the stronger the correlation between feature attribute X and default status Y.
Confidence represents the percentage of default status Y of small enterprises with feature attribute X, expressed as a conditional probability (Hong et al., 2020),

The greater the confidence g(X→Y), the greater the probability of default status Y of small enterprises with feature attribute X.
It is necessary to select an appropriate association rule mining algorithm to mine default feature attributes by using support and credibility. Due to its easy understanding, low data requirements and strong interpretability of recognition rules, the APRIORI algorithm is widely used in mining the association rule in the medical field, engineering and other industries (Kavšek & Lavrač, 2006; Tatavarthi & Sambasiva, 2017; H. Yu et al., 2011). The core of APRIORI is to find the frequent itemset I where its support f is not less than the minimum threshold δ in the database through iteration, and then construct the association rule set Z where the confidence g is not lower than the minimum confidence threshold ζ (Mahdi et al., 2022). The implementation process is as follows.
Build a Frequent Itemset I

Where
Build a Strong Association Rule Set Z
On the premise that

Equation 12 indicates that there is a strong correlation between the feature attributes
Determine the Feature Attributes
Most Relevant to the Default Status of Small Enterprises
Suppose the feature attribute

Empirical Analyses
Sample Selection and Data Source
This paper uses 1,231 small business loans from 1994 to 2012 of a city commercial bank in China as an empirical sample. According to the Classification Standard of Small and Medium-sized Enterprises issued by the Ministry of Industry and Information Technology of the People’s Republic of China, the data was collected from 11 industries, such as wholesale, retail, construction, transportation, leasing and business services. At the same time, the data covers nine provincial regions: Beijing, Hebei, Henan, Jiangxi, Liaoning, Shanghai, Sichuan, Tianjin and Chongqing. Among all of the loans, only 35 had defaulted.
Based on the high-frequency credit evaluation indicators of small enterprises of authoritative institutions such as Moody’s, S&P, Fitch, China Construction Bank, combined with the availability of data, this paper has established a small enterprise credit evaluation indicator system composed of 10 standard levels, such as small enterprise solvency, profitability, operation ability, growth ability, external macro conditions, internal non-financial factors and enterprise credit. There are 81 indicators contained in this data such as asset liability ratio, return on total assets and industry prosperity indicator. On this basis, the indicators reflecting information redundancy are eliminated through partial correlation analysis, and the indicators that can significantly distinguish the default status of small enterprises are selected by Probit regression. A small enterprise credit rating indicator system composed of 23 indicators such as “X1 Quick ratio” and “X14 years of employment related industries” was constructed, as shown in Table 1. Descriptive statistics of 23 indicators are shown in Tables 2 and 3 shows the scores of different feature attributes of quantitative indicators. The system includes 13 quantitative indicators and 10 qualitative indicators, and the corresponding AUC is as high as 98.62% (Chai et al., 2019). The feature attributes and corresponding coding of 23 indicators are shown in Table 4.
Original Data of Credit Evaluation Indicators of Small Enterprises.

Descriptive Statistics.

Scoring Results of Qualitative Indicators.

Indicator Feature Attributes and Their Codes.

Analysis of Mining Results of Non-defaulting and Defaulting Feature Attributes of Small Enterprises
Interval Division Results of Quantitative Indicators
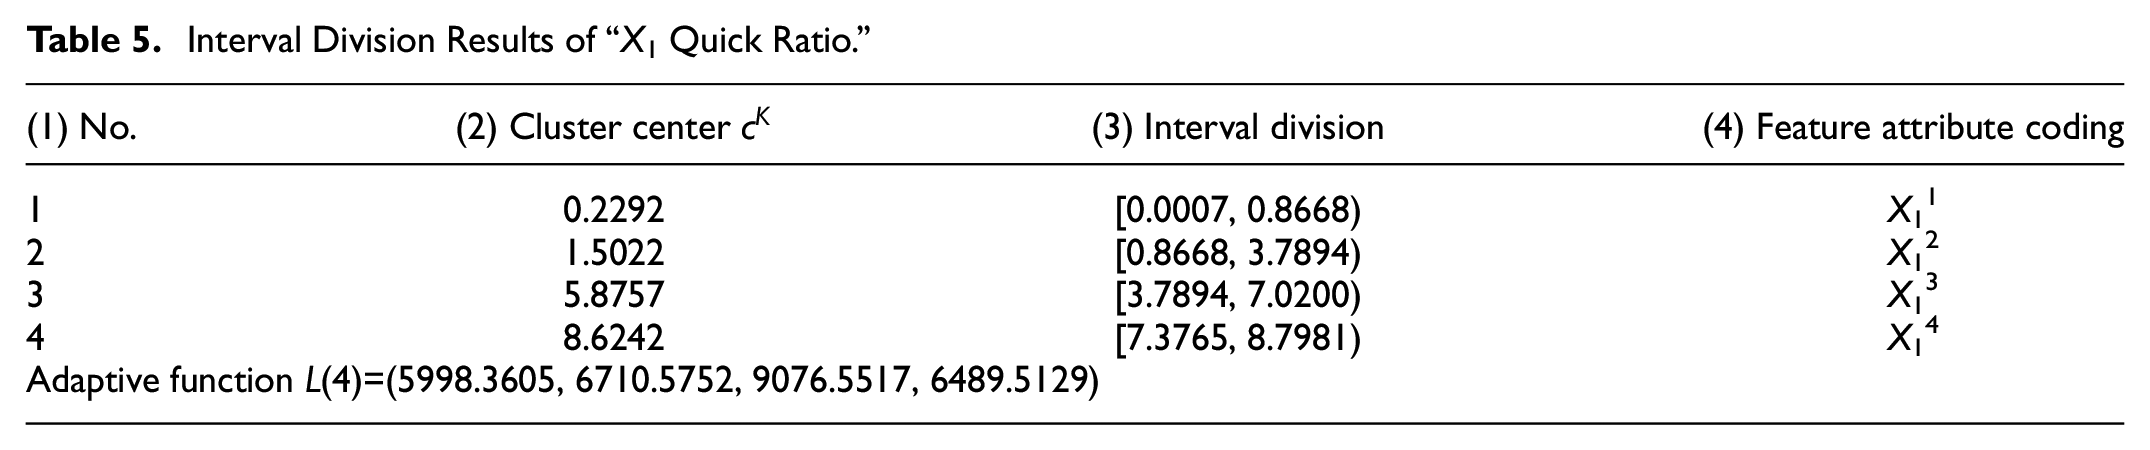
Taking the interval division of the quantitative indicator “X1 Quick ratio” as an example, this paper explains the interval division process of the quantitative indicator. Let the initial cluster number
Interval Division Results of “X1 Quick Ratio.”
Mining Results of Feature Attributes of Small Enterprises Strongly Associated With Non-Default (Yi = 0).

Similarly, according to the above Section 3.1(4) adaptive fuzzy C-means AFCM interval division steps, the interval division of the remaining 12 quantitative indicators in Table 2 can be completed.
Mining Results of Default Feature Attributes
Default Feature Attributes of Small Enterprises Mining Based on SMOTENC-APRIORI
Firstly, according to the SMOTE-NC default sample expansion method (See section 3.2.1), the original data of 1,231 small enterprises (1,196 non-defaulting small enterprises and 35 defaulting small enterprises) are expanded to form 2,392 small enterprise expansion data (1,196 non-defaulting small enterprises and 1,196 defaulting small enterprises). Then, the extended data is used to encode the feature attributes, and the quantitative indicator data is transformed into Boolean data.
Secondly, after continuous iterative attempts, the minimum support threshold is set to δ =0.05 and the minimum confidence threshold is set to ζ =0.50. Using the original data and extended data encoded by feature attributes, combined with Section 3.2.2 above, the feature attributes of small enterprises strongly associated with default (Yi = 1) and non-default (Yi = 0) are mined respectively. The results are shown in Tables 6 and 7.
Mining Results of Feature Attributes of Small Enterprise Strongly Associated With Default (Yi = 1).

Analysis of Feature Attributes of Small Enterprises Strongly Associated With Non-Default (Yi=0)
Using the expanded data of 2,392 small enterprises, one non-defaulting feature is mined for each indicator, as shown in Table 6. Take “X1 quick ratio” as an example: the strong association relation between the feature attribute of “X1 quick ratio” and non-default is X12=[0.8668, 3.7894), indicating that small loan enterprises with “quick ratio” in the range of [0.8668, 3.7894) are less likely to default than other small enterprises. At the same time, the support of the association rule f(X12→Y i = 0)=0.46, indicates that 46% of the 2,392 small enterprises have an “X1 quick ratio” in the range of [0.8668, 3.7894] and there is no default. Further analysis shows the confidence of the association rule g(X12→Y i = 0)=0.5319, indicating that small enterprises with the quick ratio in the range of [0.8668, 3.7894) have a 53.19% probability that they will not default. The specific description of non-defaulting feature attributes of 23 indicators is shown in column 2 of Table 8.
The Description of Non-Defaulting and Defaulting Feature Attributes of Small Enterprises for Extended Data.

To verify the reliability of the feature attribute mining method established in this paper, original data and expanded data are used to find the feature attributes strongly associated with non-default (Yi = 0), as shown in Table 6. By comparing the similarity of association rules between the expanded data and the original data, it is not difficult to find that 20 of the 23 association rules extracted from the extended data mining are the same as the association rules of the original data mining. The feature attributes of the two dataset mining have a coincidence degree of 87% (≈20/23), which shows that the data expanded by SMOTE-NC is highly consistent with the original data mining results. The feature mining model established in this paper can be applied and popularized in credit risk identification.
Analysis of the Feature Attributes of Small Enterprises Strongly Associated With Default (Yi=1)
Using the expanded data of 2,392 small enterprises, one defaulting feature is mined for each indicator, as shown in Table 7. Take “X1 Quick ratio” as an example; the strong association relation between the feature attribute of “X1 Quick ratio” default is X13=[3.7894, 7.3765). Therefore small enterprises with a quick ratio in the range of [3.7894, 7.3765) are more likely to default than other small enterprises. At the same time, the support of the association rule f(V12→Yi = 1)=0.22, indicates that 22% of the 2,392 small enterprises have a “quick ratio” of [3.7894, 7.3765) and defaulted. The confidence of the association rule g(V12→Yi = 1)=0.7452, indicates that when the quick ratio is in the range of [3.7894, 7.3765), small enterprises have a 74.52% probability of default. The specific description of defaulting feature attributes of the 23 indicators is shown in column 3 of Table 8.
The 23 feature attributes strongly associated with default are the attributes that financial institutions should pay attention to when granting credit. In particular, the following five feature attributes deserve more attention. The return on total assets of the enterprise is in the range [0, 0.0344), and the turnover speed of accounts receivable is in the range [0.0484, 3.9500). The enterprise has less than five patents in the same industry, and the product sales scope is unclear or not in two ways (domestic sales and export sales). Legal representative (or person in charge of the enterprise) personal credit card has default record or missing data. And the legal person has held the position for less than 2 years. Their probability of simultaneous occurrence with enterprise default (i.e., support f) exceeds 60%. It shows that small enterprises with these five feature attributes have a great possibility of default.
Conclusion
Given the unbalanced characteristics of “more non-default samples and fewer default samples” in credit evaluation, it is easy to focus on non-default rules in association rule mining and not effectively mine default rules. This paper used SMOTE-NC to generate defaulting small enterprises. It used the APRIORI algorithm to mine small enterprise default feature attributes, and made an empirical analysis with 1,231 small enterprise credit data.
Based on the division of different feature attributes of the same indicator, the model can find out the feature attributes strongly associated with default (Yi = 1) and non-default (Yi = 0). It is suggested that financial institutions should pay attention to the 23 feature attributes strongly associated with default excavated in this paper. Five attributes in particular should be looked at: the return on total assets of small enterprises is in the range [0.0000, 0.0344); the turnover speed of accounts receivable of small enterprises is in the range [0.0484, 3.9500); the enterprise has less than five patents in the same industry; the product sales scope of small enterprises is unclear, or it is not in the two ways of domestic sales and export sales; the personal credit card of the legal representative (or the person in charge of the enterprise) of a small enterprise has a default record or missing data; and the legal person has held the position for less than 2 years. The probability of small enterprises with these five feature attributes and default at the same time is high, that is, the support f exceeds 60%, which shows those small enterprises have a strong default risk. In addition, among the 23 non-defaulting feature attributes of SMOTE-NC extended data mining, 20 feature attributes are the same as 20 of the 23 feature attributes mined from the original data (the coincidence degree is 87%), indicating that the extended data is highly consistent with the original data mining results. The feature mining model established in this paper is accurate and reliable and can be used as a reference for credit risk identification of commercial banks.
The financing of small enterprises has always been a focus of attention for the Chinese government. In 2021, the amount of loans to small enterprises reached 72.11 trillion yuan, an increase of 28.056% compared to 2020 (CBIRC, 2020, 2021). Recently, the People’s Bank of China, China Banking and Insurance Regulatory Commission and other departments issued the Notice on Further Strengthening the Support of Deferred Repayment of Principal and Interest for Small and Micro Enterprises Loans, which indicates that for loans to small and micro enterprises (including individual industrial and commercial households and small and micro enterprise owners’ operating loans) due in the fourth quarter of 2022, the repayment date can be extended to June 30, 2023 at the longest in principle (The Central Peoples Government of the Peoples Republic of China [CPGPRC], 2022). The increase in the loan amount for small enterprises and the extension of the repayment period undoubtedly increase the default risk of small enterprises as explained undertaken by financial institutions. Mining the default feature attributes of small enterprises in this paper can help financial institutions identify default small businesses in advance, and enter loan intervention measures in advance, so as to avoid adverse effects on their sustainable development caused by the increased of credit risk of small enterprises.
This study is based on the expansion data of default samples to mine the default feature attributes and non-defaulting feature attributes of small enterprises, which may increase the calculation cost of the model. We would like to continue to improve the feature attribute mining model. This study uses the data of 1,231 small businesses in a commercial bank in China to analyze their default feature attributes and non-default feature attributes. It is hoped that with the improvement of data collection, further tests can be conducted on the robustness of the design model in this paper. In addition, due to the high degree of correlation between the feature attributes and the default status of small enterprises, we will further explore the design of a credit risk evaluation model for small enterprises based on the feature attributes, in order to overcome the problem of low recognition of default risk of small enterprises caused by the weak correlation between traditional indicators and default status.
Footnotes
Appendix 1. Interval Division Steps of AFCM Algorithm
Appendix 2. A Case of Feature Attribute Mining
For ease of understanding, this paper takes a dataset composed of six non-defaulting and four defaulting enterprises as an example to illustrate the feature attribute mining process, as shown in Appendix table 1. Set that indicator X includes three feature attributes X1, X2, and X3, and the minimum support threshold δ=1/10, minimum confidence threshold ζ=1/5.
Declaration of Conflicting Interests
The author(s) declared no potential conflicts of interest with respect to the research, authorship, and/or publication of this article.
Funding
The author(s) disclosed receipt of the following financial support for the research, authorship, and/or publication of this article: This work was supported in part by the National Natural Science Foundation of China (Nos. 72173096, 71873103, 71503199), the Key Project of National Natural Science Foundation of China (No. 71731003), the Social Science Foundation of Shaanxi Province (No. 2018D51). Shi acknowledges financial support from the Tang Scholar Program of Northwest A&F University. Chai acknowledges financial support from the Graduate Science and Technology Innovation Project of College of Economics & Management, Northwest A&F University (JGKC2021-02).