
Abstract
Several scholars have recently recommended a transition from focusing on Internet access (access divide) and Internet use (use divide) to the tangible outcomes of Internet use (outcome divide). This study evaluates the utility of this perspective in China for investigating digital inequalities across provinces. Despite having the world’s largest ICT market, digital disparities persist at the provincial, city, and county levels. This paper establishes an explanatory conceptual model of the digital divide (DD) at the provincial level and applies mapping through ArcGIS software to investigate spatial agglomeration. Spatial autocorrelation (Moran-i) is used to reveal high significance and multivariate analysis is used to investigate the key correlates. Among the provinces, a significant DD was found, which shows that provinces that are administratively sophisticated (such as Guangdong, Shanghai, Beijing, Jiangsu, Shandon, and Zhejiang) having a high digital development index score (IDI). Concomitantly, poverty-stricken regions and rural areas, mostly in southwest, central, and western China, have low IDI values. The factors found by this study to be most influential for improved ICT usage and outcomes are residential income (urban), e-government, literacy rate (secondary gross enrollment), and the working-age population. This indicates that socio-economic problems should be addressed first instead of institutional and innovational considerations. This study is the first to develop a conceptual model of the third-level digital divide (3-LDD) (ICT outcome) at the provincial level and utilize spatial analysis and mapping to supplement traditional methodologies.
Introduction
Globally, rapid but uneven access to information and communication technologies (ICTs) in the information age and the fourth industrial revolution is due to the digitalization of the economy (ITU, 2019). The outcomes of this transformation improve social and economic well-being by changing consumption patterns and business models (Z. Song & Liu, 2013). Despite the remarkable growth in ICT availability and usage, disparities among nations, provinces, and cities have also been noted (J. B. Pick et al., 2015). The ICT inequalities (access, usage, and utilization) are referred to as the digital divide (DD) (J. B. Pick et al., 2015; Scheerder et al., 2017). The DD concept became popular among researchers in the early 1990s as access to and use of the Internet (Eastin et al., 2015) and has been gaining acceptance ever since.
This paper focuses on China, with approximately 940 million Internet users (the world’s most) and 56.7 million internet hosts (second to the United States). In terms of global Internet users and mobile phone subscriptions, China is among the top two (CNNIC, 2020). Besides being the fastest-growing ICT market, China is best-suited for this research since it connected to the Internet in 1994 (CNNIC, 2010). China is geographically diverse and manifests significant regional differences in ICT access, use, and outcomes at both the provincial and city levels (W. Song, 2008). Mainland China has 31 provinces and 334 prefectural cities (excluding Taiwan, Hong Kong, and Macao). In the national administrative structure, provinces rank above cities and counties.
The goal of this study is to fill in the gaps by means of contributing insights into China’s provincial-level technological disparities by developing a conceptual framework of ICT access, use, and outcomes. Furthermore, to explore correlations of provincial DD with conflicting socio-economic and political factors and recommend policies for provincial governments and businesses. This study addresses some problems that are to be considered to overcome the digital divide in China. Like, the provincial government of China should focus on providing access to ICTs in rural mountainous regions and also try to focus on the educational level (Yu & Zhou, 2016). The DD has been recognized as a complicated, multifaceted issue (Cruz-Jesus et al., 2017). The available literature shows that state-level (J. B. Pick et al., 2015; Scheerder et al., 2017), provincial second level (Xue & Wang, 2011), and prefectural-level studies are available in China, the United States, and Japan (Nishida et al., 2014; Z. Song et al., 2019). However, there are no regular nor properly conducted provincial-level studies that cover all three levels of the DD. Many scholars have suggested that the DD should be tackled holistically by also including a third-level DD (3-LDD) (ICT outcome) that considers variance in the beneficial results of ICT use (i.e., Cruz-Jesus et al., 2017; Dewan & Riggins, 2005). Unfortunately, studies on the 3-LDD concept at the provincial level are not yet seen in the literature and very few at the prefectural level (Z. Song et al., 2020) because most research has considered it at the level of individuals (Helsper & van Deursen, 2017; Scheerder et al., 2017). A noteworthy contribution of this paper is applying the multidimensional conceptual framework at the provincial level that includes all (first, second, and third) levels of the DD. Furthermore, provincial-level data on all three levels from 31 provinces are utilized additionally to other socio-economic, demographic, and institutional factors.
This research has several novel subjective features that contribute insights to the DD literature. To address such gaps following Grubesic and Murray’s (2005) argument is that geographic space is crucial for topics such as telecommunications, virtual space, and the digital divide. Therefore, firstly, this study utilizes spatial analysis and mapping to supplement traditional methodologies and we propose conceptual, empirical, and procedural advances that are relevant to ICT researchers, practitioners, and China’s ICT planners and policymakers. Secondly, this study uses a theoretical model that is not found in the literature for China at the provincial level. We include 14 socio-economic variables influencing eight technology variables ordered by ICT access, use, and outcome. The 14 socio-economic variables were further divided into five groups. Why and how each aspect affects the three different levels of the DD is explained. Thirdly, a noteworthy contribution of this study is that combined with spatial analysis and Moran’sI, regression analysis in China, it seeks and excludes geographically biased regression findings or re-analyzes them using standard mathematical modifications. Such spatial approaches may be useful in many areas of telecommunications and IT research. Finally, the study findings are novel because there are no previous studies of multivariate correlates for all three levels of China’s provincial DD.
Literature
The development of ICT applications is growing exponentially (Cruz-Jesus et al., 2012). These technologies are permanent and affect every aspect of society (World Bank, 2009), including human interactions, business, economic growth, welfare, and even political conduct (Zhao et al., 2007). These new possibilities are shaping new types of communication and interaction between individuals and organizations (Krishnan & Lymm, 2016).
The introduction of ICTs, initiated by the widespread use of personal computers (PCs) and the Internet in the 80s and 90s, gave rise to utopian notions of boundless opportunities, free of problematic sociocultural constraints such as gender, age, race, and geography (Gunkel, 2003). However, access (and later, use) to ICT was soon revealed to be constrained by numerous factors, and that academics and policymakers should not assume that ICT access is universal or imminent. When the term “DD” first originated, it referenced this situation.
A plethora of research has been conducted to identify the types of DD and their determinants (Scheerder et al., 2017). Initially, the DD was considered an uneven distribution of Internet access (Eastin et al., 2015; Scheerder et al., 2017) what is known as the first-level digital divide (1-LDD) (ICT access) (Eastin et al., 2015). Later, digital skills became the focus, including differences in use, and this is termed the second-level digital divide (2-LDD) (ICT use) (Hargittai, 2002; J. A. Van Dijk, 2005). Furthermore, scholars have shown that it must be approached more comprehensively to address access and use of the Internet (Selwyn, 2004; J. A. Van Dijk, 2005) to explain the benefit of ICT use as a 3-LDD (ICT outcome) (Wei & Hindman, 2011). Several studies have explained the 1-and 2-LDDs (Scheerder et al., 2017; see also Hargittai, 2002; J. B. Pick et al., 2015; Z. Song & Liu, 2013; J. A. Van Dijk, 2005).
However, very few studies have been published on the 3-LDD in states and prefectures. The studies on the 3-LDD are mostly framed at the individual level. For example, such studies have addressed consumption, saving, political, and social activities (Selwyn, 2004). Furthermore, the DD is multi-dimensional; for example, digital asymmetries exist in households, organizations, provinces, etc. (Dewan & Riggins, 2005; Z. Song et al., 2019).
Economically and sociologically disadvantaged people, such as those with low incomes or educations, those living in rural areas or ethnic minorities or women and the elderly are more likely to experience digital inequalities, (Azari & Pick, 2005). Venkatesh and Sykes (2013) discovered that social network factors are significant in explaining ICT use and value. In terms of technology adoption, it is generally assumed that larger organizations (with greater resources) are more likely to adopt technological breakthroughs, while other scholars disagree because larger firms are more prone to inertia (Dewan & Riggins, 2005). Moreover, at the nation-state level, disparities in ICT access and use across and within countries, are described as international and domestic DDs. The international DD is frequently explained by economics and education (Cruz-Jesus et al., 2018). Even in countries known for their digital progress, data and empirical evidence suggest that domestic divides exist. Thus, disparities in ICT access may be addressed by governments and organizations subsidizing these technologies, and inequalities in ICT usage patterns may be addressed by educational institutions and individuals.
To gain understanding of how DD should be tackled on a provincial level, this study was intended to integrate a well-established conceptual model in which we try to capture the DD on three different levels. This will clarify the current situation of ICT disparities in each province by applying spatial agglomeration, Moran’s I and cluster analysis. Further, to examine the understudied phenomena we employed as a unique theoretical model of five different aspects through multivariate analysis to capture the impact of each aspect on DD on the provincial level. According to the World Bank (2016), for ICT to benefit everyone, everywhere, the remaining digital gap must be closed, particularly regarding internet access.
Research Questions
What conceptual model should be used to understand the spatial patterns of ICTs?
What are the demographic, educational, economic, innovation, and institutional correlates of ICT factors by provinces?
Is there any spatial autocorrelation in the regression estimates of the DD?
How do the provinces agglomerate based on similarities among the three DD levels?
Theoretical Background
Factors of the DD From ICT Access to Outcomes
The DD is a complex and modern phenomenon in which progress affects different research parameters (J. van Dijk & Hacker, 2003). Many researchers have attempted to measure the inequalities and encapsulate the complexity of the DD by employing composite indices (Cruz-Jesus et al., 2018; Grishchenko, 2020). Classical researchers mainly defined the inequalities regarding ICT tools and internet access (Aydin, 2021). Recently, the inequalities/divide is further explained using the three-level paradigm. Based on the available literature, we identify three different factors of DD which are explained below:
Factors of the 1-L DD (ICT Access)
Inequitable access due to cost and infrastructure is the 1-LDD (Hargittai, 2002) and is typified by Internet use, computer use, broadband use, and cost of Internet and broadband access (J. A. G. M. van Dijk, 2006). These studies mostly present the 1-LDD as the biased allocation of internet access (Blank et al., 2018; Scheerder et al., 2017). For instance, the numbers of mobile phones, computers, Internet users, and Internet service providers are the main variables used to determine ICT access (Dewan & Riggins, 2005; Z. Song et al., 2014).
Factors of the 2-L DD (ICT Use)
In early 2000, the world had moderately high Internet access, which is now being questioned as the primary Internet benefit (Scheerder et al., 2017) because the focus has shifted from digital access to digital skills (Aydin, 2021; Hargittai, 2002). Inequalities due to digital expertise/skills (use) (J. A. G. M. van Dijk, 2006) are now considered a 2-LDD. For instance, internet bandwidth per capita, broadband subscribers per capita, Internet users per capita, and time-on-line are the leading variables for capturing ICT use (Z. Song et al., 2014).
Factors of the 3-L DD (ICT Outcome)
Several researchers contend that the DD should be approached more rigorously and add the consequences of Internet use such as productivity and learning inequality (Fuchs, 2009; J. A. G. M. van Dijk, 2006). These are defined as ICT outcomes or the third-level divide which derives from the 2-LDD, along with other factors (Wei & Hindman, 2011). Compared to the first and second, the 3-LDD has been studied far less (Scheerder et al., 2017). The leading variables used to define the third-level DD are e-commerce outcomes/sales, online shopping benefits, e-shopping transactions, and e-government.
This study considers three levels of the divide: ICT access, ICT use, and ICT outcomes, and considers those variables that have been widely used to define the DD (see Table 1).
Frequently Used Variables to Determine the Digital Divide.

Measurement and Methods
DD Measurement
Herein, the DD is addressed from the instrumental and judgmental perspectives. The instrumental perspective mainly looks at the supply side and considers the 1-, 2-, and 3-LDDs (ITU, 2019; Mansell, 2017) while the judgmental perspective mainly covers the knowledge gap (Scheerder et al., 2017). To cover both perspectives, this study develops a synthetic composite index to measure the DD at a provincial level in China.
Composite indices are widely used in DD analysis and provide a range of indicators with different weights, which ultimately coincide with the final score on country/province/prefectural levels (ITU, 2019). At the provincial level, the DD index to measure the 3-LDD has not yet been properly developed. The most commonly used index in recent literature is the ICT development index (IDI), which was presented in 2009 by the International Telecommunication Union (ITU), and IDI presents a synthesis of the previous two indexes (ITU, 2003).
Methodologically, several steps should be considered to capture the accuracy of results at the provincial level (Bruno et al., 2011). To avoid misinterpretation, careful design and implementation are required (OECD, 2011). Given this, indicators should be examined properly to calculate the index, either by linearly or nonlinearly combining indicators and using a set of weights (ITU, 2009; OECD, 2011). From the literature on different studies, we summarized 11 different indicators (Table 1). To provide a detailed index, the quality of data was examined at provincial level. The main constraint when selecting ICT data in most provinces is poverty, and to avoid misrepresenting data, three indicators were removed from consideration.
To reduce the prominence of overweight factors in the composite index, the interrelationships (correlations) of indicators should determine selection better to indicate their influence (Bruno et al., 2011; OECD, 2011). To capture the correlations among indicators and minimize redundancies, the factor analysis method in SPSS was employed also to demonstrate the appropriateness of the method (see Table 2). After obtaining the correlation matrix, the next step is to test the suitability of the data by using both the Kaisers–Mayer–Olkin (KMO) and Barlette test of sphericity (Cruz-Jesus et al., 2018; Sharma, 1996). The results show that the KMO is 0.749 and the Bartlett test of sphericity is 787 with an associated probability of less than 1%, which indicates the method’s appropriateness.
Correlation Matrix of Eight Utilized Indicators.
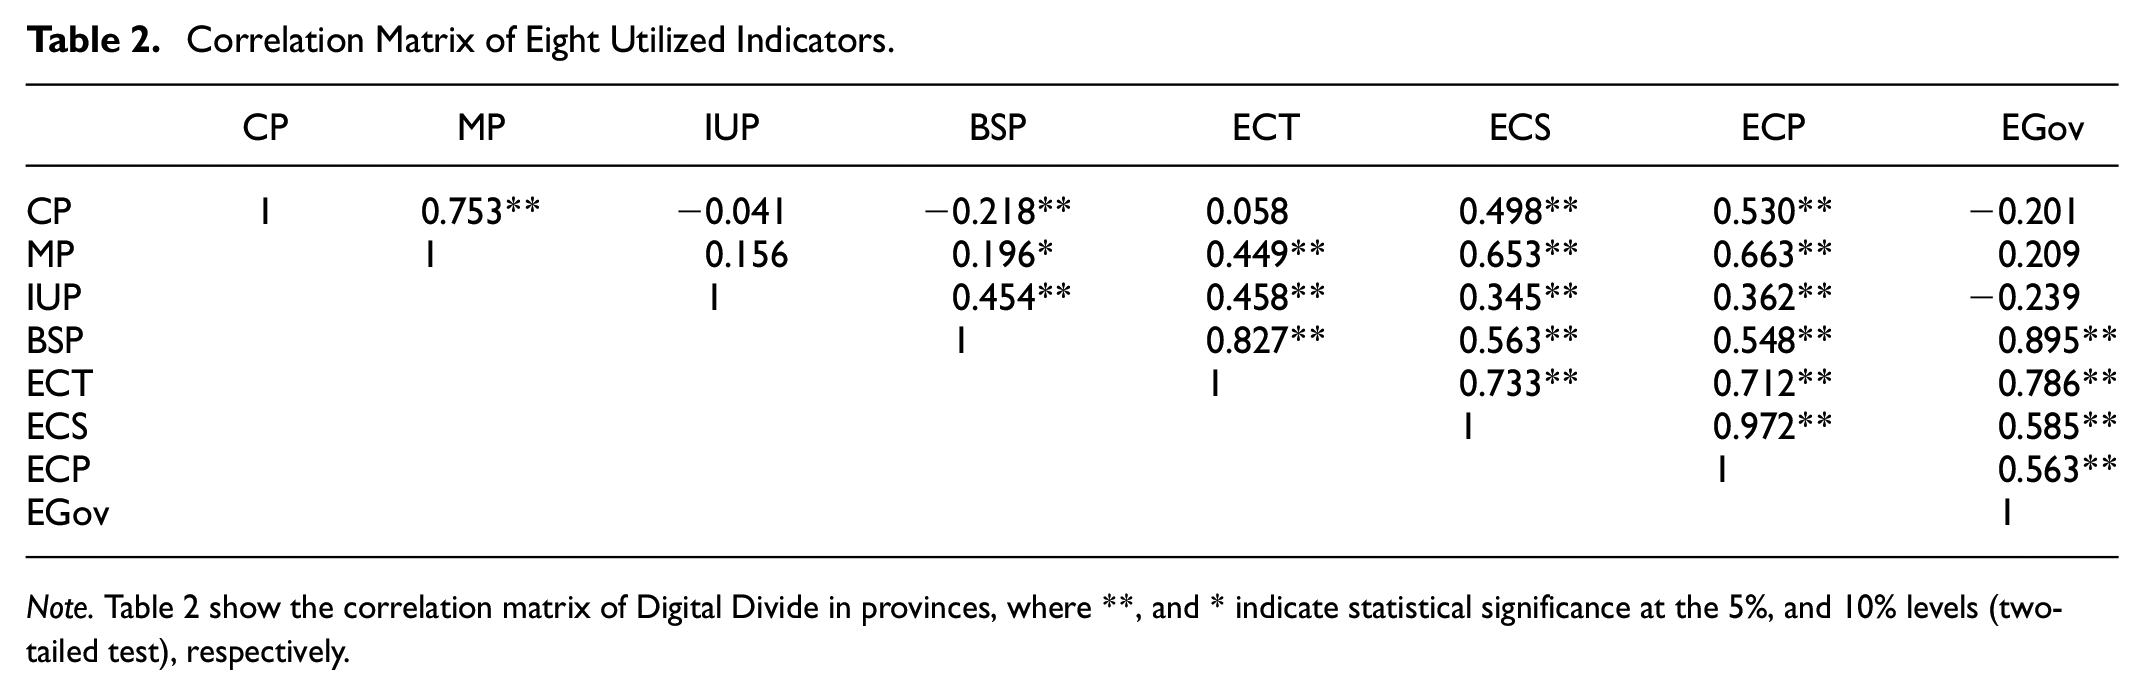
Note. Table 2 show the correlation matrix of Digital Divide in provinces, where **, and * indicate statistical significance at the 5%, and 10% levels (two-tailed test), respectively.
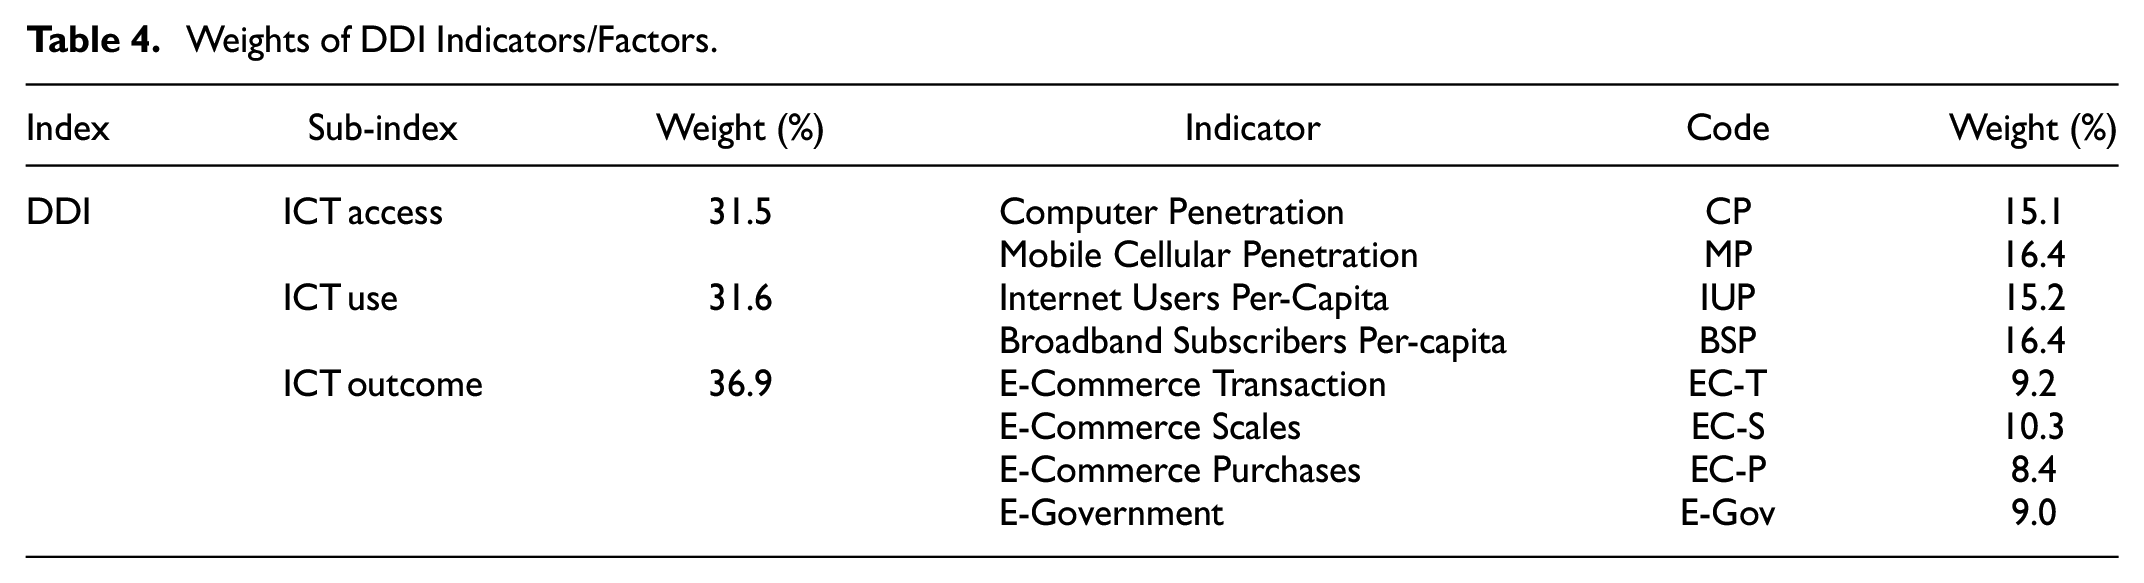
To check the reliability of the analysis and minimize redundancy, principal components were employed to extract the original indicator (Bruno et al., 2011). Table 3 presents the extracted principal component, which explains a significant portion of the variance in the ICT development index (IDI). This shows that the first component of IDI explains 56.72 of the variance and the first and second components explain 81.92%. This indicates that using the restricted indicator obtains a result similar to that provided by IDI (Bruno et al., 2011; Cruz-Jesus et al., 2018). Next, to explain a significant portion of the indicators, three components (access, use, and outcome) were selected to measure the weights of each level of the DD, for which eight indicators are presented in Table 4. The table also shows the indicators, categories, and weights assigned to each.
Principle Component Extraction of DDI.

Weights of DDI Indicators/Factors.
The DDI for a given provincial I (DDI i) is computed as follows:
DDI = 0.315*DDI-A + 0.316(DDI-U + 0.369*DDI-O
in which:
ICT Access = 0.315*(CP + MP)
ICT Use = 0.316* (IUP + BSP)
ICT Outcome = 0.369* (EC-T + EC-S + EC-P + EC-Gov)
Finally, the IDI scores for 31 provinces were obtained and the arithmetic average of each factor/indicator was computed for the category scores which were then aggregated by weighted sum (see Table 4).
Conceptual Model
Based on the literature, various aspects of the Chinese provincial-level digital gap are analyzed by identifying the social, economic, and political influences on ICT technologies (access, use, and outcome). The first approach considers technology use through a combination of institutional factors, presuming that they are linked to the demand and supply of institutional regulation and influence (Beilock & Dimitrova, 2003). King et al. (1994) connect innovation with the supply and demand of institutional standards: the current study model incorporates the provision of patents and trademarks. The second approaches the DD through social influence in U.S. metropolitan cities (Agarwal et al., 2009). Factors such as ethnicity, income, education, and gender, influence the geographical differential of ICT adoption and use. The squint effect reflects the educational and social aspects of this study model. Moreover, the current study of geographical effects/patterns is supported by Agarwal et al. (2009), who considered geographical proximity. The third theoretical approach, which advances social openness, government support, and the legal framework as transitional socioeconomic factors, which sequentially affect technology use (J. B. Pick & Azari, 2011). The current model utilizes several variables connected to socioeconomic levels.
Several studies investigate factors that influence the global DD, (Cruz-Jesus et al., 2018; J. B. Pick & Azari, 2011) at the country (Grishchenko, 2020), provincial (J. Pick et al., 2013; W. Song, 2008), prefectural (Nishida et al., 2014; Z. Song et al., 2019) and individual levels (Norris, 2001). We structured the current study’s conceptual framework on these substantial theories and consider three dimensions of the provincial DD in China (J. Pick et al., 2013; see also Beilock & Dimitrova, 2003; Nishida et al., 2014; Scheerder et al., 2017). Figure 1 shows this study’s conceptual underpinnings.

Conceptual framework.
Demographic Factors
Age, gender, and urban demographics are claimed to impact ICT adoption and use (Cruz-Jesus et al., 2017; J. Pick et al., 2013). Compared to the elderly, the younger population utilizes more personal technologies (Nishida et al., 2014). Most Internet users are in the working-age population (Blank, 2017). Because of the global economy, most of China’s workforce is technologically enabled (Z. Song et al., 2019). Urban citizens are mostly employed in competitive and digital services that extensively use technology (Xue & Wang, 2011). High priority has been given to ICT among China’s workforce aged from 16 to 59 in the production and consumption sectors (Z. Song et al., 2019). However, urban digital technology adoption and use are higher than in rural areas because of income gaps, affordability, location (Fong, 2009), and gender discrepancies (Wei & Hindman, 2011).
It is hypothesized that gender (Gen), urban population (UP) demographics, and the working-age population (WAP) will inform the DD index, and duly, the UP will enhance the provincial IDI.
Educational Factor
College education is a well-known and significant correlate of ICT use (Agarwal et al., 2009). In China, personal computer use is an important determinant among college students (Harwit, 2004). However, basic knowledge of mobile cellular technologies has increased personal ICT use (J. Song & Wang, 2012). To encourage ICT skills, education at the household/city/province/country levels can stimulate people and organizations to adopt and use ICT technologies (Nishida et al., 2014). Therefore, considering the DD literature, we hypothesized three determinants to intensify IDI at the provincial level: literacy rate (Lit), secondary education (SecEn), and tertiary education (TerEn).
Economic Factors
Income is a significant indicator of ICT access and use (Nishida et al., 2014; J. B. Pick et al., 2015). Studies confirm that economic development, especially gross domestic product (GDP) influences ICT access (Hargittai, 2002). Economies with higher income levels tend to promote ICT technologies (Cruz-Jesus et al., 2018; Rogers, 2010).
From China’s perspective, a high provincial GDP animates greater interest in ICT by government and business. Therefore, higher investment in ICT is expected to follow a higher (GDP) and more rapidly deploy the Internet (Cruz-Jesus et al., 2018). Moreover, the Internet penetration rate depends on household income levels (Z. Song et al., 2014) and PC possession connects to per capita income (Xue & Wang, 2011). Increasing numbers of individuals are shopping on the web (using Taobao, Jingdong, Alibaba, and others). In China, individuals and families with sufficient incomes can afford ICT expenses (Zhang, 2013). Income differences among the rural and metropolitan populations are recorded independently. Thus, rural residential income (RurIn), urban residential income (UrIn), and GDP per capita (GDP) are hypothesized to expand ICT use and outcomes.
Innovation Factor
Innovation depends on education and is a well-known coordinate of ICT use in China (Z. Song et al., 2019), the United States (J. Pick et al., 2013), Japan (Nishida et al., 2014), and worldwide (J. B. Pick & Azari, 2008). In particular, innovation in technology hubs motivates ICT development (J. B. Pick & Azari, 2011). Global research takes scientific and technical journal articles (R&D) to determine technology use, costs, and infrastructure (J. B. Pick & Azari, 2008). R&D expenditure in the U.S. encourages the use of the Internet, broadband, and computers (J. B. Pick et al., 2015), and innovation in European countries influences the prevalence of personal computers and broadband (J. B. Pick & Nishida, 2015). In China, the government emphasizes national and provincial innovation by endorsing patent applications and R&D inputs that nurture ICT use directly and indirectly to influence provincial economic growth. Patents (Pt) and R&D as innovation factors are posited to increase ICT development.
Institutional Factor
The available literature asserts that the DD is influenced by spatially distinct institutional and productive environments. Newspapers, magazines, and publishers have been identified as technology use indicators (J. Pick et al., 2013; Z. Song & Liu, 2013Newspapers in China are a knowledge dispersion vector and are considered to increase technology utilization. However, newspaper reading may reflect ideological adherence to a local institutional domain, culture, class, and capital (Z. Song et al., 2019). Foreign direct investment (FDI) is a leading indicator of local institutional domains encouraging access. Consequently, newspaper subscription (NPS) and FDI, are posited to increase the IDI level.
Credible government policies, dynamic citizen participation, and free knowledge-flows trigger ICT development (Beilock & Dimitrova, 2003; Z. Song & Liu, 2013). In China’s administrative system, the size of the government (SoG) is used to measure effectiveness and is considered to display the domain of local institutions. The SoG indicates that more administrative staff leads to provincial ineffectiveness. This conceptual model considers that SoG decreases ICT development.
Methodology
Data
DDs are complex and multifaceted issues, and the main constraint in DD research is data scarcity (Vicente & López, 2011). In China, digital issues are monitored by government organizations, and the required provincial-level data, materials, and relevant information (Table 5), were obtained from four official sources: the Provincial Statistical Yearbooks, China Statistical Yearbooks, China’s seventh national population investigation, and statistical reports (CNNIC, 2019), which also provided data for the 31 provinces (except Taiwan, Hong Kong, and Macao). In addition, some of the indicator data were obtained from the China Mobile, China Unicom, and China Telecom internet service companies’ homepages. E-government data were taken from the Ministry of Industry and Information Technology homepage.
Dependent and Independent Variables.

Note. CCSY = China City Statistical Yearbook; PRSY = Provincial Statistical Yearbooks; SRID = Statistical Report on Internet Development; CMOIT = China’s Ministry of industry and technology; CWEB = Data retrieved from internet broadband service companies, such as China Mobile, China Unicom and China Telecom; CNPIR = China’s seventh national population investigation and statistical report; PSYST = Provincial Statistical Yearbooks on science and technology; PSYP = Provincial Statistical Yearbooks on post and telecommunications.
Research Methodology
To gather attributes for the factors in the conceptual model, this study attempts to reveal the spatial agglomeration of the DD, evaluate the correlates, test multicollinearity factors, and reject the variables causing it. First, a composite index was constructed to assist in finalizing the spatial distribution of IDI. The final set of three DD dimensions were mapped using ArcGIS software to visualize the spatial pattern. Spatial autocorrelation (Moran, 1950) was applied, to test the spatial agglomeration of IDI at the provincial level. The Moran-I outcomes of dependent variables reveal that most of them have a highly significant positive spatial autocorrelation (Table 6). Finally, stepwise ordinary least square (OLS) analysis was applied to IDI based on 14 independent variables for 31 provinces. Correlates were revealed by a conformity regression test for OLS assumptions and a spatial autocorrelation test on the regression residuals. Moreover, the findings of the regression assumptions were tested and confirmed by the joint Wald statistic, Koenker (BP) statistic, and Jarque–Bera statistic.
Spatial Autocorrelation (Moran-I).

Note.**indicate statistical significance at the 5% level (two-tailed test), respectively.
Moran’s I index
Moran’s I was used to investigate the spatial agglomeration features of the provincial digital development level. It is significant only when the observed values are parallel within a specified distance (d) (Wang et al., 2016). This matters because it crucially validates whether the ICT variables are already grouped before evaluating the correlates of the DD; otherwise, the impact of socioeconomic and other independent correlates become superfluous (J. B. Pick et al., 2015). The GMI scale used to assess the degree of provincial IDI spatial correlation includes:

where n is the number of elements in the sample, yi and yj are the values of ICT variables in positions i and j, respectively, y is the average value of ICT variables, xij is the spatial weight matrix (n × n), and o is the sum of all elements.
Cluster Analysis
K-means clustering is a vector quantizing strategy dividing n observations into k groups and the closest mean is each observation of the cluster. K-means clustering assumes a point set Y = {y1, y2, …, yi, …, yn} with n distinct data point vectors in D-dimensions, where yi∈ Rd. Let X = Xk, I = 1, 2, …, K, and each class XK have a center k. The sum of squares from every data point in its center and J (XK) are calculated using the Euclidean distance method, and the total distance is minimized by the sum of squares J (C). The formula is as follows:


Using SPSS software, we use an iterative refining strategy to locate clusters of an equivalent spatial area. We choose a value of k = 5 clusters in the iterative process with values based on DDI values, which are composite assessments of 11 digital development characteristics.
Explanatory Results for the DD Spatial Pattern
DD Levels
Findings differ on the provincial spatial distribution of the DD among the three levels, and the most promising results are shown for the 3-LDD. Starting from the 1-LDD (Figure 2a), the provinces and municipalities with high ICT access values in 2018 were Guangdong and Beijing, followed by Shanghai, Jiangsu, Zhejiang, Hainan, and Tianjin. Twenty-one provinces had middle and lower DD values. The 2-LDD (Figure 2b) shows slightly promising results with the highest IDI values, including Guangdong, Shanghai, Jiangsu, Shandong, and Tianjin, followed by Beijing, Sichuan, and Liaoning. As mentioned earlier, the 3-LDD (Figure 2c) outcome is unexpected and shows a significant change in spatial results with the highest provincial levels in Beijing, Guangdong, Shanghai, Jiangsu, and Shandong. For the 2-and 3-LDDs, the high-level provinces are mostly located in coastal areas.

Spatial Pattern of the provincial digital divide in 2018: (a) ICT access, (b) ICT use, and (c) ICT outcome.
Findings on the Moran-I for the three levels of IDI show that the values in 2018 were all above 0.15 (Table 6). This shows a positive spatial autocorrelation with high values and differences among the three levels of the DD. The Moran-I values of the 3-LDD are the highest, followed by the 1- and 2-LDDs. This shows that the outcome divide is much more significant than the access and use divides. This is because of the “third digital China summit 2020” on smart logistics, e-commerce, Internet use, and digital advancements in fighting COVID-19. By June 2020, China had 940 million netizens (CNNIC, 2020). Overcoming the outcome divide strengthens cultural, educational, personal, motivational, and other socio-economic aspects (Scheerder et al., 2017; Wei & Hindman, 2011).
Geographical Characteristics of the Digital Divide
Based on DDI values, to understand the geographical clustering on provincial characteristics and municipalities, here we apply a K-means cluster analysis. Based on literature about K selection (Pham et al., 2005), five clusters were computed as pictured in Figure 3. Concerning the digital divide, China’s ICT levels cover a geographical spread from the central belt of the Yangtze River Delta, Yellow River, and Pearl River Delta, to the entire eastern coastal area further extended toward the north and west.
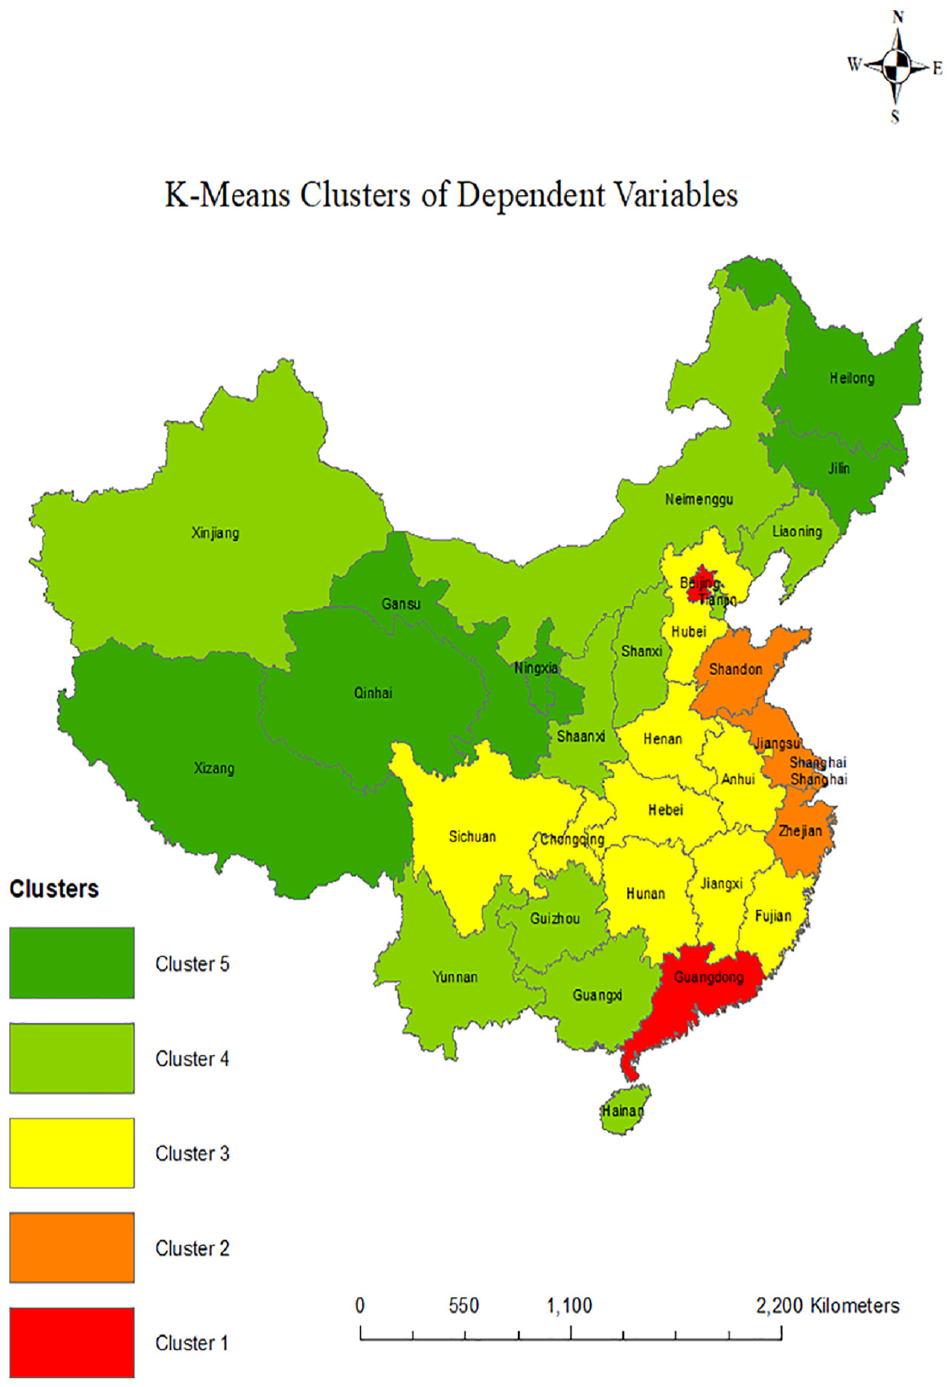
K-Means clusters of the three levels of DDI.
Cluster 1 Front Runner
In the frame of China’s provincial-level DDI, the first cluster termed as “Front Runner” contains one province and one municipality. The reason to be a front runner is that this cluster is the center of the national government, where many major universities, industries, and research institutes are in high demand of ICT technologies as a notable payoff of the second and third level divide. Moreover, both the province and municipality have already secured higher ICT technological growth and a relatively mature status in DDI. This cluster has the highest value in three levels of the digital divide except for the second-level (Table 7). The DDI values of provinces and municipalities in Cluster 1 and 2 with a high administrative ranking such as Beijing, Shanghai, Guangdong, Jiangsu, and Shandong were relatively high and agree with the results of Z. Song and Liu (2013).
K-Means Cluster Description of DDI Indicators.

Cluster 2 & 3 Achiever
Cluster 2 & 3 are named as “Achievers” and include 11 provinces and 3 municipalities. The ratios of high to low were higher as compared to other provinces (Table 7). These clusters have achieved a significant and relatively balanced ICT diffusion (use and outcome) and have increasing demand for digital technologies, but are still on the way toward maturity. Achievers are associated with the most developed and urbanized regions along Bohai Rim, Yangtze River Delta, and Yellow River. Three centrally administered municipalities are Shanghai, Tianjin, and Chongqing. The Yangtze River Delta consists mainly of Shanghai, the largest metropolis in China, and southern Jiangsu and northern Zhejiang provinces, and eastern coastal China like Zhejiang, Jiangsu, and Shandong. The remaining provinces are located in Central China around the Yangtze River Delta, and Yellow River such as in Henan, Hubei, Anhui, Jiangxi, Hunan, Hebei, Sichuan, and Fujian. The provincial government of these provinces emphasizes ICT technologies and policies which will lead them to become a nationwide example of the new technologies outcome. Therefore, the level of ICT use and outcome as compared to cluster one is much better.
Cluster 4 Catch Up
The fourth categorization of the provinces is named “Catch up” and this category includes 10 provinces. Few of the provinces are geographically located in the middle and west of China including Shaanxi, Shanxi, Yunnan, Guangxi, and Guizhou with a good economic condition. However, these provinces haven’t achieved well-developed ICT use and outcome as compared to the first three clusters. In terms of ICT access, this cluster shows a relatively better adoption than cluster 5 and can significantly improve in upcoming years (Table 7). The central and local government has given a subsidy policy and provides a special preferential policy to rural and poverty-stricken areas, which will assist in further development.
Cluster 5 Novice
China is a country that improves and innovates ICT technology on a daily basis and in previous literature, ICT growth at a provincial level is not the same if we compare it with today’s scenario. Every year the provincial ICT status changes because the provincial ICT technological statuses also change. We termed this category as “Novice,” which doesn’t mean that their status will not change in the future. Currently, they crossed the threshold of the information age and could be considered as preconditioned for take-off, and the ICT access status in this cluster is quite good (see, Table 7), but their output in terms of ICT use and the outcome is too low as compared to all the other clusters. Based on the empirics, we deem that their ICT growth is slower than other provinces. This cluster includes most of the rural regions in the middle, deep southwest, northwest, and northeast, especially the Qinghai-Tibet Plateau region. Most of the provinces shown in Figure 3 are mostly poverty-stricken areas in central and western China. The government attempted to improve rural income through e-commerce with “Taobao Villages” (Qi et al., 2019).
Overall, China’s provincial-level digital divide unveils that moving from the core zones (first runner and achievers) to the surrounding rural areas (Naive) shows that the spatial pattern decreases progressively. The effect is ostensive and clear that higher DDI values are connected to cities with higher administrative rankings.
Regression Results and Discussion
Fourteen independent variables were assessed for 31 provinces and analyzed using stepwise OLS regression in SPSS. The study findings (Table 8) are significant for all regressions. Diagnostic tests/checks of OLS regression, such as the Jarque-Bera statistics, Joint Wald statistics, and Koenker (BP) statistics indicate no impediments. The conceptual model estimated through step-wise OLS further shows that the WAP, urban UP, SecEn, RD, and SoG factors are most connected with IDI and all three levels of the divide. Further, adult Lit is connected to ICT-O, FDI is associated with ICT-U, urban residential income (UrI), and rural residential income (RrI) are both associated with the levels of the DD. The test for joint significance of several independent variable coefficients (Wald, 1943), was the Koenker (BP) test (Lyon & Tsai, 1996) and for the goodness of fit with the Jarque-Bera statistics and skewness and kurtosis for normal distribution (Jarque & Bera, 1980). For empirical clarity, all the essential procedures in our conceptual model estimation were tested and several outcomes of this study provide new insights.
Main regression Results.

Note. Table 8 shows the main regression results, where ***, **, and * indicate statistical significance at the 1%, 5%, and 10% levels (two-tailed test), respectively.
Demographic Factors
At the provincial level, two out of three, (WAP and the proportion of the UP) have a positive effect on IDI scores. Herein, WAP is firmly associated with ICT use and outcomes and positively impacts the spatial differences in IDI. China’s labor force has become technologically empowered since 2010, and most official work is Internet and PC-based (Z. Song & Liu, 2013; Z. Song et al., 2019). In addition, e-commerce is becoming more popular and every year sales increase by 14.3%, with 31.63 trillion Yuan in trade in 2018 and over 10 million live broadcasts with over 50 billion online views (CNNIC, 2020). This means more job creation, poverty reduction, and many other economic benefits. Thus, based on the results of the current study, WAP will increase ICT use and outcomes.
These findings reveal that UP has a promising impact on the spatial differences of all three DD levels because a “five-tier online system” for e-government services has been adopted by almost 70% of the provincial level urban population (CNNIC, 2020). Another promising UP factor is that urban netizens account for 69.6% of China’s total population (CNNIC, 2020). Moreover, the new 5 g infrastructure and the industrial internet also improve both urban and rural broadband access. Regarding gender, the correlation coefficient of IDI is negative but significant (−.135) (see Table 8), which indicates that gender no longer significantly drives the DD in China (Z. Song et al., 2020). Male and female internet use is almost equal, with male and female netizens respectively at 51% and 49% (CNNIC, 2020).
Economic Factors
This study shows that economic factors have a moderately positive impact on the spatial differences at the provincial level. Income is an important indicator because ICT technology is expensive. Regional residential income is a prime factor determining IDI value (Agarwal et al., 2009; Baliamoune-Lutz, 2003). Particularly in China, the rural and urban residential income gap is ignored and the focus is mainly on per capita income and PC ownership (Xue & Wang, 2011). A recent report by CNNIC (2020) revealed that the internet penetration differential among rural and urban areas has narrowed by 6.3%, with respectively 285 million and 654 million netizens. Administratively, in China, both rural and urban incomes are considered independently. For this reason, we noticed that both RrI and UrI have a significant effect on provincial IDI (Table 8). This study shows that UrI has more impact on IDI than RrI, as supported by (Nishida et al., 2014; Scheerder et al., 2017; Z. Song & Liu, 2013). For ICT access and outcomes at the provincial level, UrI has more effect than RrI. This is because the urban Internet users are almost double the rural netizens, which affects income gaps, affordability, and ICT literacy (Fong, 2009).
Moreover, the centers of e-commerce are urban and residents can more easily conduct e-business and for example, online learning (Scheerder et al., 2017; Z. Song et al., 2019). RrI shows a slight increase in the three levels of the DD, with the outcomes in rural regions being significant but not positive thus showing the urgency of supporting ICT access and use.
GDP per capita shows very promising effects on IDI values and all DD levels. These results imply that provincial economic development, economic scale, and scope significantly promote digital development. Moreover, the correlation coefficient of ICT outcomes is high, followed by ICT use and access. Nishida et al. (2014) explained that higher GDP attracts investment in digital technology both by government and business, which can upgrade digital infrastructure, develop e-commerce, and lower the Internet access cost.
Education Factor
Education is a prominent DD factor that positively affects spatial differences in provincial digital progress and is widely reported (J. B. Pick et al., 2015; Z. Song et al., 2019; J. van Dijk & Hacker, 2003). From our perspective, the adult literacy rate (Lit) and tertiary education (TerEn) show more promising results than secondary education (SecEn). J. Pick et al. (2013) also hold that geographic agglomeration of “ICT use” dismisses SecEn as an important factor. Table 8 specifies that in 2018, with technological growth and increased netizens percentage, it became worthwhile to link it with ICT outcomes, having a correlation coefficient of 1.091. However, TerEn remains the major driver of the three DD levels. Studies show that a well-educated (TerEn) individual contributes more to ICT use and outcomes.
Innovation Factor
Innovation is measured by research and RD and Pt, which respectively have significant and minor impacts on provincial IDI scores. Table 8 indicates the weak correlates of RD compared to Pt indicating that central and provincial governments should encourage more investment in them. This is the first confirmation of the importance of Pt at the provincial level. However, previous literature has identified that such investment is not specifically for IT innovation (J. B. Pick & Azari, 2011) yet innovation connections are claimed for the U.S. and other nations (Azari & Pick, 2005). For China, Z. Song and Liu (2013) put forward the promising role of innovation in ICT use. Furthermore, ICT technologies, the internet, smartphones, PCs, and online businesses usually require basic IT knowledge, but this does not advance RD and PT applications. This may show that RD and Pt promote the geographic agglomeration of digital skills and the provincial creation of knowledge communities to increase digital development through use.
Institutional Factors
Two of the four institutional factors had significant positive effects on the provincial-level IDI scores. Among these FDI has a low negative impact, which indicates that digital China is a country-level project and that local institutions and investments mostly have a low impact. The NPS has a low positive impact on ICT use, with a correlation coefficient of .285. At the provincial level, NPS can enhance Internet penetration and e-learning. Moreover, contrasted with this study, high-tech usage levels in the U.S., Japan, and India are strongly connected to the NPS (J. B. Pick et al., 2015). Further, both the SoG and E-gov have a strong and significant positive impact on all levels of spatial differences in the provincial digital development index. In China, SoG is very influential; the lower the SoG, the greater the public welfare expenditure and ICT infrastructure. At provincial level, SoG may improve socio-economic aspects, such as citizens’ satisfaction with services, interaction with business, and industry through ICT access (Zhou, 2017).
Conclusion
The digital divide (DD) is a vague concept that has been considered since the early 1990s. Advancement in ICT technologies, particularly the emergence of the Fourth Industrial Revolution, highlighted the need to diminish the DD. In the digitalized world, China is among the top two countries in terms of netizens, internet hosting, e-commerce, and mobile phone subscriptions. Spatial differences with a substantial DD among provincial, prefectural, and county levels have been increasing. Therefore, spatial patterns on provincial level were applied to develop more comprehensive and detailed insights. The conceptual framework of this study defined the DD at the provincial level under three subcategories: The first-, second-, and third-level digital divides (1-, 2-, and 3-LDDs), and analyzed the pattern and correlation of the DD using regression and spatial analysis. In the designed conceptual model, it appears that the study findings contribute to the literature on generational DD (Fong, 2009; see also J. Pick et al., 2013; Z. Song et al., 2014, Z., 2019). Herein, we also noted that the spatial differences of 3-LDD are more discernible, followed by the 2-LDD and the 1-LDD, thus for innovation and institutional outcomes, the 3-LDD supersedes the remaining divides. In addition, high IDI values in provinces resulted from strong administration.
Working-age population, urban population, adult literacy rate, tertiary education, and size of government were identified to be the major determinants of DD in a step-wise OLS model. In China, income levels were shown to be one of the most important drivers of internet penetration in previous research (Wei & Hindman, 2011; Yu & Zhou, 2016), however there was a difference between urban and rural residential incomes, with the influence of urban residential income being somewhat more important. Although adult literacy rate is a well-known correlate of ICT usage (J. Pick et al., 2013). This study finds that tertiary education has a greater beneficial influence on all the three levels of ICT, but higher education is a primary driver of ICT use and outcomes. The findings show that, contrary to what others in ICT-related professions believe, fundamental skills in the general public are more vital for ICT development. In order to achieve digital equality, access and skills training are also required.
Policy Implications
For national government policymaking in China, this study suggests that ICT utilization can be promoted by policies on factors such as education, institutional development, e-government, and newspaper circulation. The low ICT access and use among most of the rural, middle deep northwest, and southwest regions, especially the Qinghai-Tibet Plateau region, affirm government policies to strengthen and support ICT technologies there. Moreover, provincial governments should scrutinize local governments to minimize size to boost efficiency. To motivate the working population to advance ICT technology and knowledge flow, provincial governments should limit administrative staff and expenditure. Another policy option is committing to long-term investments in innovation that support the latest ICT technologies, such as mobile phones and 5 g (Z. Song et al., 2019).
For practitioners and planners, this study illustrates that GIS and spatial analysis combined with statistics provide skillful insights regarding decision-making and analysis. Moreover, for DD research, this study demonstrates insightful contributions in spatial mapping and confirmatory autocorrelation on three levels of the DD (Nishida et al., 2014). Compared to previous research at the provincial level, this study provides a detailed conceptual framework with geographical units, along with new insights into spatial analysis methods and regression modes. Such robust analytic methods are rarely used in telecommunication and economic studies (see, J. B. Pick et al., 2015).
Limitations and Future Research
Research on the DD is limited by the lack of longitudinal samples because of data sparsity on many base variables. However, the current set of variables was acquired from different data platforms. This drawback is connected to regression, which is unidirectional instead of interacting with concurrent relationships. Even so, most of the DD studies are unidirectional, and this study is methodologically constrained by limited data. Furthermore, the data sample is better suited for regression being too small to support greater complexity such as for structural equation modeling. The future direction of DD research would cover extended aspects of the size of government, investment measures, different age groups, and longitudinal studies at both the provincial and prefectural levels to reveal more promising features.
Footnotes
Author Contributions
The contribution of all the authors are highly appreciated, especially Dr. Jiang who provide all the data for this study. And this study is fully supported by Prof. Wen and Dr. Jiang research project which is highly admired.
Declaration of Conflicting Interests
The author(s) declared no potential conflicts of interest with respect to the research, authorship, and/or publication of this article.
Funding
The author(s) disclosed receipt of the following financial support for the research, authorship, and/or publication of this article: This study was primarily funded by the Project of National Natural Science Foundation of China (72074176) and also National Natural Science Foundation of China (71874138): Theoretical and empirical study on the impact of ICT on technological progress in China.
Informed Consent
Informed consent was obtained from all individual participants included in the study. This article does not contain any studies with human participants or animals performed by any of the authors.