
Abstract
Resilience is a necessary condition for industries to withstand shocks and achieve sustainable development. Cultural industry is a vital sector of the national economy, and it is crucial to enhance its resilience against external shocks. To quantitatively assess cultural industry resilience (CIR), a multidimensional indicator system comprising three dimensions, resistance, robustness and recovery, was built. The framework integrates 18 secondary indicators and 41 tertiary indicators to capture the dynamic adaptive capacity of the cultural industry under external perturbations. The data are collected from official statistical yearbooks from 2013 to 2024 to analyze the CIR of 30 provinces and seven regions in China. The weight of each indicator was determined using the entropy value method, and the cluster analysis method and the Dagum Gini coefficient were used to analyze the temporal-spatial differences of CIR at provincial and regional levels. On this basis, a panel regression model was applied to measure the factors influencing the CIR. The results show that China’s CIR exhibits pronounced regional disparities, with eastern coastal provinces consistently leading in growth and stability, while the central, western and border regions lag significantly. There are also noticeable differences among the three dimensions of CIR. The spatial-temporal differences show an obvious cluster distribution. Inter-regional differences are the main source of CIR differences in China. This imbalance correlates with economic development, educational investment, technological investment, government support and population density, while urban-rural gaps exert negative impacts.
Introduction
In recent years, external factors of core technology transformation and geopolitical competition among major powers have significantly impacted the economies and industrial chains of numerous industries. Many countries have begun to pay attention to strengthening industry resilience, economic resilience and the ability to withstand various shocks. Resilience refers to the ability to adapt to future surprises as conditions evolve (Woods, 2015). The concept of resilience first appeared in the fields of physics and engineering. Holling (1973) applied it to ecology, arguing that resilience is the ability of a system to recover and restructure after external shocks. Since then, resilience has been widely applied in ecology, engineering, economics and other fields. Additionally, the research perspective has evolved from a single engineering perspective to a composite perspective of ecology, technology, society and economy. Currently, there are several mainstream perspectives on resilience. These include engineering resilience (Yodo & Wang, 2016), ecological resilience (Simmie & Martin, 2010) and evolutionary resilience (Boschma, 2015; Sgrò et al., 2011). The classification of the concept of resilience can be divided into two (Pratt, 2015; Shi & Hu, 2023; Taylor, 2020), three (Christopherson et al., 2010; Ouyang et al., 2012), or four stages (Kurth et al., 2019; Martin et al., 2015; Yao et al., 2024). As researches progress, new concepts have emerged, including economic resilience (Xie et al., 2018), regional resilience (Christopherson et al., 2010) and community resilience (Wilson et al., 2018).
Currently, there are few studies on industry resilience, which are still in the preliminary stages of development. Most studies on resilience have focused on economic resilience (T. Cheng, Zhao, et al., 2024), with industrial factors regarded as influencing economic resilience (T. Cheng, Zhao, et al., 2024). A robust industrial chain can quickly recover to its pre-shock state in the face of shocks and identify novel avenues for growth (Zhao et al., 2024). Resilience has become a key focus in academia and policymaking, shifting economic development priorities from traditional growth metrics to adaptive flexibility. It also innovates tools and methods for measuring the growth potential of industries (Goosen et al., 2022). Industry resilience is defined as the sensitivity, vulnerability, recovery and evolutionary characteristics of an industry when subjected to external shocks (Hohenstein et al., 2015; Sawik, 2013; Schmitt & Singh, 2012). It encompasses the ability to resist shocks and adjust the system to maintain stability and facilitate evolution (Woods, 2015).
The term “Culture Industry” was first introduced by Adorno and Horkheimer (1947) in the book “Dialectic of Enlightenment”. Cultural industry, as a special form of culture and economy, impacts people’s lives. Cultural industry and popular culture have fundamental differences. The existence of cultural industry is to meet the needs of the masses, who are the carriers of its ideology (Turner, 2006). The concept of cultural industry varies from country to country. Cultural industry provides non-material services through knowledge creation and content production and falls under the category of a typical tertiary industry (Sokół et al., 2023). Adorno and Bernstein (2018) believe that the cultural industry encompasses 12 sectors, such as music, performing arts and publishing software. Some scholars also define cultural industry based on the aesthetic, symbolic, and social significance and display value of cultural products (Peltoniemi, 2015). The United Nations Educational, Scientific and Cultural Organization (UNESCO, 2009) defines it as follows: Cultural industry refers to a series of activities that produce, reproduce, store and distribute cultural products and services in accordance with industrial standards.
Cultural industry is a significant pillar of the national economy. Cultural industry is a significant contributor to economic growth in many countries, such as the United States, England, Japan and China, offering high added value and strong industrial correlation (Chang & Zhang, 2024). In 2024, China’s cultural industry achieved a total operating revenue of 19,142.3 billion yuan, an increase of 7.1% compared to the previous year, accounting for approximately 14.19% of the country’s GDP. Among these, the cultural service industry achieved an operating revenue of 10,913.4 billion yuan, while the cultural manufacturing industry and cultural wholesale and retail industries achieved operating revenues of 4,960.9 billion yuan and 3,267.9 billion yuan, respectively (data are from the Report on the Development of Cultural and Related Industries Nationwide in 2024). Furthermore, it is a green industry with promising development potential and future growth prospects in the 21st century. Governments in many countries are increasing their attention and development efforts.
However, despite the apparent success of the cultural industry, there are indications that the resources, talents, technologies, institutions and other factors supporting its development in some regions are insufficient (Guo & Zeng, 2024; Yao et al., 2022). There are a number of risks associated with the development of cultural industry, including slow construction, technological integration and the impact of Western ideas and culture (Balsalobre-Lorente & Shah, 2024; Ward, 2018). The foundation of the industrial chain is weak, and development is not yet complete. Furthermore, the characteristics of the main cultural enterprises are “small, chaotic and scattered”. Simultaneously, the industry exhibits characteristics of high investment, high growth, high return and high risk. Furthermore, the job market in cultural industry is characterized by a high degree of mobility, with examples including part-time workers and new media creators. Additionally, some cultural institutions have yet to achieve profitability, which may adversely affect the stability and resilience of the cultural industry.
Based on the important position and role of cultural industry, the development efficiency and competitiveness of the cultural industry have been widely studied. However, studies on the resilience of the cultural industry still needs to be further developed.
Resilience can provide a new analytical perspective for cultural industry to enhance its ability to withstand risks and achieve sustainable development. Cultural industry resilience (CIR) has gained increasing attention. The CIR is an extension of regional resilience and industrial resilience in the cultural domain (Pratt, 2015). Although the three have the same logical structure of resilience, the cultural industry, owing to the non-replaceability of cultural products and attributes, needs to establish an evaluation system for the construction of the cultural production chain and include economic and social effect value (Cellini & Cuccia, 2019; Khlystova & Kalyuzhnova, 2023). The CIR refers to the inherent ability of the cultural industry system to recover to its pre-shock state or achieve a “new normal” when facing external impacts, through measures such as adjusting the industrial chain structure, activating cultural resources, and strengthening cultural value identification (Christopherson et al., 2010; Fahmi et al., 2023). Some literature has touched on CIR from the aspects of cultural industry security, tourism industry, regional economy and so on (Kamran, 2022). Through a case study, Vanolo (2015) found that Turin’s film culture resources are flexible and adaptable to the impact of the external environment, which is a potential source of urban economic development and is helpful for both enterprises and employment. Liu et al. (2023) used the spatial synchronization equation model to test the influence of cultural and creative industry cluster on regional economic resilience in 31 provinces (municipalities and autonomous regions, the same below) in China from 1997 to 2020, and found that the specialization characteristics of cultural and creative industry cluster and regional economic resilience interact. Shaughnessy et al. (2024) pointed out that the Covid-19 pandemic highlighted the vulnerability of the creative and cultural industries, and sustainable development of cultural and creative industries can be supported by improving wages and working conditions and providing spiritual support. Herbane (2019) identified resilience in the hospitality and leisure industry as the readiness and ability to successfully deal with crises and return to normalcy.
How to cope with the effects of shocks by improving the CIR is an important issue that needs urgent attention and solutions. Therefore, this study tries to investigate the level of the CIR, complements the studies on the CIR, and provides basic data support and countermeasures to promote the high-quality development of the cultural industry in China, and enrich the theory of cultural industry development. The study will help the government formulate policies, understand the development of cultural industry, and promote the rapid growth of cultural enterprises.
Methods and Data
Indicator System Selection
It is necessary to effectively identify the characteristics of cultural industry under the influence of external shocks, and further determine its resilience. This is of great significance for promoting the high-quality and sustainable development of cultural industry.
The quantification of resilience is a hot topic, and its assessment methods can be divided into two categories. One is the discontinuous method, which emphasizes the multi-scale and complex network relationships within the system (Wang et al., 2019). The other approach is the indicator system method, which uses key variable indicators and meta-indicators to describe the system and implement adaptive governance and management (Kotzee & Reyers, 2016; Liu et al., 2019). The discontinuous method is adept at capturing multiscale complex relationships and nonlinear dynamics within the system and is suitable for an in-depth analysis of the underlying mechanisms. However, it involves complex calculations, requires high-quality data, and presents abstract results, making it difficult to apply directly in practice. The indicator system method has a clear structure and is easy to use. This enables the monitoring and cross-regional comparison of system resilience through quantitative indicators, facilitating rapid application and standardized promotion by policymakers. Although there are issues such as simplifying the system, ignoring non-linearity and the subjectivity of indicators, in this study, it is more suitable for the specific needs of calculating CIR in a particular region, providing an intuitive assessment framework and establishing a unified calculation standard.
In this study, a 3Rs indicator system was constructed to measure CIR. Combined with relevant definitions and understanding of resilience, this study believes that CIR refers to the ability of the industry as a whole to effectively resist external shocks, maintain its own stable state, and quickly recover, adjust and transform from the shocks. Grafton et al. (2019) proposed that based on seven resilience actions, the social-ecological system can be recognized from three perspectives that are resistance, robustness and recovery (3Rs) . Yu et al. (2023) applied the process-based “robustness-resistance-recovery (3Rs)” quantitative assessment framework and used the Dongting Lake Basin as an empirical area. Therefore, this study believes that CIR includes three dimensions: resistance, robustness and recovery (Duchek, 2020; Erol et al., 2010; Madni & Jackson, 2009; Sanchis & Poler, 2013). Resistance refers to the ability to avoid and stabilize before and during an impact; robustness refers to the ability to readjust an industrial structure to the new external environment after a shock; and recovery refers to the ability to repair, recover, grow and maintain the original operating path or break the original path after the end of a shock disturbance.
Owing to the scarcity of studies on the CIR and the incompleteness of the involved indicators, this study, based on the 3Rs theory, selected 41 tertiary indicators as the measurement indicators of the CIR through three rounds of expert interviews (Five professors specializing in the field of culture industry.), collection and discussion. A comprehensive evaluation indicator system of the CIR, including three primary indicators (resistance, robustness and recovery), 18 secondary indicators and 41 tertiary indicators is constructed, as shown in Table 1.
Indicator System, Weight and Source.

Indicator Weighting Processing
In this study, the entropy method was used to measure the weights of indicators. The entropy method is an objective method that determines the indicator weight according to the information entropy provided by the observed value of each indicator. In the information theory, entropy is a measure of uncertain information. The higher the information entropy, the less information it contains and the lower its weight; conversely, the lower the information entropy, the more information it contains, and the higher the weight it gives. The specific steps are as follows.
Step 1: Indicator selection. With r years, n regions and m indicators, x represents the value of the i year, the j region and the k indicator.
Step 2: Standardization of indicators. Since different indicators have different dimensions and units, it is necessary to standardize the original indicators. Positive indicator standardization method and negative indicator standardization method are respectively
Step 3: Calculate the proportion of k indicator:
Step 4: Calculate the entropy of k indicator:
Step 5: Calculate the coefficient of variation of the k indicator:
Step 6: Calculate the weight of the k indicator:
Step 7: Get an annual level of economic resilience:
The final processing results are shown in Table 1.
Spatial-Temporal Differences Analysis
Cluster analysis refers to an analysis classifies a group of individuals into multiple categories composed of similar objects (Celebi et al., 2013). The basic principle of cluster analysis is to use an algorithm to calculate the correlation between indicators according to the attributes of the sample, determine the close and distant relationship between each case, and finally divide all cases into multiple similar groups. Cluster methods include the systematic clustering method (also known as hierarchical clustering method), K-means clustering method and so on. In this study, Ward system clustering and K-Means clustering analysis are used to analyze the CIR level of 30 provinces across China to better find the differences among provinces in their spatial distribution.
In the study of regional differences, scholars mostly choose Theil indicator, coefficient of variation and Gini coefficient. This study adopts the Gini coefficient method proposed by Dagum (1997), which was originally used to measure the regional income gap, and its subgroup decomposition method can effectively solve the source problem of regional differences. The biggest advantage of Dagum Gini coefficient and its decomposition method is that the overall Gini coefficient can be further divided into three parts: intra-regional differential contribution (
This paper adopts Dagum Gini coefficient and its decomposition method to analyze the regional differences in the CIR level in China. The specific calculation formula is as follows:


Identification of Influencing Factors
To analyze the factors influencing the resilience of China’s cultural industry, this study employs panel regression analysis in econometrics to examine the dynamic relationships. The CIR of each province was selected as the dependent variable. Referring to previous studies, this study selected nine influencing factors, namely unemployment rate (Qin & Lin, 2021), educational investment level (Salvador & Comunian, 2024), technological investment level (Wu et al., 2023), economic development level (Ryder, 2004), human capital (Zhang & Li, 2018), government support, population size (Ji et al., 2022; Venables, 1996), urban-rural gap and cultural institutions (Ji et al., 2022), as independent variables. To eliminate the interference of other potential factors in the results, this study selected six control variables: industrial structure (Getzner, 2002), urban economic density (Chen et al., 2024), urban population density (Pata et al., 2025), social consumption level (T. Zhu, Yu, et al., 2023), transportation infrastructure level (Zhang & Li, 2018) and information level (Qie, 2024). Table 2 presents the descriptive statistics of these variables.
Selection of Influencing Factors.

Based on the independent, dependent and control variables, the panel regression model was built as following:

Where,
Data Sources
This study selects panel data of the cultural industry from 2012 to 2023 as the sample. The data for this study were derived from diverse sources. The data mainly come from the Statistical Yearbook of China Culture and Related Industries (2013–2024), the Statistical Yearbook of China Cultural Relics and Tourism (2012–2018), the Statistical Yearbook of China Cultural Relics (2019–2024), and the China Statistical Yearbook (2012–2024). Based on the principles of data reliability, availability, comparability and representativeness, the data period is 2012–2023. Owing to the long data spans, there is a severe lack of cultural industry data for prefecture-level cities in China. This study focused on 30 provinces and the seven major geographical regions of China for the calculations. The data from regions such as Tibet, Taiwan, Hong Kong and Macao were seriously lacking, and this study did not consider them. The seven major geographical regions of China are regions that have been delineated based on comprehensive considerations of economic, cultural and geographical factors, in accordance with relevant classification principles. Because the presence there are only a few data missing and these missing data are continuous, linear interpolation method was used to supplement the individual missing data, for it particularly considers the continuity and trend characteristics of the time series data.
Results
Level Differentiation of the CIR
At the national average level and in the seven regions, the CIR generally shows an upward trend over the sample period. As shown in Figure 1, the national average resilience value increased from 0.0805 in 2012 to 0.1379 in 2023, showing a clear upward trend. The average annual growth rate was 5.94%. All seven regions showed fluctuating growth trends over the sample period. East China and South China had the highest resilience values, which increased rapidly. Northeast China and Northwest China had relatively low resilience, and their growth was slow. The Central China had the highest average annual growth rate of 7.80%.

Overall and regional resilience of cultural industries.
East China and South China consistently exhibit the highest levels of resilience, including economically developed and populous coastal cities such as Shanghai, Jiangsu, Zhejiang and Guangdong. This may be attributed to the region’s advantage in terms of scale and efficiency in the cultural industry compared to other regions. The Central China had the highest average annual growth rate, including Central Plain cultural areas such as Henan and Hebei, which are rich in cultural and historical heritage. In contrast, Northeast China had the lowest overall resilience and growth rate.
In Appendix, Table A presents the results of the CIR for 30 provinces and seven regions in China from 2012 to 2023. Table 3 shows the scores, mean scores and mean rankings of each province during the sample period. It could be observed that Guangdong, Jiangsu and Zhejiang are the provinces with the highest CIR mean value from 2012 to 2023, followed by Beijing, Shandong and Shanghai. The top-ranked regions are those with strong competitiveness in the cultural industry, developed economies, convenient transport and good industrial environments, which are conducive to maintaining good industry resilience. The remote Northwest China and Northeastern China, such as Qinghai, Ningxia and Heilongjiang, consistently exhibited lower annual levels. This could be attributed to many factors, including relatively underdeveloped economy, weaker geographic and resource advantages, and difficulties in the development of related industries, which collectively resulted in a lower CIR. The national average ranks 12th nationwide, ahead of most provinces.
Resilience and Ranking of Cultural Industries in Provinces.

Latitudinal Analysis of the CIR
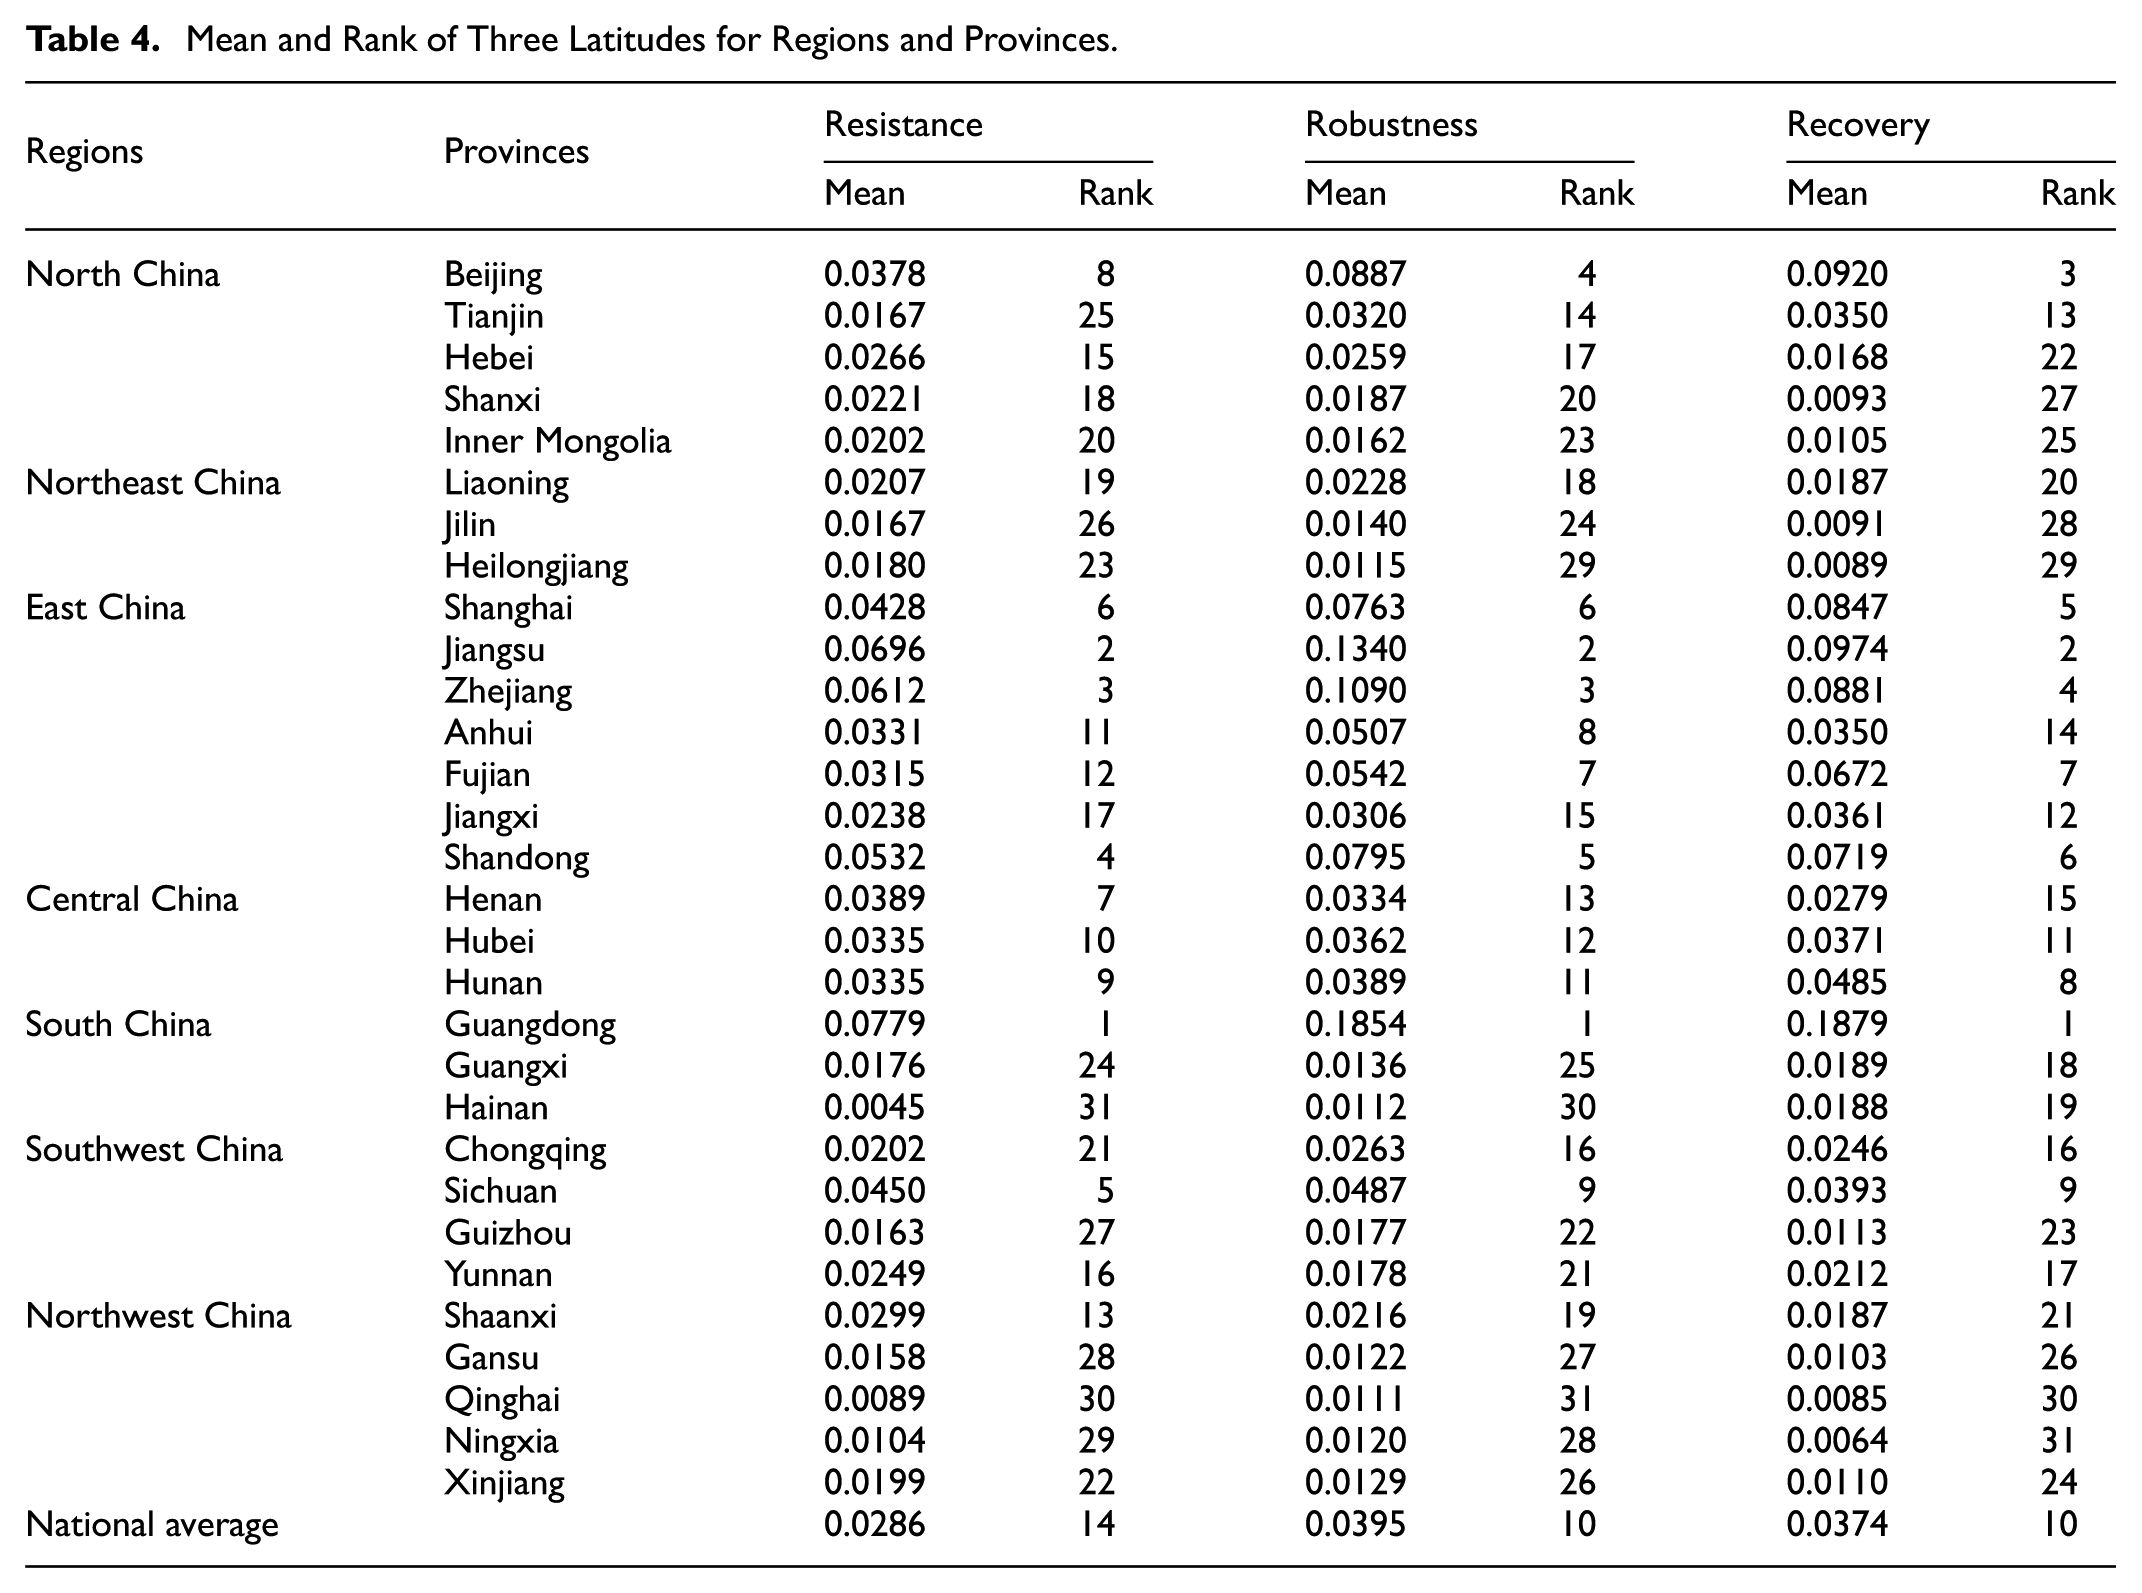
To further explore the heterogeneity of the CIR level in different regions and provinces, this study analyzes the scores of the three dimensions of resilience, robustness and recovery of cultural industries in each province from 2012 to 2023. Table 4 shows the mean scores and rank of the three dimensions of resistance, robustness and recovery of the CIR at provincial level from 2012 to 2023, and help further understand and analyze the latitude differences among regions and provinces.
(1) The latitude of resistance, robustness and recovery at the regional and provincial levels all show the characteristics of imbalance among regions and provinces. Guangdong in South China and Jiangsu in East China have the highest scores in all three aspects, ranking first and second, respectively. In addition, five other provinces, Beijing, Shanghai, Zhejiang, Shandong and Sichuan, also ranked within the top 10 in all three aspects. The overall ranking of Southwest China was moderate, with only Sichuan performing relatively well. The rankings of Northwest China and Northeast China are relatively lower, mostly ranking after the 20th place. In South China, except for Guangdong, the rankings of other provinces are relatively low, but their rankings of resistance and robustness are generally much lower than their rankings of Recovery.
(2) The national average level of the resistance for all provinces from 2012 to 2023 was 0.0286, and there were 13 provinces above the national average level. Guangdong, Jiangsu, Zhejiang, and other parts of East China had a better industrial foundation, with a high CIR level. At the same time, some provinces in Central China and East China, such as Anhui, Henan, Hubei and Hunan, were also above the national average level, which may be the reasons that these areas have good cultural resources. However, in South China, the resistance level of Hainan was only 0.0045, far from the national average level, and the resistance level of Guangdong was 17.31 times higher than that of Hainan. This shows that the imbalance of the CIR among regions and provinces in China is serious, and some provinces need to increase their resistance.
(3) The national average level of the robustness from 2012 to 2023 was 0.0395, and its rank was 10. The average level of nine provinces is higher than the national average level, of which six are in East China, accounting for 85.7%. This indicates that East China has superior cultural services, innovation capacity, capital investment and other advantages compared to other regions, and has a stronger ability to adapt to external influences. Hainan and Guangxi were far behind Guangdong. In addition, Zhejiang, Beijing and Jiangsu revealed significant differences, indicating a significant imbalance and a large gap in the robustness latitude of the CIR.
(4) The average level of the recovery of each province from 2012 to 2023 was 0.0374. Nine provinces had values above the national average level, accounting for 33.33% of the national average level. Among the provinces with a ranking higher than the national average level, there is one in North China, one in South China, one in Central China, one in Southwest China and five in East China. This suggests that East China has better economic benefits, a higher degree of openness and other advantages than other regions, and that the cultural industry itself could recover and develop better. The rankings for Northeast China and Northwest China were generally low. The provinces in these regions were all ranked after the 20th. The recovery latitudes of Northeastern China were all below 0.0187. The recovery capabilities of these cities are generally poor, indicating that these regions are less resilient than others. This is also an important factor contributing to the relatively low overall CIR. Meanwhile, Meanwhile, Jiangsu ranked second, differed from Guangdong by 0.1879, representing a significant disparity. This indicates a considerable imbalance in the recovery latitude of the CIR.
Mean and Rank of Three Latitudes for Regions and Provinces.
Spatial Cluster Analysis of the CIR
This study used a clustering method to investigate whether the CIR level had spatial characteristics. Through the systematic clustering method of SPSS 27.0, Figure A in the Appendix shows the result of ward clustering analysis, which objectively classified the resilience level of 30 provinces into four categories of echelon. They are classified as the first, second, third and fourth types, with the CIR sorted from high to low.
(1) There are 19 provinces that are Tianjin, Hebei, Shanxi, Inner Mongolia, Liaoning, Jilin, Heilongjiang, Jiangxi, Henan, Guangxi, Hainan, Chungking, Guizhou, Yunnan, Shaanxi, Gansu, Qinghai, Ningxia and Xinjiang serving as the fourth type. Some provinces are rich in material and intangible cultural resources and have rich ethnic minority cultures. However, local cultural industries, such as Henan and Shanxi, lack capital investment and have a low market conversion rate. The development of cultural industries in Inner Mongolia, Qinghai, Gansu and other places is relatively backward. It did not meet the needs of the market economy and lacked the advantages of industrial development and resilience.
(2) There are five provinces that are Anhui, Fujian, Hubei, Hunan and Sichuan serving as the third type. These regions possess rich traditional and ethnic cultures. Economically, they rely on high-tech manufacturing and private enterprises as pillars, and in terms of facilities, they accelerate the construction of transportation networks and regional collaborations. Industries form distinctive clusters and complete ecological chains. Therefore, these provinces formed the third type. Although it already had a better foundation for the development of cultural industry, there were still challenges such as insufficient development, small scale, technology constraints, and insufficient innovation capacity. This makes it impossible to develop cultural industry in a healthy manner.
(3) The five provinces of Beijing, Shanghai, Jiangsu, Zhejiang and Shandong are the second type and have a relatively high CIR level in China. These developed regions have profound cultural resources, innovative factors and other advantageous resources. Provinces such as Beijing, Shanghai, Jiangsu and Zhejiang are all at the forefront of China’s economic development. Within these regions, industries are highly concentrated, well-equipped, and numerous high-tech industries exist. Shandong has a profound and far-reaching Qilu culture. The cultural industries in these regions have a higher level of efficiency and competitiveness; therefore, they have a higher level of resilience.
(4) Only one province, Guangdong, was in the first type because it had a good foundation for economic development, a superior geographical location, and abundant resources. Guangdong is the core of Lingnan culture, which provides the region with rich traditional cultural resources and historical heritage. Local residents had a high consumption capacity, whereas cultural enterprises and creative talents were highly concentrated. This could help to form a strong cultural industry atmosphere and provide a strong industrial foundation for the development of cultural industry, so as to have a good CIR.
Table B in the Appendix is the result of classifying 30 provinces from 2012 to 2023 through the K-means clustering method of SPSS 27.0. Based on this, Figure 2 shows the change in the proportion of each type annually, with all types showing a relatively stable trend. Among them, the proportion of Type 4 showed a fluctuating growth trend, and the proportion of Type 3 showed a continuous decline. Beijing, Shanghai, Jiangsu, Zhejiang, Shandong and Guangdong were in the first and second type. This indicates that the CIR level of all provinces is constantly changing and may reflect the characteristics of pattern differences. The CIR level of each province still shows serious imbalances. Therefore, most regions need to focus on improving the CIR level.

Distributional weights by year and Echelon.
Spatial Differences Analysis of the CIR
(1) There are temporal and regional differences in the CIR levels. Tables 5 and 6 reports the results of the average Dagum Gini coefficient, the Dagum Gini coefficient and contribution value. Table 7 shows the seven regional differences in the CIR level. Table 6 shows the Intra-regional Gini coefficient for the seven regions. Figure 3 shows that the total Gini coefficient of the cultural industry in the seven regions continuously rose from 0.4662 in 2012 to 0.5205 in 2023. In 2020, it exceeded 0.5 and accelerated its upward trend. Regional CIR differences have significantly intensified. In 2020, the outbreak of the COVID-19 pandemic led to a jump in the coefficient to 0.5042, with a year-over-year growth of 6.3%. In 2023, the coefficient slightly decreased to 0.5205, but it was still higher than the pre-pandemic level, reflecting the pandemic’s long-term impact and structural contradictions. The contribution rate of inter-regional differences was stable at 70%–71%, dominating the inequality structure. The contribution rate of intra-regional differences was approximately 9%–10%, and the transvariation intensity contribution rate increased from 19.53% to 21.26%, indicating that the impact of extreme gaps has expanded.
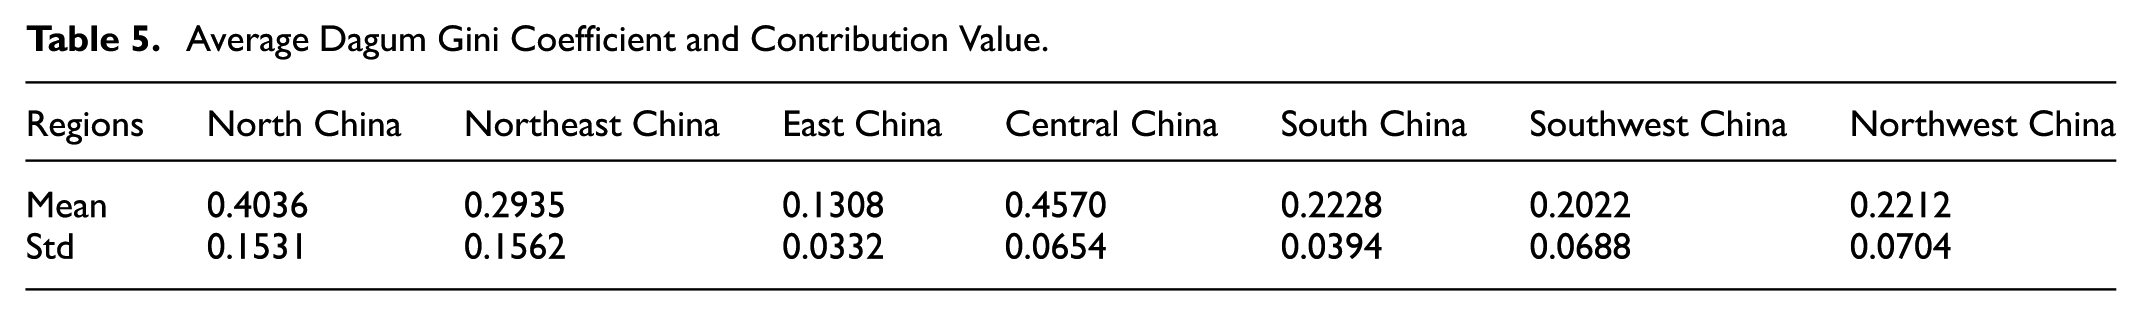
(2) There are significant differences in the CIR levels within and among regions. Table 7 show significant differences in intra-regional conditions among the seven regions. The average Gini coefficient in Central China is the highest, while that in East China is the lowest, and the standard deviation of the CIR for each year in this region is also the smallest. The average Gini coefficient and the standard deviation of the CIR for each year in North China are both large. The average Gini coefficients of the seven regions are as follows: Central China (0.4570) > North China (0.4036) > Northeast China (0.2935) > South China (0.2228) > Northwest China (0.2022) > Southwest China (0.1562) > East China (0.1308). The standard deviations of the CIR for each region were as follows: Northeast China (0.1562) > North China (0.1531) > Northwest China (0.0704) > Southwest China (0.0688) > Central China (0.0654) > South China (0.0394) > East China (0.0332). The Gini coefficient of North China fell from 0.2165 in 2012 to 0.5058 in 2023, with an average annual growth rate of 11.14%. This indicates that there are significant differences among different provinces within North China, and these differences have also changed significantly from year to year. This might be caused by the substantial disparities in economic and cultural development among different provinces within the region. Provinces such as Beijing and Tianjin in North China have strong comprehensive development, while provinces like Inner Mongolia and Shanxi have relatively slower development. East China, on the other hand, has been relatively stable overall, with coordinated urban development within the region. Provinces such as Shanghai, Jiangsu, Zhejiang and Shandong in East China have developed economies and cultural industries. This shows that the regional disparities within China have remained stable during the sample period. This indicates significant differences in the CIR levels within and among regions.
(3) The comparison results of these seven regions show significant inter-regional differences. This might be due to diverse variations in the economic foundation, cultural resources and population structure. The inter-regional Gini Coefficient of the CIR from 2012 to 2023 is shown in Table 8 and Figure 4. Among these 21 combinations. The inter-regional Gini Coefficient of North China-East China was 0.1151, that of Northeast China-East China was 0.1008, and that of North China-Central China was 0.0871, and these three inter-regional Gini Coefficient are ranked in the top three. The inter-regional Gini Coefficient of ranking last three were North China-Northeast China, Southwest China-Northwest China, and North China-Northwest China with. The coefficients of North China-Northwest China and Northeast China-Northwest China have maintained high levels. The CIR differences between the underdeveloped regions (Northwest China) and the developed regions (North and Northeast China) in the east have continued to widen. The coefficients between adjacent regions, such as East China and South China, are relatively low. The three regions with the largest standard deviations were North China-East China with 0.1326, Northeast China-East China with 0.1105, and North China-Central China with 0.0989. The three regions with the smallest standard deviations were North China-Northeast China (0.0210), Southwest China-Northwest China (0.0461), and Northeast China-Northwest China (0.0495). Regions such as East China and South China have formed cultural industrial clusters supported by capital and technology based on digital economy policies and possess an active innovation ecosystem. In contrast, Northwest China is constrained by its economic foundation and has undergone a slow transformation. Its development model is traditional, and its cultural industry is lagging behind, with serious homogeneity in cultural products. Furthermore, there are significant differences in the population structures. The developed eastern coastal provinces have a dense population and a large number of highly skilled workers.
(4) Inter-regional differences dominated the contribution of total CIR differences. Figure 5 shows the contribution rates of intra-regional, inter-regional and transvariation densities of the Gini coefficient of CIR. The average annual contribution from 2012 to 2023 was 19.34%, 70.43% and 20.23%, respectively. The source of the CIR differences was, to a greater extent, caused by inter-regional differences. While the contribution of intra-regional and transvariation density differences was relatively stable over the sample period, the contribution of hypervariable density was the smallest one. Therefore, to improve the overall CIR, it is crucial to focus on reducing inter-regional differences and strengthening the coordinated development of regions.
Average Dagum Gini Coefficient and Contribution Value.
Dagum Gini Coefficient and Contribution Value.

Intra-Regional Gini Coefficient.


Total and intra-regional Gini coefficient.
Inter-Regional Gini Coefficient.
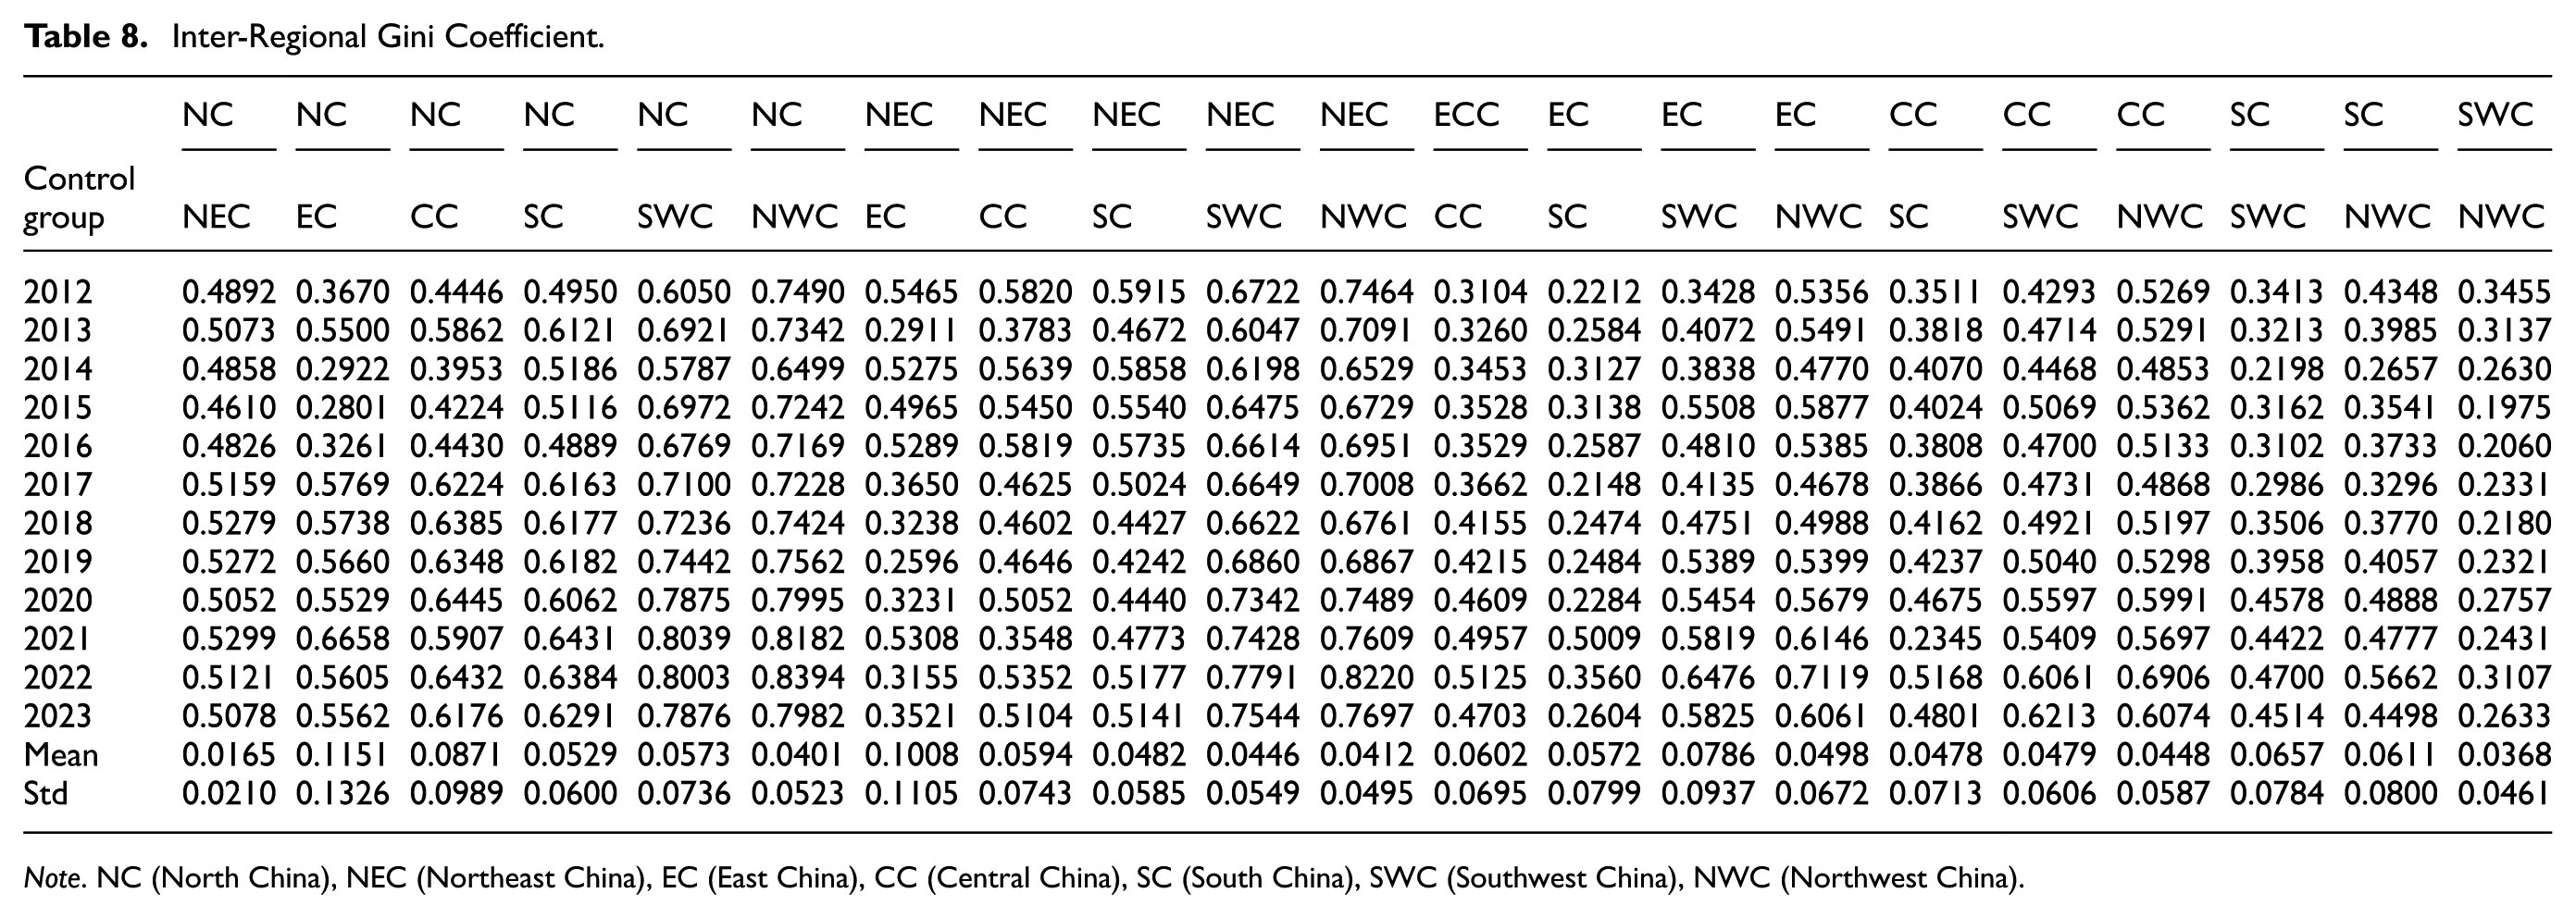
Note. NC (North China), NEC (Northeast China), EC (East China), CC (Central China), SC (South China), SWC (Southwest China), NWC (Northwest China).

Mean inter-regional Gini coefficient.

Annual contribution value of the differences.
Influencing Factors of the CIR
Descriptive statistics of the indicator data for the dependent, independent variables and control variables are shown in Table 9.
Descriptive Statistics of Influencing Factors.

Using Stata 18, panel regression analysis was conducted on the selected indicators to examine the degree of influence of the factors on the CIR. First, the variance inflation factor (VIF) was determined for the indicators, and the VIF values were all less than 7.11, with a mean VIF of 3.42 and R2 = 0. 7784, adjusted R2 = 0.7678, indicating that the influencing factors have a greater impact on the CIR. Here, F = 73.53, and Prob > F = 0.000, indicating that the model passed the test and was meaningful. In order to avoid possible pseudo-regression problems in the subsequent analysis, the LLC and IPS unit root tests are used to analyses whether the panel data are smooth or not. Two tests were conducted for each variable, and the p-values were all less than 0.05. Therefore, at the 5% significance level, the null hypothesis was rejected, indicating that the panel data represented a stationary process.
For the analysis of the panel regression model, the common models include the random panel model and fixed panel regression model. It is necessary to analyses the applicability of the model before empirical analysis through both the F-test and the Hausman test. The F-test yielded F (29, 285) = 62.26 with Prob > F = 0.0000, and the Hausman test resulted in χ2 (15) = 56.26 with Prob > χ2 = 0.0000. It shows a significant level of 5%, which means that the Fixed Effects (FE) model is superior to the Random Effects (RE) model.
This study employs a panel regression framework to investigate the determinants of CIR. Table 10 presents the regression results from four model specifications: (1) RE model without controlling for time or regional effects; (2) Regional Fixed Effect model incorporating provincial fixed effects; (3) Time Fixed Effect model accounting for year-specific variations; and (4) Bidirectional Fixed Effects model that jointly controls for both year and province. To address potential endogeneity issues, the GMM method was employed for the calculation, resulting in the AR (1) test yielding P = 0.010, the AR (2) test yielding P = 0.254, and the Sargan test yielding P = 0.145. This indicates that the dynamic panel design meets the theoretical requirements, the selection of instrumental variables is reasonable, and there are no endogeneity problems in the model.
Results of Model Regression.

Note. ***p<.01, **p<.05, *p<.10. The numbers in parentheses represent the z-statistic.
Among these four models, ED, EDU, TECH, GSL and PS are all demonstrated significant positive correlations with CIR, and RUG also showed a significant negative correlation in three of the models. Furthermore, the constant terms (_cons) in these four models were all statistically significant at the 1% level, and all four models passed the p-value test. Specifically, EDU, TECH, GSL and PS were significant at the 1% level across all four models, and ED was significant at the 1% level in three models and at the 10% level in the remaining model. All five variables exhibited significant positive correlations, indicating that higher levels of economic development, regional educational investment, regional technological investment, government support and population size are associated with a higher CIR. Conversely, RUG showed a significant negative correlation, suggesting that a larger rural-urban gap adversely affects the CIR, potentially due to the negative effects arising from unbalanced economic development. Therefore, it can be concluded that these six variables exert a significant impact on the regional CIR.
Analysis of the factors influencing China’s CIR shows that the levels of economic development, regional educational investment, technological investment, government support, population size and the urban-rural gap all have significant impacts on the CIR. Economic development serves as a fundamental guarantee for the CIR, providing essential support through capital accumulation, market expansion and the building of risk resistance. Educational investment strengthens the sustainability of the innovation ecosystem by supplying a talent pool and promoting the integration of industry, academia and research. Technological investment injects technical momentum into the cultural industry, driving innovation in business models and enhancing production efficiency. The integration of culture and technology has powerfully promoted the rapid development of new cultural formats. Government support, through policy guidance, financial subsidies, specialized planning, joint construction of infrastructure, and market regulation and management, creates an effective environment for the development of the cultural industry and effectively stimulates market vitality. Population size enhances the resilience of the cultural industry through multiple pathways such as reserving human resources, expanding market demand, and activating industry competition. The urban-rural gap has a significant negative impact on the CIR—the greater the gap, the weaker the CIR. In recent years, through the continuous efforts of the Chinese government, the income gap between urban and rural areas has gradually narrowed.
Discussion
Previous studies have mainly focused on economic or regional resilience (Boschma, 2015; Christopherson et al., 2010; Sutton et al., 2023). This study mainly focused on the temporal-spatial differences of CIR and its influencing factors in China. An index system was constructed to measure China’s CIR, and a temporal-spatial difference analysis was conducted for different regions and provinces. Panel regression analysis was used to examine the factors influencing CIR. This study established a comprehensive evaluation system across multiple time and space scales, measuring the dynamic evolution process of CIR. The main findings and the linking with literature are as showing follow:
(1) The spatial differentiation characteristics of the CIR and its growth in various provinces of China are remarkable. This finding is consistent with the results of Dai et al. (2018) regarding the spatial heterogeneity of the cultural industry. However, unlike Khlystova et al. (2022) who focused on the short-term fluctuations of cultural industry agglomeration, this study reveals the long-term dynamic evolution process of regional polarization. From 2012 to 2023, the CIR of the provinces showed a certain degree of improvement. The eastern coastal provinces, such as Guangdong, Jiangsu, Zhejiang, Beijing, Shanghai and Shandong, have consistently ranked at the top in terms of CIR and have shown strong growth. In contrast, the CIR of the central and western provinces, as well as border provinces such as Qinghai, Ningxia, Hainan, Gansu and Heilongjiang, have long been at the bottom and have shown slow growth. This has led to an increasingly prominent regional disparity in the CIR of China.
(2) Among the seven major regions of China, the CIR of East China and South China are the highest and are growing rapidly. The CIR in Northeastern China and Northwestern China is relatively weak, and economic growth is also relatively slow. East China is the region with the fastest economic development in China, and the economic development speed of the Yangtze River Delta in this region has always been higher than the national average level. South China is centered around Guangdong, and its CIR is much higher than that of other regions. The cultural industry development in Northeastern and Northwestern China has been relatively lagging. This finding is consistent with the viewpoint of Wang et al. (2024) regarding the role of digitization and economic agglomeration in promoting resilience. However, this study differs from those that attribute regional differences to industrial efficiency or agglomeration effects (Tao et al., 2019), and instead emphasizes the collaborative effect of cultural ecological maturity and regional innovation networks.
(3) The latitude of resistance, robustness and recovery at the regional and provincial levels shows the characteristics of imbalance among regions and provinces. The rankings of regions and provinces in terms of the three aspects were relatively stable. Guangdong in South China and Jiangsu in East China have the highest levels in all three aspects of CIR, ranking first and second, respectively. In addition, five other provinces, Beijing, Shanghai, Zhejiang, Shandong and Sichuan, also ranked within the top 10 in all three aspects. The rankings of Northwest China and Northeast China are relatively lower, mostly ranking after the 20th place. Previous studies have mostly measured resilience as a single-dimensional concept (Boschma, 2015; Christopherson et al., 2010). This study constructed a 3Rs multi-dimensional framework, revealing the path dependence of the differences in resilience dimensions.
(4) China’s CIR mainly presents a pattern of four echelons. Guangdong was in the first echelon. The second echelon comprises five economically advanced regions: Beijing, Shanghai, Jiangsu, Zhejiang and Shandong. Five traditional culture advanced regions that are Anhui, Fujian, Hubei, Hunan and Sichuan, form the third echelon. Most of the remaining provincial-level regions fall into the fourth echelon. Wang and Xie (2023) found that the development of China’s cultural industry exhibits “multiple gradients and strong polarization” in terms of temporal and spatial evolution. Guangdong stands out in the first gradient, demonstrating its comprehensive resilience in digital innovation and the cultural industry.
(5) The gap in the CIR among the seven regions has widened significantly, with inter-regional differences being the main cause, over the past 12 years. The Total Gini coefficient of the CIR in the seven regions has continuously increased from 0.4662 in 2012 to 0.5205 in 2023. In particular, the upward trend intensified in 2020, and the coefficient exceeded 0.5. The years of 2021 and 2022 saw rapid growth, which eased in 2023. Possibly due to the outbreak of the COVID-19 pandemic in 2020, the coefficient soared to 0.5042, with a year-on-year growth of 6.3%. The average annual contributions from 2012 to 2023 were 9.34%, 70.43% and 20.23%, respectively. Inter-regional differences dominated the contribution of total differences. This indicates that long-term structural differentiation is the main cause of the imbalance in resilience. The sudden crisis merely accelerated the expansion of existing differences (Hu et al., 2022), rather than creating new disparities.
(6) There are significant differences in the CIR within the seven regions with different Gini coefficients. The average Gini coefficient in Central China is the highest, and the CIR differences among the provinces in this region are relatively large. In contrast, the average Gini coefficient in East China is the lowest, and the standard deviation of the CIR is the smallest. The CIR of each province in this region is relatively stable, with smaller differences, and the gap has not widened in the past few years. The average Gini coefficient and standard deviation of the CIR in North China were relatively large, and the differences in the CIR among the provinces within this region were also large. Moreover, this gap has gradually increased in recent years. This supports the view that has been widely held in previous studies that the resilience differences in the eastern region are relatively small and more stable (K. Cheng, Wang, et al., 2024; Q. Zhang, Lin, et al., 2024), and it has revealed that the internal disparities within North China have been expanding in recent years.
(7) There are six factors that are the levels of economic development, regional educational investment, technological investment, government support, population size and urban-rural gap all have significant impacts on the CIR. According to the results of the panel regression model, it can be observed that the levels of economic development, regional educational investment, technological investment, government support, and population density can contribute to the enhancement of the CIR, while the urban-rural gap has a negative impact on the CIR. Unlike previous studies that identified influencing factors from perspectives such as the innovation of the cultural industry, the role of digitalization and crises, the structure of industrial clusters, cultural policies, and financial investment (Chou et al., 2025; Gohoungodji & Amara, 2023; Khlystova & Kalyuzhnova, 2023), this study conducts an analysis from the CIR perspective, which is helpful in uncovering the internal mechanism of cultural industries' resilience to risks.
Conclusion
Practical and Managerial Contributions
In recent years, the global cultural industry has shown trends of scale expansion, structural transformation and regional differentiation, with various challenges and opportunities coexisting. Developed countries such as the United States, Japan and South Korea leverage their advantages in cultural soft power to continuously export cultural products like Hollywood films, anime and games and K-pop, thus occupying a significant share of the global cultural market. As a country rich in cultural resources with a 5-thousand-year civilization, China has emerged in the context of globalization and digital transformation, forging a unique path for the development of its cultural industry. Drawing on its diverse cultural foundations, China has given rise to a series of phenomenal cultural IPs such as Black Myth: Wukong, and Nezha, promoting the cross-cultural dissemination of Eastern aesthetics. However, as a strategic industry in the knowledge economy era, the cultural industry needs to face numerous challenges such as technological revolutions, market fluctuations and cultural conflicts. The studies on CIR expands the theoretical framework of cultural economics by translating cultural soft power into measurable economic indicators. Through a combination of quantitative and qualitative methods, it reveals the cultural industry’s abilities to predict and prevent risks, resist shocks, and recover and develop when facing external impacts. Studying China’s CIR holds significant meaning for the inheritance and development of culture, and also provides valuable insights from the Chinese model for other countries around the world.
This study constructs a comprehensive analytical framework of China’s CIR and systematically reveals its spatial–temporal evolution and driving mechanisms from 2012 to 2023. Theoretically, this study expands the resilience framework by integrating the three dimensions of resistance, robustness and recovery into the study of cultural industry, thus bridging resilience theory and cultural industry. The study demonstrates that resilience is not a transient feature but a cumulative outcome shaped by economic, institutional and social foundations. Furthermore, the identification of multilevel disparities among regions establishes a new analytical paradigm for understanding spatial inequality in the context of cultural development.
Managerial Implications
The findings provide a good theoretical basis for managerial implications. To provide references for future policy-making and study, four perspectives are proposed:
(1) The government should build a coordinated development framework for the cultural industry at the national level. The central government should strengthen regional coordination strategies, optimize the spatial layout of the cultural industry with a “national chessboard” mindset, and actively promote the flow of resources, capital, technology and talent across the country’s cultural industry. Then, local government should establish an industrial chain division of labor featuring “innovation in the east—transformation in the central region—participation in the west”, and promote the shared development of distinctive cultural resources such as regional cultures, intangible cultural heritage, and revolutionary (red) culture among different regions. Each region across the country plays a different role within the cultural industry chain, sharing the achievements of cultural industry development. Meantime, central government and local governments focus on improving the CIR and reducing disparities in resilience among regions in order to achieve the overall high-quality development of China’s cultural industry. Meantime, it is essential to fully safeguard the copyright and ownership of local cultural resources, as well as to confirm copyright rights and conduct value assessments, thereby enhancing the cultural industry’s added value.
(2) Eastern coastal provinces should shoulder the responsibility of leading China’s cultural industry to digital transformation and global expansion. As the vanguard of China’s cultural industry, eastern coastal provinces should focus on the digital transformation of the cultural sector and advancement along the global value chain. They should actively leverage their economic and industrial strengths to serve as pioneers and role models, and lead Chinese culture onto the world stage. Efforts should be made to drive technological empowerment and upgrades to address issues of low efficiency in cultural resource utilization and low conversion rates in the cultural industry. By exporting technical standards, globalizing IP operations, and co-building industrial ecosystems, the Yangtze River Delta and the Pearl River Delta can be developed into two major cultural innovation hubs, thus promoting the development of other regions.
(3) Provinces with abundant cultural resources should activate the contemporary value of traditional assets. Provinces such as Sichuan and Henan should fully tap into their cultural resources to ensure effective transmission and in-depth exploration of their heritage. Harbin in Heilongjiang Province can develop ice and snow cultural tourism and Dunhuang in Gansu Province can promote desert music culture. In a word, the government should propose cultural innovation models that meet contemporary needs, align with social progress and development, and satisfy customer demand. This can be achieved by forming a virtuous cycle of “resource protection-innovative transformation-market feedback”, allowing traditional culture to flourish with new vitality in contemporary society.
(4) The government should promote the complementarity of different advantageous cultural resources, and explore innovative development paths for characteristic cultural industries in economically and culturally underdeveloped regions. Regions such as the Northwest and Northeast, are economically and culturally less developed, economic and cultural strength is generally weaker. There should be extensive collaboration with regions where the cultural industry is thriving, such as East and South China, which can take on the transferred cultural manufacturing segments from more developed provinces. For example, co-building post-production film and television bases with provinces like Zhejiang and Beijing or jointly establishing cultural industry parks with Shanghai and Guangdong. Through the complementarity of different advantageous cultural resources, these regions can capitalize on their local characteristics to create more distinctive cultural industry chains.
Limitations and Future Research
This study also had certain limitations. (1) The constructed indicator system of CIR is mainly based on China’s cultural industry for calculation. Due to differences in the definition, standards and statistical data of the cultural industry, this indicator system has applicability issues in different countries and regions. (2) Owing to the limitations of data acquisition, the data span from 2012 to 2023 selected in this study can reflect the development trend in the past decade, but a dynamic analysis over a longer time scale can more accurately capture the long-term patterns of changes in industry resilience. (3) The weights for calculating the CIR were determined using the entropy method, which may have the limitations of a single method. In the future, methods such as AHP, PCA, random forest and XGBoost can be combined for mutual verification.
The CIR at regional and provincial levels in China exhibits significant spatiotemporal differentiation, and a disparity are closely related to the developmental foundations of each province. Provinces with high resilience, such as Guangdong, Jiangsu, Zhejiang, Beijing and Shanghai, generally possess comprehensive advantages, including developed economies, well-established transportation and communication systems, high levels of economic openness, flourishing cultural and technological industries, abundant talent resources, and vibrant cultural consumption markets. Provinces with medium-to-high resilience, such as Anhui, Hubei, Hunan and Sichuan, may have slightly weaker economic strength but boast a profound cultural heritage: for example, Anhui blends Central Plains, Jiangnan and Huizhou cultures, with landmarks such as Mount Huangshan, Huizhou architecture, and Anhui opera; Hubei, as the core of Chu culture, is home to cultural sites like Yellow Crane Tower and the ancient city of Jingzhou. In contrast, provinces with low resilience, such as Gansu, Ningxia and Qinghai, generally face difficulties such as a single and lagging industrial structure, excessive reliance on traditional resource-based industries, low added value in the cultural industry, severe brain drain, and weak infrastructure. Therefore, in subsequent studies, more precise policy support and implementation pathways should be developed according to the characteristics of different regions.
This study conducted the calculation based on the CIR of China as a case study. In fact, the CIR plays a significant role and has an impact on the development of various countries. For instance, why can cultural industries such as Japanese animation, American movies, and Korean TV dramas continue to develop healthily and gain popularity worldwide despite the extremely tough international competition? This may be closely related to the CIR. Therefore, in subsequent studies, different countries or regions can be compared to increase the general applicability of the study. However, this could require the construction of an evaluation system based on the specific circumstances of each country and region.
Footnotes
Appendix 1: The Results of Cultural Industry Resilience
The resilience level of cultural industry in China, four regions and 30 provinces from 2012 to 2023 was measured by entropy method. The resilience scores are shown in Table A.
Appendix 2: Ward Cluster Analysis Results
Acknowledgements
All authors are responsible for the contents. Thanks a lot to the fundings. We sincerely thank the editor and reviewers for their thoughtful comments and guidance.
Author Note
Tong Wu: research interest is development and management of cultural and tourism resources.
Ruiying Sun: research interest is cultural economy.
Haiyin Yu: research interest is cultural economy.
Jian Yu: Research area: integration of culture and technology.
Ethical Considerations
This study does not involve any human subjects or animal testing in a clinical or biomedical context. According to institutional and national guidelines, formal ethical approval was not required for this type of study. Therefore, the study adheres to accepted ethical standards for social science research.
Author Contributions
Conceptualization and writing – original draft, J. Yu, R. Sun and T. Wu; methodology and data analysis, T. Wu, R. Sun and H. Yu; supervision and writing – review and editing, J. Yu and H. Yu, funding acquisition, J. Y. All authors read and approved the final manuscript.
Funding
The authors disclosed receipt of the following financial support for the research, authorship, and/or publication of this article: This study was financially supported by the Philosophy and Social Sciences Planning Project of Guizhou Province (Grant/Award Number: 24GZYB62), and Soft Science Research Project of Beijing Science and Technology Plan (#Z09031001590911).
Declaration of Conflicting Interests
The authors declared no conflicting interests with respect to the study.
Data Availability Statement
The data that support the results of this study are available from the corresponding author upon request.