
Abstract
Excessive emissions of greenhouse gases have exacerbated global climate change, and the use of fossil fuels is the main reason for the rapid rise of CO2 in the atmosphere. In this study, stochastic frontier analysis is employed to measure the causal relationship between GDP growth and fossil fuel use for CO2 inefficiency of APEC member economies. The empirical results revealed a significant positive correlation between them and found that member economies with a high per capita GDP, such as Singapore, effectively mitigate CO2 emissions. This result revealed that high income standards lead to emphasis on environmental protection. China and the United States are the top two CO2 emitters and should actively formulate carbon reduction strategies for economic development and energy utilization. This study calls for both developing and developed countries to gradually adopt and increase renewable energy and develop low-carbon technologies to reduce greenhouse gas emissions and jointly address the challenges of climate change.
Keywords
Introduction
Since the Industrial Revolution, machines have replaced manpower to accelerate the development of human economic activities. However, the large-scale use of fossil fuels (such as coal, oil, and natural gas) has led to the continuously increasing concentration of greenhouse gases (such as CO2, CH4, N2O, etc.) in the atmosphere and has caused climate change (Wu, 2020). The rapid increase in anthropogenic CO2 emissions is the main culprit behind global warming (Dong et al., 2020). Developed and industrialized countries such as the United States and China are major contributors to global CO2 emissions. Climate change is a long-term problem, and it is necessary to educate people and countries around the world and actively promote carbon reduction policies to mitigate climate change (Dong et al., 2020; Kessel & Tabuchi, 2019).
Several studies have reported that considerable CO2 emissions are caused by the increasing consumption of fossil fuels in developing and developed countries due to economic growth, and fossil fuel consumption is inseparable from CO2 emissions (Ramanathan, 2006). Every 1% increase in output in high-income countries, more carbon dioxide is emitted. Moreover, population size is also the main factor in the increase of CO2 emissions (Al Mamun et al., 2014). The growth of total global CO2 emissions is due to economic growth, contributing ∼72.5%, and population growth, contributing ∼18% (Dong et al., 2020; C.-H. Wang et al., 2020). The gross domestic product (GDP) can affect CO2 emissions. For example, CO2 emissions decreased after the financial crises in 1997 and 2008, but increased significantly immediately after global economic recovery, especially in developed countries (C.-H. Wang et al., 2020). The International Energy Agency (2022) reported that the COVID-19 pandemic reduced global CO2 emissions by 5.2% in 2020. However, a 6% increase in CO2 emissions in 2021 is in line with a 5.9% jump in global economic output, which was fueled by a rapid vaccine rollout and fiscal and monetary stimulus to motivate the economic rebound and energy demand. It also puts CO2 emissions in 2021 at ∼180 megatonnes (Mt) above pre-pandemic levels in 2019.
The economic growth and energy use have a very significant impact on CO2 emissions, while the ratio of CO2 emissions to GDP has recently been widely used to evaluate the carbon emissions performance of different countries (H. Wang et al., 2017; Zhao et al., 2017). The global energy consumption and carbon dioxide emissions increased by 2.0% each year from 1997 to 2015. In particular, developed countries contributed 82% of global CO2 emissions from fossil fuel combustion, of which China has the fastest growth in CO2 emissions (Dong et al., 2020). To sum up, economic development, GDP, population size, and consumption of fossil fuels are the main factors that increase CO2 emissions. However, the global public awareness of reducing CO2 emissions is constantly improving, and public opinion guides countries’ climate mitigation strategies toward positive actions, since climate change adaptation has become an environmental sustainability policy that countries must pay attention to in economic development.
The main two representative research methods to measure carbon emission efficiency are data envelopment analysis (DEA) and stochastic frontier analysis (SFA). DEA is a non-parametric method which can consider multiple input and multiple output items, and has a distribution pattern that does not require inefficient items. SFA is a parametric method that needs to construct a production function model, while DEA does not need to construct a specific function form, so DEA is most commonly used to measure carbon emission efficiency (Niu et al., 2022). DEA can be widely used to estimate the technical efficiency of “multiple inputs and multiple outputs,” but DEA ignores the fact that all random error terms are measured once because they are regarded as technical inefficiency factors that change over time, and have the disadvantage of being influenced by extreme values (Jin & Kim, 2019). SFA is the best method for efficiency measurement out of those widely used in “multiple input and single output” situations, as it can separate random errors from inefficiencies. SFA has the advantages that the interference of the error term on the efficiency value can be excluded, and the estimation mode can be statistically verified, and thus it can more accurately reflect the actual inefficiency. SFA has the advantages of frontier functions and is more suitable for the analysis of time-series data. In addition, SFA can explore the absolute efficiency and relationship between input impact factors and efficiency, and can add external environmental variables to analyze the impact between efficiency factors and environmental variables simultaneously (Wu, 2020).
In recent years, the following studies have used SFA to investigate carbon emissions. Sun et al. (2019) used SFA to explore the greenhouse gas emission efficiencies of 26 manufacturers and industries in China. Jin and Kim (2019) used SFA to explore the relationship between energy efficiency and carbon emission inefficiency in 21 emerging countries using traditional production factors, capital, labor, energy consumption, and GDP as variables. Niu et al. (2022) used SFA to explore the significant impact of finance on the carbon emission efficiency value of six major items, including the intensity of environmental protection, the level of economic development, the structure of enterprises, the level of urbanization, the degree of openness, and the degree of technological innovation.
The SFA estimation results use absolute efficiency, making it more stable than DEA. Moreover, SFA is more suitable for handling large differences in the scale of sample data, and is not easily affected by abnormal points that result in deviations between calculation results and actual conditions. The results of SFA will not be the same as those of DEA, where multiple decision-making unit (DMU) efficiency values are the same and equal to 1, which is more suitable for studying the trend of changes in CO2 emissions over a multi-year period.
In this study, fossil fuels are regarded as input items, which is different from conventional research, in which both CO2 emissions and GDP are regarded as output items. In addition, a CO2 emission inefficiency model is established by using CO2 emissions as a single output item and taking GDP and consumption of three fossil fuels (viz. oil, natural gas, coal) as input items to construct a stochastic frontier model. By using this model, the relationship and impact difference between CO2 emissions, GDP, and fossil fuels is explored, and further appropriate recommendations are made. This study uses Asia-Pacific Economic Cooperation (APEC) member economies as research samples to study the differences and changes in CO2 emissions caused by the GDP, population, and fossil fuel consumption of each member. This study expects that the research results can determine the main influencing factors of CO2 emissions and the inefficiency values among member economies, and suggest improvements and strategies for reference. We call on countries around the world to take into account climate change mitigation and adaptation while promoting economic development.
Methodology
Efficiency evaluation measures the operational performance of a decision-making unit (DMU) and the operational space that the DMU can improve. Efficiency measurement is the task of measuring the efficiency of input and output with the goal of maximum output or minimum input. Farrell (1957) was the first to discuss efficiency measurement. He cited the research of Debreu (1951) and Koopmans (1951) to define a simple efficiency measurement method that could handle multiple inputs. He defined the efficiency of a manufacturer as consisting of two parts: technical efficiency, which represents the ability of a manufacturer to achieve maximum output under a certain input combination, and allocative efficiency, which reflects the optimal input ratio of the manufacturer under the constant relative price. The two together can be used to measure the total economic efficiency of the manufacturer. Farrell (1957) proposed that the measurement of efficiency can use non-parametric or parametric methods, and Farrell’s efficiency measurement method has become the forerunner of frontier analysis (Coelli et al., 2005). Among the parametric methods, DEA is the most commonly used, while SFA is the most representative parametric method. Both methods are often used to estimate various production efficiencies. However, DEA can only consider the relative efficiency values among DMUs, and cannot distinguish the real pros and cons of DMUs whose efficiency values are all 1. SFA can analyze the mutual absolute efficiency between input items and output items, and it is not necessary to assume that manufacturers are efficient in advance, while regression analysis is used to analyze the absolute relationship and ranking of DMUs. There will not be a dilemma such as DEA being unable to distinguish efficiency values which are all 1 and the resulting inability to distinguish the real advantages and disadvantages of each. This is the main motive behind the use of SFA in this study to explore CO2 emission inefficiency.
SFA was originally a research method proposed by Aigner et al. (1977) and Meeusen and van den Broeck (1977). The main concept is to connect the most efficient input and output combination points of the enterprise to be evaluated into a production efficiency frontier, and it is believed that not all the evaluated enterprises are efficient, but that only those at the production point of the efficiency frontier have technology efficiency. There are two measures in SFA: output-oriented and input-oriented measures. In case of an output-oriented measure, SFA is an enterprise ability to make the maximum output, given its sets of inputs. On the other hand, in case of an input-oriented measure, the SFA measure reflects the degree to which an enterprise can reduce its inputs used in the production of the given outputs. In this study, an output-oriented measure is adopted. This study uses the Cobb–Douglas production frontier model of intertemporal continuous data proposed by Battese and Coelli (1988), and its form is shown in Equation 1.

Where, Yit denotes the ith DMU output at time t, Xit denotes the ith DMU input at time t, β denotes the coefficient of input for each of the production functions, and vit represents the symmetric interference term of the random variation of the production function. Here,
Data and Empirical Model
Samples and Data Sources
In this study, the first reason for primarily using APEC member economies is related to their rapid economic growth in recent years, and the second reason is related to the population of the 21 member economies of APEC, which is about 2.9 billion (38% of the world’s population); this population accounts for 60% of world’s GDP and 48% of the world’s trade (Asia-Pacific Economic Cooperation, 2022). Furthermore, the third reason is related to the more complete data about these regions. The rapid GDP growth and high fossil fuel consumption of these member economies in recent years meet requirements as the objectives of this study to investigate the relationship and impact on CO2 emissions.
The data for this study were obtained from the freely available data repository “Our World in Data” (2022). This study collected relevant data on 21 member economies of APEC between 2001 and 2020, including CO2 emissions, gross domestic product, oil consumption, gas consumption, coal consumption, and population. After screening and removing Brunei and Papua New Guinea, which have missing data, the 19 members with complete data were Australia (AUS), Canada (CAN), Chile (CHL), Hong Kong, China (Hong Kong, HKG), Indonesia (IDN), Japan (JPN), Republic of Korea (KOR), Malaysia (MYS), Mexico (MEX), New Zealand (NZL), Peru (PER), People’s Republic of China (CHN), Philippines (PHL), Russia (RUS), Singapore (SGP), Chinese Taipei (TWN), Thailand (THA), United States (USA), and Vietnam (VNM).
Variables
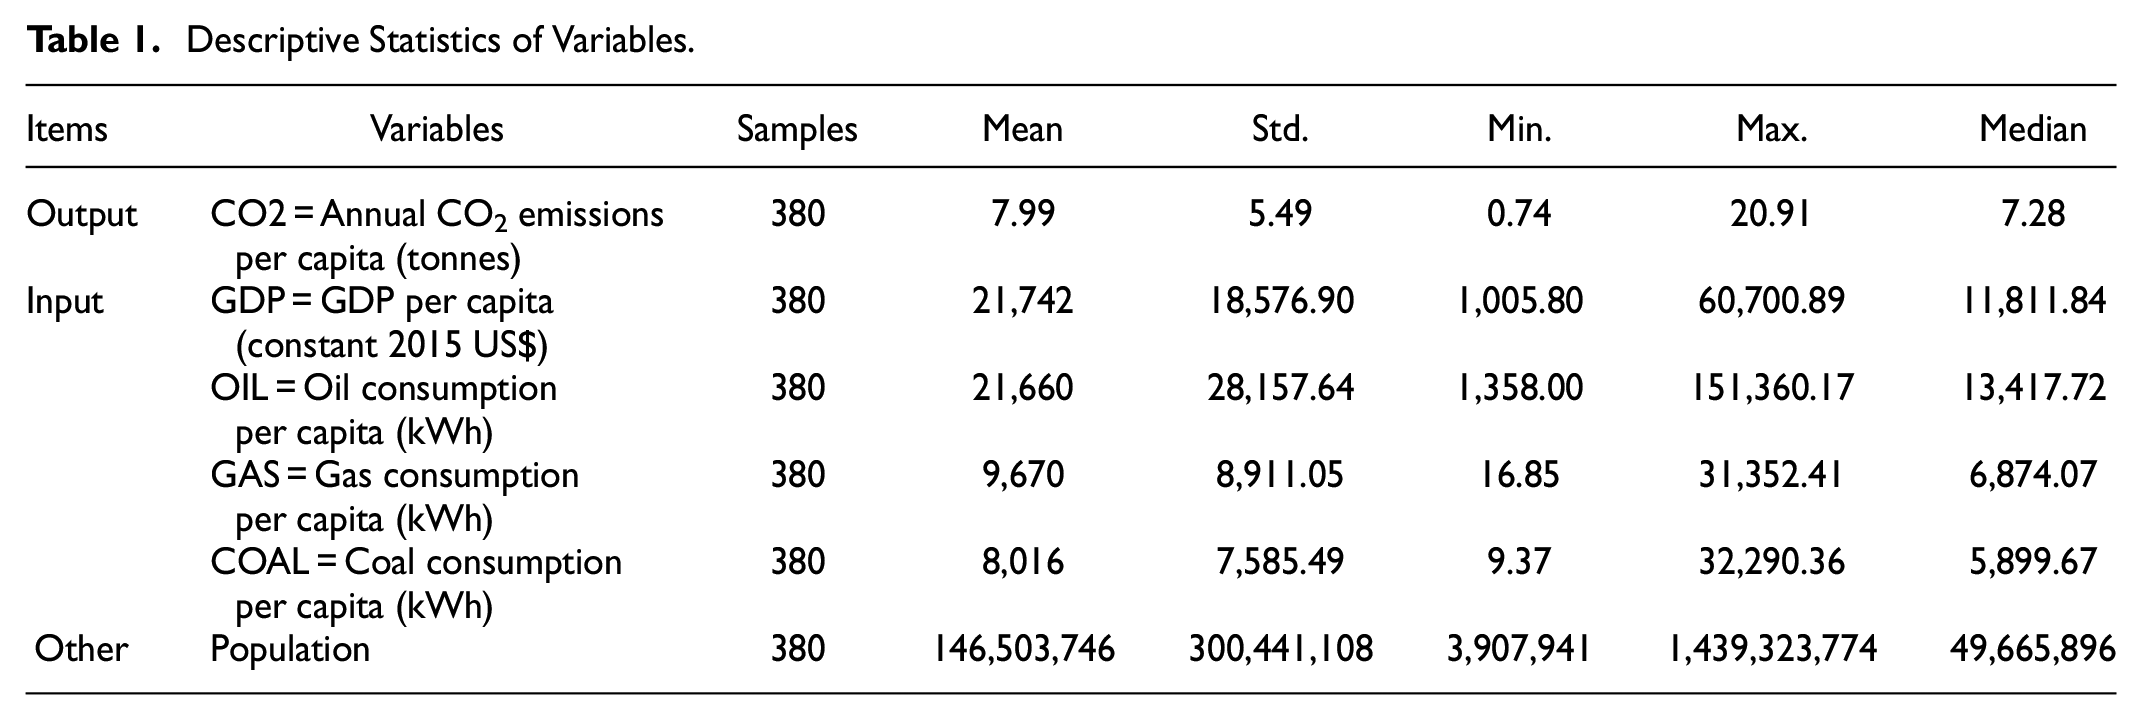
According to the economic development and CO2 emission characteristics of APEC member economies, this study selects the data of input and output items for efficiency analysis and discusses the relationship between CO2 emission inefficiency and influencing factors. It is expected that the research results can reduce and improve CO2 emission strategies. Because the aim is to explore the relationship between the economic development of each member economy and the inefficiency of fossil fuel consumption and its effect on CO2 emissions and the impact factors, one output factor is CO2 emissions (CO2) and four input factors are gross domestic product (GDP), oil consumption (OIL), gas consumption (GAS), and coal consumption (COAL). In order to maintain consistency of the data, the input and output items are divided by the population of the country, and the per capita value is used for analysis. Although previous studies have regarded GDP as an output factor, in this study it is theorized that the increase or decrease of GDP directly affects CO2 emissions, so GDP is regarded as an input factor. Furthermore, since the sample period is as long as 20 years, the price index of 2015 is used as the base period for conversion of deflators for the GDP. In addition, since the Industrial Revolution, most countries’ economic growth has also consumed a large amount of fossil fuels, and this directly emits a large amount of CO2. Although countries have hoped to reduce carbon emissions simultaneous with economic development, the results are limited. Therefore, the other three input factors are the annual consumption of oil, gas, and coal by each member economy. The consumption of these three fossil fuels directly increases the content of CO2 in the atmosphere.
In this study, a Cobb–Douglas stochastic frontier model was constructed to explore the relationship between CO2 emission inefficiency and influencing factors. The inefficiency value is between 0 and 1. If the value is closer to 1, then the output of CO2 emissions is higher, indicating that the member has higher CO2 emissions and poor emission control efficiency, which can be defined as inefficient. This study uses SFA to explore the differences in CO2 emission inefficiency among APEC members, and analyzes the relationship between their regulatory effectiveness and impact factors in reducing carbon emissions during economic development in recent years. The statistics of the variables in this study are shown in Table 1.
Descriptive Statistics of Variables.
Empirical Model
This study measures the inefficiency indexes of nineteen APEC member economies (DMU) based on the Cobb–Douglas stochastic frontier model proposed by Aigner et al. (1977) and Battese and Coelli (1988). The output term (CO2) and input terms (GDP, OIL, GAS, COAL) of the DMU are substituted in Equation 1, which can be converted to Equation 2. The empirical model is as shown in Equation 2. Estimations were made using Frontier Version 4.1 computer software freely available from Coelli (1996).
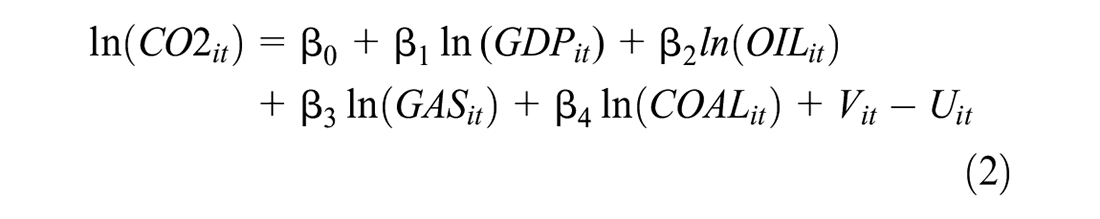
Where, i is the member code, where i = 1, 2, …, N; t is the time, where t = 1, 2, …, T; Vit − Uit is the composite error, which is a combination of random shock and production inefficiency; Vit is the random error term of DMU i’s bilateral allocation in period t; and Uit is the inefficiency factor of DUM i’s unilateral allocation in period t and is a non-negative truncated normative allocation.
Results and Discussion
The SFA estimation results in Table 2 and Figure 1 show the average annual inefficiency values for CO2 emissions of each member economy from 2001 to 2020. The overall average inefficiency value was 0.45, indicating poor overall efficiency. The top five members ranked by inefficiency value during the 20-year sample period are China (0.97), Russia (0.84), Australia (0.63), Chinese Taipei (0.54), and Malaysia (0.53). The results show that these five member economies still have great room for improvement and should focus on reducing CO2 emissions. The results in Table 2 and Figure 1 show that the top three members with the best CO2 emission efficiency values are Singapore (0.14), Hong Kong (0.22), and Peru (0.25), respectively. The average annual CO2 emissions of APEC member economies in Figure 2 are listed in descending order as China, United States, Russia, Japan, Korea, and Canada, which is similar to the average annual fossil fuel consumptions of each member, as shown in Figure 3.
Estimates of the Average Annual Inefficiencies of SFA for Per Member.


Average annual inefficiency values for CO2 emissions by member.
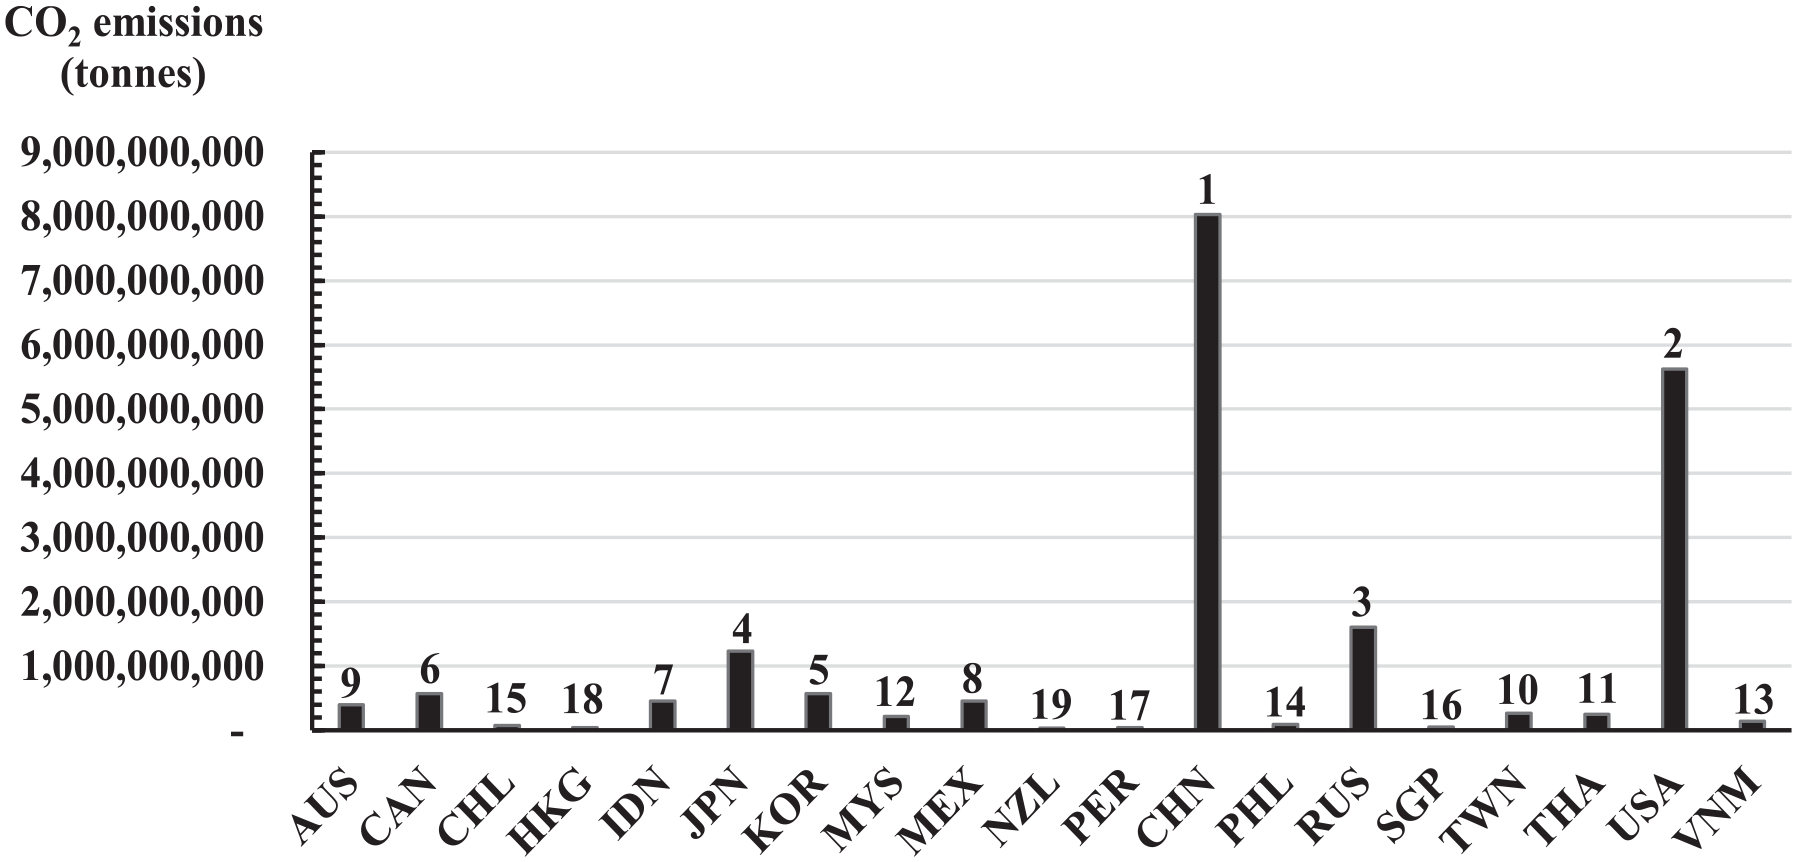
Average annual CO2 emissions by member.

Average annual fossil fuel consumption by member.
CO2 emissions originating from the use and combustion of different fossil fuels (viz. oil, natural gas, and coal) vary. In general, the highest CO2 emission coefficient is obtained for the combustion of coal, followed by oil and natural gas. As can be observed in Figures 2 and 3, slight differences in terms of the CO2 emissions and fossil fuel consumption of each member economy are observed, and the highest differences in the fossil fuel consumption are observed for members ranked from 1 to 6. Hence, the ranking of the top 6 is identical. However, the difference changes after ranking 7 is mainly related to the similar difference in the fossil fuel consumption of each member, resulting in a slight change in the ranking. In recent years, China has become the world’s largest CO2 emitter, followed by the United States. As can be observed in Figure 3, the average annual fossil fuel consumption of China and the United States is 3.7 times and 3.2 times that of Russia, which is ranked the third highest emitter, also accounting for 33.95% and 29.44% of the total consumption of the 19 research member economies, respectively. As can be observed in Figure 3, the consumption of coal of each member economy is mostly less than that of oil and natural gas, but China’s coal demand is relatively high, which may be one of the main factors for the soaring total CO2 emissions of China. In recent years, member economies have been reducing coal consumption and are researching carbon capture and storage (CCS) technologies to reduce CO2 emissions. However, coal-fired power generation is still the main source of electricity for countries worldwide. In addition, developing and developed countries also produce more CO2 emissions due to higher energy demands, as well as industrial and transportation demands. The contribution of each unit of renewable energy to reduce CO2 emissions is approximately half that of fossil energy consumption (Bölük & Mert, 2014). This study suggests that members should gradually switch to and increase the use of green energy to replace the use of fossil energy to reduce CO2 emissions.
As shown in Figure 4, the ratios of CO2 emissions to GDP per capita (tonnes/US$) are higher. The top six are Russia (1.301), China (0.981), Vietnam (0.917), Malaysia (0.855), Thailand (0.708), and Chinese Taipei (0.569). From Figures 2 to 4, it can be seen that the CO2 emission data of APEC members are similar to the inefficiency values of the results of this study. In the data in Figure 4, Vietnam’s average annual GDP per capita is only US$1,742.8, which is 8% of the average of US$21,742 for other members, and the average annual CO2 emissions per capita is only 1.599 tonnes, which is 20% of the average of 7.99 tonnes. This may be the factor causing the larger ratio. In addition, Australia is 2.47 times higher than the average, owing to its higher GDP per capita of US$53,720, but its annual average of CO2 emissions is 17.933 tonnes. This is second only to the United States at 18.271 tonnes, which is also higher than the average by 2.24 times, thus reducing its ratio. In addition, member economies with higher per capita GDP exhibit a decreasing trend of CO2 emissions, indicating that higher income levels lead to increased attention and improvement of environmental protection. Furthermore, from the ratio of the average annual fossil fuel consumption to GDP of each member shown in Figure 5, the results are mostly similar to those in Figure 4. One exception is that Singapore has higher use of fossil fuels but lower CO2 emissions, possibly because the economic development of Singapore is dominated by advanced manufacturing industries such as finance, services, energy and chemical engineering, and electronic precision engineering, and there are fewer heavily polluting industries. This study suggests that members with a high ratio of CO2 emissions to per capita GDP, such as Russia, China, Vietnam, and Malaysia, etc., can gradually adjust the existing energy structure in stages and use renewable energy and low-carbon energy to reduce carbon emissions to achieve the goal of sustainable economic and sustainable environmental development.

Ratios of the average annual CO2 emissions to GDP of each member.

Ratios of the average annual consumptions of fossil fuels to GDP by member.
In this study, the SFA was estimated using the maximum likelihood estimation (MLE), as shown in Table 3. Table 3 shows that input GDP and oil consumption (OIL) have a very significant positive correlation with the inefficiency index for the CO2 emissions (CO2) output factor, while gas consumption (GAS) has a significant positive correlation. This result shows that the level of GDP does have a direct impact on CO2 emissions, and it also shows that to reduce carbon emissions, the consumption of oil and natural gas should be reduced. In addition, the estimated value of oil consumption (Estimate = 0.49754) is found to be the highest in the consumption of fossil fuels, which indicates that it is the most effective method to actively reduce the consumption of oil to reduce CO2 emissions. The estimated value of GDP (Estimate = 0.24761) is the second highest, which shows that GDP has a very significant impact on CO2 emissions. In this study, a bidirectional causal relationship between CO2 emissions and GDP growth and between CO2 emissions and fossil fuel use is observed. The results of this study are consistent with the results of Zhao et al. (2017), Dong et al. (2020), and C.-H. Wang et al. (2020), who pointed out that the increase or decrease of GDP and the consumption of fossil fuels will affect CO2 emissions. This study suggests that countries around the world should also take into account the reduction of carbon emissions in order to slow down the trend of global warming in the process of economic development.
Estimates of the Stochastic Frontier Function.
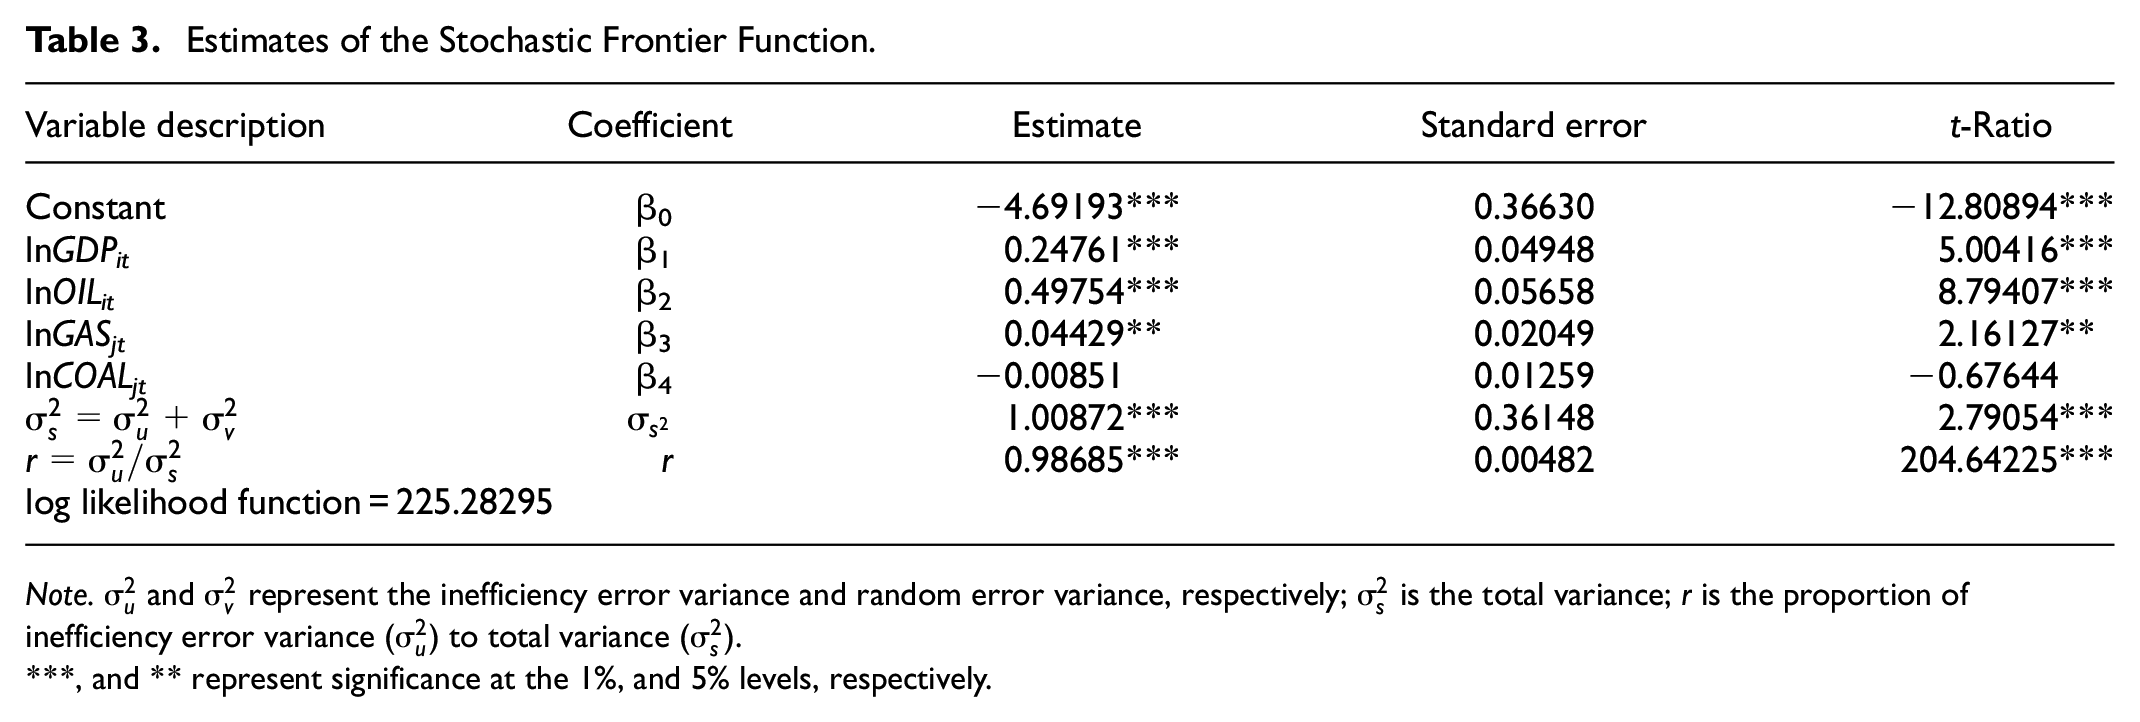
Note.
, and ** represent significance at the 1%, and 5% levels, respectively.
Conclusions
This study used SFA to explore the relationship between CO2 emission inefficiency and impact factors in 19 APEC member economies for a total of 20 years from 2001 to 2020. In this study, a significant positive correlation between CO2 emissions and GDP growth and between CO2 emissions and fossil fuel use is observed. The overall average inefficiency value of CO2 emissions for APEC member economies is 0.45, and there is still considerable room for improvement in most member economies. Research revealed that China and the United States are the top two CO2 emitters. Although the total consumption of fossil fuels in these countries is similar, China’s high coal demand has led to soaring total CO2 emissions, which is 1.43 times that of the United States. This study suggests that China should actively develop renewable energy to reduce coal consumption with the highest CO2 emission coefficient, which can effectively and rapidly reduce the total CO2 emissions. Moreover, Singapore exhibits the best CO2 emission efficiency, and most APEC member economies use less coal than oil and gas. Furthermore, member economies with a higher per capita GDP exhibit a lower trend in CO2 emissions, possibly resulting from the attention and improvement of environmental protection of member economies with higher income levels. In addition, this study suggested that members with a high ratio of CO2 emissions to per capita GDP can gradually adjust the existing energy structure in stages, reduce the use ratio of fossil fuels, and use renewable energy and low-carbon energy to reduce carbon emissions to achieve the goal of sustainable economic and sustainable environmental development.
China and the United States are the two major contributors to global CO2 emissions, indicating that these two countries must actively participate in discussions and perform actions for tackling climate change in any form to reduce CO2 emissions. Of course, countries worldwide should also make considerably efforts to reduce their use of fossil fuels and adjust the energy structure. These efforts should be continued to satisfy the Paris Agreement’s goal of limiting the global temperature increase to 1.5°C and measures, such as phasing out coal use and forest protection. Global warming is a long-term problem. The approaches to reduce carbon emissions and use of carbon capture technology to achieve net zero emissions for the purpose of mitigating and adapting to climate change have become a common global policy and goal.
This study suggests that the world should actively promote green energy to reduce greenhouse gas emissions. The results of this study once again show that, while pursuing economic development and using fossil fuels, the world should reduce greenhouse gas emissions and promote green energy and carbon reduction policies at the same time, so as to work together to face the challenges of climate change.
The results of this study can provide APEC member economies with information, which also can be applied to other countries, to understand that CO2 emissions are significantly positively correlated with GDP growth and fossil fuel consumption. In addition, the excess use of coal will result in higher CO2 emissions. Hence, the results suggest that the use of renewable energy should be gradually increased to replace fossil fuels. In addition, various methods for further research in this field are provided. From an academic viewpoint, of relevant data on the development of renewable energy and carbon capture technology in various countries can be obtained in the future, these key variables can be added to examine the correlation and difference with carbon emissions. The study results are thought to be extended to include other countries and speculate on the effectiveness of the future development of renewable energy.
Footnotes
Acknowledgements
The free software “Frontier Version 4.1” can be used to estimate the equations, which was kindly provided by Professor Coelli (1996).
Declaration of Conflicting Interests
The author declared no potential conflicts of interest with respect to the research, authorship, and/or publication of this article.
Funding
The author received no financial support for the research, authorship, and/or publication of this article.
Ethical Statement
This article does not contain any studies with human participants or animals performed by any of the authors.