
Abstract
To probe into consumer behavior from the perspective of cognition and emotion, meanwhile offering objective and quantitative physiological evidence for advertisers, e-commerce platforms selling experiential products, and other e-commerce platforms for holiday promotional activities. This paper adopted a combination of multi-channel physiometer and questionnaire survey, in which a total of 42 subjects including 18 men and 24 women is selected and recruited. (1) Factors such as promotion, music background, and model backdrop help to enhance the festive atmosphere of e-commerce platforms and stimulate positive emotions of consumers; (2) Greeting cards can stimulate positive emotions among female consumers, but they are not statistically significant in stimulating male consumers; (3) The effect of warm and cold colors on the sympathetic nerves of consumers is significant, among which warm colors can significantly ignite the positive emotions; and (4) Although not all indicators of multi-channel physiometer are consistent with questionnaire data, the differences can be explained, so it proves to be a sound method to quantitatively measure emotions. This paper conducted multi-channel physiometer research on E-commerce platform promotions and consumer behaviors from the perspective of cognition and emotion, which provided an objective quantitative method for online retailers and marketers.
Introduction
With the development of the Internet and e-commerce platforms, vertical e-commerce platforms are also developing rapidly and the competition is very fierce (Wengler et al., 2021). Take the vertical e-commerce platforms of flowers as an example, they are not only competing with other flower e-commerce platforms, but are also being strongly pressured by comprehensive e-commerce platforms. Promotional activities are proved to be an effective strategy for e-commerce platforms to compete for consumer traffic and convert new visitors into loyal consumers (Oklander & Kudina, 2021). Some sellers do not even intend to profit from promotional activities, but only to attract customers to boost the traffic and look forward to the second purchases (Edelman et al., 2016). In China, huge traffic is generated in Tmall’s “Double 11” and JingDong’s “6.18” and other promotional activities every year. Platforms and the sellers on it ramped up marketing campaigns to scramble for traffic, meanwhile, they manage to create a promotional atmosphere to boost sales conversion rates.
Compared with the promotion of other products, the promotion of experiential products like flowers is quite distinctive. First, purchasing flowers is mainly for the consumption scenes of ceremonies and festivals, which has a natural connection with product promotional activities (Oh & Kwon, 2009). Secondly, flowers are non-necessities of life with certain recreational characteristics. The pricing strategy of the flowers, the festive atmosphere, the purchase purposes (for gifts or themselves) is all factors influencing the behavior of the flower consumers. Finally, flowers are experiential products, consumers’ sensory experience is decisive to their purchasing decisions. It is an enormous challenge for e-commerce platforms to provide a superior experience to flower consumers. Although there are many fruitful studies on consumers’ purchase decisions, the marketing strategies of e-commerce, and platforms’ promotional activities, most of them are based on attention (Graham et al., 2018), and mainly focus on bottom-up visual attention stimulation (Y. T. Huang, 2018), which is often not satisfactory and results in excessive stimulus. Contextual promotion is considered more efficient and friendly (Salido Ortega et al., 2020), but this approach is relatively passive. This paper studied the promotional activities of online flower platform from the perspective of consumer cognition and emotions. Through consumers’ visual cognition and visual behavior of different flower presentation factor, it delves into the emotional experience of consumers when they shop flowers online, thus enabling consumers to have more pleasant experience in their buying behaviors, this method is considered sustainable (Volo, 2021).
Theoretical Background and Hypotheses Development
Theoretical Framework of Consumer Cognition and Emotions
Consumer choices, affective, motivational processes, and other issues have been solved by cognitive science as they can all be explained by cognition-related theories (Bartels & Johnson, 2015). Chater (2015) based on consumer cognition principles, the design of products and environments are leveraged to promote consumer choices and purchasing decisions. Moreover, it is believed that these studies of cognition may transform traditional behavioral economics into cognitive economics. Among them, economics puts emphasis on issues at the macro level such as social calculation, while cognition focuses on physiological measurement at the micro-level within individuals. Due to differences in product perception and subjective experience between sellers and consumers, failing to quantitatively measure consumers’ cognition and emotion would be a potential danger for sellers (Fu et al., 2019; Luu, 2021). Similarly, Consumer neuroscience is also considered an extremely promising and effective research field and thus employed by sellers and marketers as a scientific approach to analyze and understand consumer behaviors (Hsu & Chen, 2020). From the perspective of cognitive and emotional mechanisms, there is a reasoning system in the human brain that guides the appraisal system of the brain through directing attention, and these two systems output emotional experience together. Therefore, consumer behavior is regarded as an emotional experience (Hirschman & Holbrook, 1982), and emotions affect consumers’ attitudes toward purchasing decisions (Perugini & Bagozzi, 2001, 2004). Studying cognition and emotions can help sellers gain insights into consumers, thereby increasing return on investment, sales scale, and velocity (Senior & Lee, 2008).
Emotions are human affective states composed of responses to external environmental stimuli (Picard et al., 2001). Todd et al. (2020) demonstrated that emotional representations output cognitive processes as a unified emotion, which is expressed through facial expressions (Lee et al., 2014), behaviors (Martini et al., 2012), and physiological indicators (Borghini et al., 2014; Cannon et al., 2012). Based on the Stimulus-Organism-Response (S-O-R) model (Mehrabian & Russell, 1974), positive emotions are proved by many studies to have a significant relationship with patronage intention (Oliver et al., 1997), preference (Rosen & Purinton, 2004), and approach (Mo et al., 2021; Orth & Wirtz, 2014). Zhang (2021) utilizes the correlation between consumer physiological indicators and satisfaction to level off the cognitive and emotional differences between corporate designers and consumers, through which a human machine interface system and its appraisal mechanism have been established. Saintives (2020) discovered that there is still a lack of research on consumer emotions in online shopping, pointing out that most of the studies in this field still rely on the S-O-R model, this paper also used the S-O-R model as the theoretical framework for this study. In addition, multiple studies have revealed that the emotions of online shopping are different from those of in-store shopping (Brunner-Sperdin et al., 2014; Mo et al., 2022; Tupikovskaja-Omovie & Tyler, 2020; Yin et al., 2013). The research by Hult et al. (2019) also supports the interaction between online and offline shopping and customer perceived value, which also affects consumer satisfaction. As such, it is of paramount importance to further delve into the emotions of online consumers.
Cognition and Emotions of Online Promotion
Different emotions are key influencers of the generation of self-motivation and preferences of decision-making (Damasio, 2001). Negative emotions, such as the guilt of online shopping, will affect consumer purchasing behavior. Compared with in-store shopping, online shopping is more likely to trigger customers’ impulse purchasing behavior, hence causing negative guilt (Pricopoaia et al., 2020; Uzarska et al., 2021). Relatively speaking, the guilt of online shopping for utilitarian products is lower than that for hedonic products such as flowers. That aside, this guilt is mitigated due to the act of giving presents (Lee-Wingate & Corfman, 2010), promotions (Matherly et al., 2019; Okada, 2005) and other factors, as consumers will regard such products as practical and necessary. Therefore, creating an atmosphere of promotional activities on an online flower platform can make people feel less guilty.
In the study on the influence of the content composition and slot location of online advertisements on the visual attention of online consumers, it is found that regardless of whether the text advertisement contains pictures or not, the attention people paid to advertisements with discount information is significantly higher than that on advertisements without discount information (Y. T. Huang, 2018). Hyun (2021) held that the presentation of promotional information on in-store or e-commerce platforms and the products corresponding to the promotion drive consumers’ buying behavior, especially in the festive environment, where consumers are more sensitive to product promotion information. Das et al. (2020) argued that holiday promotions are usually carried out in the form of presenting high arousal stimuli (e.g., background music, background colors) to online consumers. Based on the findings from the above literature, this paper proposes the following hypotheses about experiential products and consumer behaviors from a cognitive and emotional perspective.
H1: Online experiential products containing promotional elements are more likely to arouse consumers’ positive emotions.
H2: When online consumers browse experiential products, presenting background music and other factors with a festive promotional atmosphere is more likely to arouse consumers’ positive emotions.
Cognition and Emotions of Experiential Products
Unlike searchable products, whose quality mainly depends on objective attributes that are easily acquired and perceived by consumers, such as the CPU performance and memory capacity of electronic products (Nelson, 1970), online flowers are experiential products. When consumers browse the products on e-commerce platform, their perceived value mainly hinges on their subjective experience (J. Huang et al., 2019). Experience attributes determine the perceived quality of experiential products (Mudambi & Schuff, 2010). Since online experiential products lack objective attribute standards and on-site experience, how consumers judge and view these products rely more on their subjective experience (Liu et al., 2020). Under such circumstances, the online perceived value of experiential products is vital to consumers. The higher the perceived value, the more positive the consumer’s positive emotions toward the products (Vries-van, 2006). Aakko and Niinimäki (2021) stated that the visual esthetic factors of online products (e.g., background pictures, product usage scenarios, etc.) are highly essential elements based on which customers assess products’ quality, and their importance even exceeds products’ functional requirements.
Fortin and Dholakia (2005) dug into consumer behavior and intentions through product usage scenarios in advertisements, discovering that the closer the products in advertisements are to life usage scenarios, the more positive the consumers’ emotions can be aroused. And this kind of close-to-real experience is more attractive to consumers so that they will feel less guilty (Hoch, 2002). Hassanein and Head (2007) studied consumers’ perceived value according to the theory of planned behavior model and found that warm and harmonious product descriptions and pictures are more likely to stimulate intimate emotions and the trust of consumers. Elder and Krishna (2012) concluded that when a model wears advertising clothing, it will provide consumers with hints about the scenarios, thus making the product more persuasive through psychological simulation.
H3: The pictures of the actual flower usage scenarios are more likely to arouse consumers’ sense of experience and positive emotions.
When buying flowers online for gifting others, there is an obvious difference between buying flowers online and in-store, that is, buying flowers online lacks the gift-giving process. Presenting flowers in person is a critical part of flower purchase for ceremonial purposes. This paper proposes that gifting flowers with greeting card will make up for this gap and enhance the sense of ceremony. Studies by Liu et al. (2020) indicate that the text description of online products will interact with product types, thereby affecting consumer emotions and attitudes. However, there is no literature on whether greeting cards with text description has a similar effect, so this paper will investigate this issue.
H4: In the ceremonial purchase scene, gifting flowers with greeting card can add to the sense of ceremony and evoke the positive emotional experience of customers.
Methodology
Emotions and Experiments Based on Multi-Channel Physiometer
There are various ways to measure emotions. This paper mainly measures the emotional valence of subjects stimulated by festivals and promotional factors, which can be accomplished using a multi-channel physiometer to measure the subjects’ heart rate indicators. As the heart rate signal is directly regulated by the autonomic nervous system (ANS), while being innervated by sympathetic nerves and parasympathetic nerves, this method is particularly useful for identifying positive and negative emotions (Codispoti et al., 2008). The heart rate indicators collected and analyzed in this experiment is mean heart rate (Mean HR) indicator. Although there’s been a consensus on using heart rate as an indicator of ANS to interpret emotions (Clamor et al., 2020), whether heart rate indicators can be used to explain positive or negative emotions is still a debatable point. Some studies have shown that the heart rate slow down means negative emotions, yet some have reached the opposite conclusion (Norman et al., 2014). Therefore, this paper adopts a combination of multi-channel physiometer experiment and questionnaire survey, in which the questionnaire data is used as a reference to determine whether the heart rate indicators stimulate the subjects’ positive or negative emotions.
The multi-channel physiometer used in this experiment has two parts: hardware and software. The hardware part is the BIOPAC (MP160) multi-channel physiometer, and the software part is Acqknowledge5.0. The experiment was carried out in a soundproofed laboratory at a suitable temperature, where the environment was kept highly consistent. A total of 42 valid subjects were selected and recruited in the experiment, including 18 men and 24 women. This paper mainly used paired-samples t-test for data analysis, according to the calculation, about 30 samples can meet the sample size requirements needed for the experiments in this paper. Therefore, the data from 42 subjects were able to meet the sample size required for this study (Becker & Jaakkola, 2020; Lin & Yang, 2009). In addition, all subjects have more than 3 years of online shopping experience, with the age of 18 to 25 and in good condition before the experiment. The electrocardiogram results of each valid subject were normal and recorded, all subjects completed a corresponding questionnaire after the experiment. Data from both the questionnaire and the experiment were used for analysis and discussion.
Experiment 1/Hypothesis 1 (E1/H1): Promotional Factors
Materials
The experimental material is shown in Figure 1, both pictures are identical in terms of information except for the design of the price. This was a single-factor two-level (with and without promotional factor) within-subjects experiment. The experiment process is as follows: First, the subjects were presented with a product interface without a promotional factor, with a price tag of 399 RMB. After a 5-second break, they were presented with a product interface with a promotional factor while other information remaining unchanged, for which the price is still 399 RMB. To avoid sequence effects, when the next subject was tested, the order of the pictures was reversed. Such a counterbalancing procedure was repeated in the rest of the subjects.

A comparison of pictures with and without promotional factor.
After completing the stimulus for each picture, the subjects were asked to answer a questionnaire on the current stimulus picture. The options of the questionnaire include extremely attractive, somewhat attractive, neutral, somewhat unattractive, extremely unattractive.
Results and Analysis
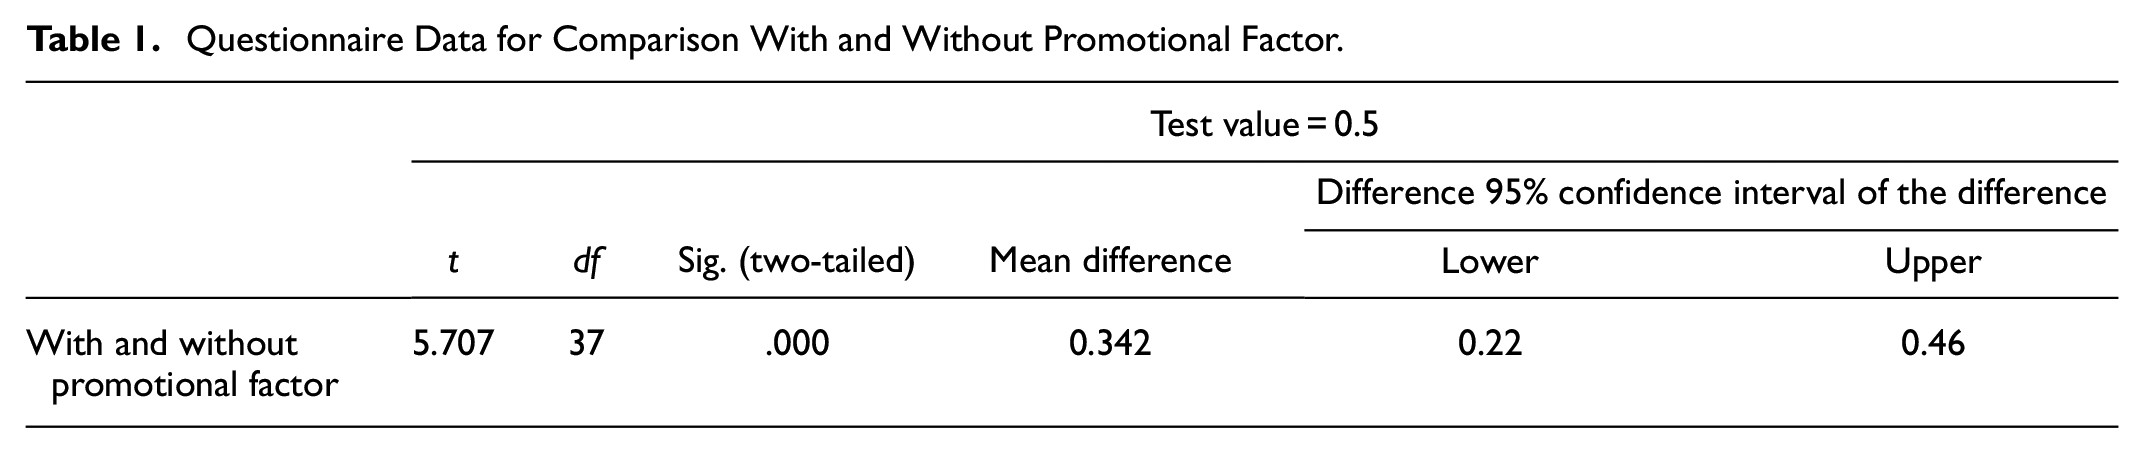
A paired-sample t-test was used to analyze the questionnaire data, and the results are shown in Table 1. Assigned a value of 0 for the design without the promotional factor and 1 for that with the promotional factor, set the test value to 0.5, and compared them in a one-sample t-test. The results indicate that there is a significant difference in questionnaire data between the design with and without the promotional factor, t = 5.707, p = .000, and their mean is significantly higher than 0.5.
Questionnaire Data for Comparison With and Without Promotional Factor.
A paired-sample t-test was used to analyze the heart rate indicator, the data was expressed in the form of M ± SD (Mean ± Standard Deviation). The Mean HR indicator with promotional factor of subjects is 80.94403 ± 10.370545, while the Mean HR indicator without promotional factor of subjects is 82.88600 ± 10.213175. The results of paired-sample t-test are shown in Table 2. It can be observed that there is a significant difference in the Mean HR indicator between the design with and without the promotional factor, t = 2.829, p = .007. Compared with the design without the promotional factor, the mean heart rate of the design with the promotional factor is lower.
Results of Mean HR With and Without Promotional Factor.

From the questionnaire data, it can be inferred that the subjects exhibited more positive emotions toward the product with the promotional factor. The heart rate indicator showed that the average heart rate with the presence of the promotional factor was lower, comparing these two sets of data comprehensively, we obtained a conclusion from this study that subjects are in a state of positive emotion when their heart rate slow down, this conclusion is a good addition to the study of Norman et al. (2014). Thus, the promotional factor is more likely to arouse the positive emotions of the subjects.
Therefore, the product design of promotional factor can not only enhance the festival and promotion atmosphere of the e-commerce platform, but also increase consumers’ positive emotions and attitudes toward the products, and reduce consumers’ guilt of online shopping, as it enables the consumers to feel practical and necessary (Matherly et al., 2019; Okada, 2005), thus H1 is supported. Regarding the gender factors of the subjects, neither the questionnaire data (p = .711) nor the heart rate indicator (p = .757) showed significant differences.
E2/H2: Background Music Factor
Materials
The stimulus materials of the experiment were two product pictures randomly selected from a flower e-commerce platform. To control the experimental variables, the pictures of flowers with and without the background music (hereinafter referred to as “BGM”) were the same, and light music that matches the style of flowers was chosen as the BGM. The experiment adopted a single-factor two-level (with and without BGM) within-subjects design. The subjects were asked to look at two pictures of flowers as shown in Figure 2 without BGM and reported the subjective preference for the flowers. After a 5-second break, they were presented with the same two pictures of flowers as shown in Figure 2 with BGM and reported the subjective preference for the flowers. To avoid sequence effects, when the next subject was tested, the BGM order of the pictures was reversed.

A comparison of pictures with and without BGM.
Results and Analysis
A paired-sample t-test was employed to analyze the questionnaire data, and the results are shown in Table 3. There is a significant difference in the questionnaire data between the evaluation with and without BGM, t = −2.729, p = .010. Compared with those without BGM, the subjects displayed a higher preference for flowers pictures with BGM.
Results of the Questionnaire Data With and Without BGM.

A paired-sample t-test was used to analyze the heart rate indicator, the data was expressed in the form of M ± SD. The Mean HR with BGM factor of subjects is 80.697211 ± 10.793166, while the Mean HR without BGM factor of subjects is 82.901789 ± 10.805488. The results of paired-sample t-test are shown in Table 4. There is a significant difference between the mean heart rate with and without BGM, t = 2.341, p = .025. Compared with those without BGM, the subjects had a lower mean heart rate in the face of pictures with BGM.
Results of Mean HR With and Without BGM.

In addition, an independent-sample t-test was used to analyze the gender factor in the questionnaire data. The results are shown in Table 5. There is no significant difference between men and women in both the presence and absence of BGM (p > .05). The analysis of heart rate indicators is shown in Table 6, which also shows that different genders have no significant differences in heart rate indicators with no music and with music (p > .05). This result is similar to other online shopping consumer behaviors, and the difference between genders is not obvious (Tupikovskaja-Omovie & Tyler, 2020).
Questionnaire Results of Gender Factors With and Without BGM.

Mean HR Results of Gender Factors With and Without BGM.

According to the questionnaire data, the subjects’ preference for flowers with BGM was significantly higher than those without BGM; regarding the heart rate indicator, the heart rate slowed down significantly when there was BGM, which means that positive emotions were generated. In other words, the heart rate indicator proved that the subject’s preference for flowers with BGM is significantly higher than that without BGM, thus H2 is supported. Therefore, in the design of the flower e-commerce platform, BGM can not only enhance the festival and promotion atmosphere of the platform, induce consumers’ positive emotions toward flower products, but also bolster emotional arousal (Das et al., 2020). For gender differences, there is no significant difference in the questionnaires and heart rates of different genders with or without BGM.
E3/H3: Model Factor
Materials
The stimulus materials were two product pictures from a flower e-commerce platform. The flowers in the product pictures with a model are similar to the flowers in those without a model, only some minor differences in other factors. The experiment was a single-factor two-level (with and without model) within-subjects design. The subjects were asked to check a picture of flowers without a model and reported their subjective preference for the flowers. After a 5-second break, they were presented with a picture of flowers with a model and reported their subjective preference for the flowers. To avoid sequence effects, the order of the next subject was reversed.
Results and Analysis
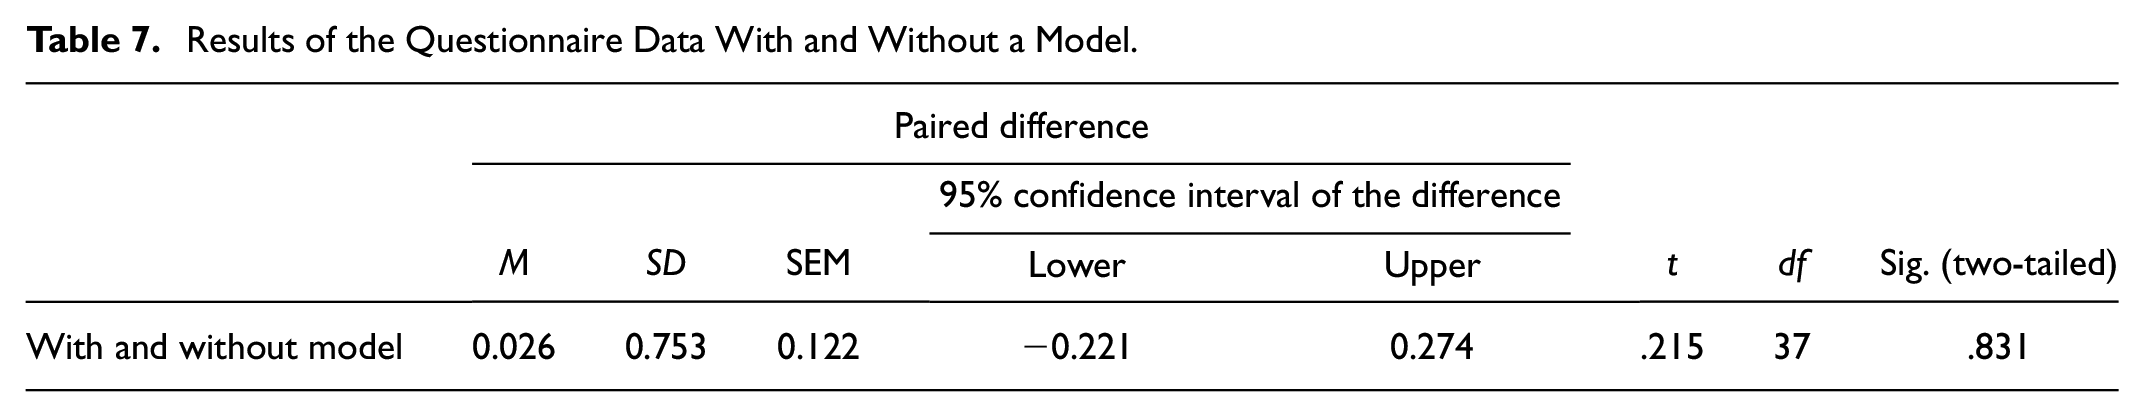
A paired-sample t-test was used to analyze the questionnaire data. The results are shown in Table 7. There is no significant difference between the two groups of data (p > .05).
Results of the Questionnaire Data With and Without a Model.
A paired-sample t-test was used to analyze the heart rate indicator, the data was expressed in the form of M ± SD. The Mean HR indicator with model factor of subjects is 88.666000 ± 11.621148, while the Mean HR indicator without model factor of subjects is 86.218316 ± 11.413969. The results of paired-sample t-test are shown in Table 8. There is a significant difference in the mean heart rate between pictures with and without a model, t = −2.277, p = .029. Compared with the presence of the model, the mean heart rate without the model is lower, which means that the subjects generated more positive emotions when seeing the flowers without a model. This result is opposite to the expected result of the experiment and the study of Elder and Krishna (2012).
Results of Mean HR With and Without a Model.

For the subjects’ preference of flowers with and without a model, the questionnaire data showed that there is no significant difference in the preference of flowers with and without a model. However, the heart rate indicator showed that pictures of flowers without a model evoke statistically significant positive emotions than those with a model. Two aspects are inconsistent with the expectations of the experiment: (1) the questionnaire data is incongruent with the heart rate indicator; (2) flower pictures without a model elicited positive emotional response instead. Through tracing to the source of the discrepancy, we can find that limited by the availability of pictures, although the two groups of flowers look similar, the background colors are different. As shown in Figure 3, the background color of the flower pictures without a model is pink, which is a warm color; while the background color of the flower pictures with a model is colder. According to the study of Hassanein and Head (2007), warm and harmonious product descriptions and pictures are more likely to stimulate intimate emotions and the trust of consumers. Hence, the inconsistency in expectations may result from the different background colors. Besides, neither the questionnaire data nor the heart rate indicator showed significant differences in gender factors.

A comparison of pictures with and without a model.
E4/H4: Greeting Card Factor
Materials
Two pictures were randomly selected as stimulus materials from a flower e-commerce platform. The two pictures are the same except for the greeting card. The experiment was a single-factor two-level (with and without greeting card) within-subjects design. The subjects were asked to look at a picture of flowers without greeting card and report their subjective preference for the flowers. After a 5-second break, they were presented with a picture of flowers with greeting card and were asked to report their subjective preference for the flowers. To avoid sequence effects, the order of the next subject was reversed (Figure 4).

A comparison of factors with and without greetings.
Results and Analysis
A paired-sample t-test was used to analyze the questionnaire data. The results are shown in Table 9. There is no significant difference between the questionnaire analysis data with and without greeting card (p > .05).
Results of the Questionnaire Data With and Without Greetings.

A paired-sample t-test was used to analyze the heart rate indicator, the data was expressed in the form of M ± SD. The Mean HR with greeting card factor of subjects is 84.176974 ± 11.507867, while the Mean HR without greeting card factor of subjects is 84.301842 ± 9.892555. The results of paired-sample t-test are shown in Table 10. There is no significant difference between the mean heart rate with and without greeting card (p > .05).
Results of Mean HR With and Without Greetings.

In addition, an independent-sample t-test was used to analyze the questionnaire data of gender factors. There is no significant difference in the subjective preference of flowers without greeting card between different genders, while in that with greeting card, there is a significant difference between men and women, t = −2.603, p = .013. The scores of male subjects were significantly lower than those of female subjects, as shown in Table 11.
Results of the Questionnaire Concerning Gender Factor With and Without Greetings.

Curiously, regarding the heart rate indicator, there is no significant difference between the preference for the flowers with and without greeting card. Among them, when there was no greeting card, p = .790, and when there was greeting card, p = .372, as shown in Table 12.
Results of Mean HR Regarding Gender Factors With and Without Greetings.

According to the above experimental data, no matter from the questionnaire data or the heart rate indicators, there is no significant difference between the subjects’ preference for flowers with and without greeting card. However, when analyzing the influence of gender factors, there are two interesting findings: (1) In terms of the questionnaire data, compared with men, women had a significantly higher preference for flowers with greeting card (p = .013). This may suggest that women have more positive emotions for the romantic factor such as greeting card than men, thus H4 is conditionally supported. (2) In terms of the heart rate indicator, there is no statistically significant difference between female subjects and male subjects in their preference for greeting card. This contradictory data result may indicate a phenomenon: It is possible that the female subjects originally have no obvious preference for flowers with or without greeting card, considering the flowers are the same, but some inexplicable consciousness drove women to prefer flowers with greeting card, which might be a psychological suggestion. Under this circumstance, given that in most cases, flower recipients are generally women, the design of greeting card for flower recipients may result in more positive feedback from female consumers.
Discussion
Analysis and Discussion of Warm and Cold Colors and Model Background
From the heart rate indicator of E3, the pictures of flowers without a model evoked statistically significant positive emotions than those with a model, which is not in line with expectations of the experiment and previous studies. Through tracing the root causes, we can see that the flowers with a model are like those without a model, yet there is some difference between the background color. The background color of flowers pictures without a model is warm color, while that with a model is cold color. Previous studies have shown that warm colors in retail spaces can lead to better product evaluation results (Zwebner et al., 2014), meanwhile enhancing consumers’ perception and identity of products and their brands (Möller & Herm, 2013). The warm colors in the environment can also prompt people to have trust, positive attitudes, and behavioral intentions in the target objects (Choi et al., 2016). The research of Baek et al. (2018) also supported that store atmosphere and visual warmth can induce consumers’ psychological warmth and have a positive incentive effect on consumers’ purchasing decisions. This kind of visual warmth brought by warm colors is produced without physical warmth (Macrae et al., 2013), so it is also applicable to pictures (Rai et al., 2017). Therefore, in order to verify whether the unintended experimental results of E3 are caused by the background color or by the model factor, this paper further introduces some experimental data for an in-depth analysis and discussion of this issue.
Comparison With and Without Model Factor
Select comparative materials from the existing experiments and compare the multi-channel physiometer data of Model Group and Non-model Group, which is in either warm or cold color, as shown in Figure 5. The Model Group in warm color is compared with the Non-model Group in warm color, where the flowers are similar, and the other experimental variables remain consistent.

Comparison of backgrounds with and without a model in the same warm color.
A paired-sample t-test was used to compare the data of the heart rate indicator, and the results are shown in Table 13. The mean heart rate difference between Model Group and Non-model Group is significant, t = 2.624, p = .013. Compared with the Non-model Group, the mean heart rate of the Model Group is lower, implying that when the background color variable is controlled, the subjects prefer the product with model. This result supports that the subjects prefer the flowers with the model factor, H3 is hence supported. At the same time, it shows that the closer the product picture is to the life usage scenarios, the more positive emotions the consumers will be stimulated (Fortin & Dholakia, 2005), and this close-to-real experience can mitigate consumers’ online shopping guilt (Hoch, 2002).
The Results of Mean HR With and Without a Model When BGM is Absent.

Comparison of Warm and Cold Colors in the Model Group
Select comparative materials from the existing experiments and compare the multi-channel physiometer data of Model Group with different background colors. As shown in Figure 6, the control group 1 and 2 have a cold and warm color respectively. The flowers in the two groups of pictures are slightly different, but the flowers are all warm, and other experimental variables are the same.

A comparison of two groups with a model when BGM is absent.
A paired-sample t-test was used to compare the data of the heart rate indicator, and the results are shown in Table 14. The data showed that there is a significant difference in the mean heart rate between Warm Color Group (WCG) and Cold Color Group (CCG), t = 4.756, p = .000. Compared with CCG, the WCG had a lower mean heart rate. This supports our expectations and previous studies (Macrae et al., 2013; Rai et al., 2017) that warm colors can generate more positive emotions.
The Results of Mean HR With Warm and Cold Colors.

Comparison Between Sole Cold and Warm Color
To further verify the influence of warm and cold colors on positive and negative emotions, this paper compared product pictures of sole cold and warm colors. The experimental materials are shown in Figure 7.

Comparison of sole cold and warm color.
A paired-sample t-test was used to compare and analyze the data of heart rate indicator, and the results are shown in Table 15. There is a significant difference in the mean heart rate between the sole cold and warm color, t = 2.161, p = .034. Compared with the cold color, the warm color led to lower heart rates. This means that subjects prefer warm color pictures, and the hypothesis is thereby tenable.
The Results of Mean HR With the Sole Warm-Cold Color.

According to the comparative data of the two sets of pictures, the following conclusions can be drawn: (1) When the background color is warm or cold, compared with Non-model Group, the subjects have more positive emotions toward Model Group. (2) Regardless of whether there is a model or not, the subjects prefer product pictures with a warm background color. (3) Combining these two conclusions, it can be derived: Compared with the model factor, warm colors have a more apparent effect of stimulating positive emotions.
The Discrepancy Between the Questionnaire Data and the Heart Rate Indicator
Although the heart rate indicator based on a multi-channel physiometer is controversial in explaining positive and negative emotions (Norman et al., 2014), the stability of the heart rate indicator and its significance analysis is quite reliable. Therefore, combined with the analysis of questionnaire data, the analysis of experimental results based on a multi-channel physiometer is highly convincing. However, although the questionnaire data can assist us in determining the positive and negative emotions based on the multi-channel physiometer indicator, there are still some inconsistencies between the questionnaire data and the multi-channel physiometer data in the experiment, so it deserves further study. A good option is the association of polysomnography with other physiological experiments, for example, pupil size indicator based on eye-tracking equipment are widely used for emotion research (Mo et al., 2022; Yang et al., 2021).
In Experiment 3, when the subjects were asked to assess their preference of flowers with and without the model, the questionnaire data showed that there is no significant difference in the preference of flowers with and without the model. However, the heart rate indicator showed that pictures of flowers without the model elicit statistically significant positive emotions than those with the model. The previous discussion and studies (Macrae et al., 2013; Rai et al., 2017) has confirmed that this is due to the warm background used in the Non-model Group and the cold background used in the Model Group. We argue that the stimulation of sympathetic nerves by warm colors may exceed personal preference, so it is essential to use the questionnaire data to help determine the emotions of the subjects.
In Experiment 4, from the questionnaire data, compared with men, women have a significantly higher preference for flowers with greeting card. This may suggest that women are more sensitive to the romantic factor like greeting card than men. However, the heart rate indicator did not support the statistically significant difference in the preference for greeting card between female and male subjects. We think that from the physiological indicators of heart rate, there is indeed no significant difference, but when filling out the questionnaire, female subjects may be attracted by the romantic factor of greeting card with psychological hints. This phenomenon may indicate that the questionnaire survey method is more subjective than the physiological measurement experiment.
Conclusions and Recommendations for Future Work
The competition in online sales will become increasingly fierce during and after the COVID-19 crisis, and customer experience will play an increasingly important role in this competition (Becker & Jaakkola, 2020). In response to this trend, this paper studied customer experience from the perspective of cognition and emotion, took consumers’ visual behavior and emotional experience of experiential products like flower in online promotional activities as an example. This study, consisting of four experiments in total, leverages a mix of multi-channel physiometer and questionnaire surveys to explore the effects of models, greeting card, BGM, promotional information, and warm and cold colors factors on consumers’ emotions, and analyzes the differences between male and female consumers on these influencing factors. The paper also discussed the research method of combining the multi-channel physiometer and questionnaire survey. The results are generally in line with expectations. Further analysis and discussion were made on the parts that do not meet the expectations, through which satisfactory explanations were obtained. This study can provide objective and quantitative evidence for advertisers, E-commerce platform retailers.
The limitations in this study: (1) The paper concluded in Discussion section that “the stimulation of sympathetic nerves by warm colors may exceed personal preference.” This conclusion is less rigorous and needs further study on the mechanism of cognitive and emotional processing. (2) Similarly, the questionnaire data of the female subjects’ attitude toward greeting card is inconsistent with data of the multi-channel physiometer, for which this paper draws the conclusion that psychological hints might have been generated in the questionnaire and that the questionnaire data is relatively subjective. This conclusion also needs further studies to confirm.
Footnotes
Declaration of Conflicting Interests
The author(s) declared no potential conflicts of interest with respect to the research, authorship, and/or publication of this article.
Funding
The author(s) disclosed receipt of the following financial support for the research, authorship, and/or publication of this article: This study was supported in part by the Guangdong Planning Office of Philosophy and Social Science under Grant GD20CTS07; in part by the 2022 Higher Education Scientific Research Planning Subjects under Grant 22SY0105.