
Abstract
The identification of spatial layout and functional characteristics among industrial clusters is vital to support the development of regional industries. Based on the industrial registration data of more than 330,000 companies in “The First Industrial Clusters in China,” and natural language processing methods (NLP), a set of identification framework for urban industrial functional zones is constructed by introducing commercial registration data and electronic map location data to deal with complex industrial big data, realizing the recognition of industrial spatial layout and functional characteristics of Nanshan. The results show that the industrial coverage of Nanshan is as high as 79.07%, and the wholesale and retail enterprises are its main bodies. Among the nine industrial functional zones, emerging enterprises accounted for the majority and diversified agglomeration areas were more than specialized agglomerations in capital scale and employability. Thus, in future industrial planning, maintaining a diversified industrial agglomeration, while giving more policy favor to functional zones characterized by wholesale and retail, can better stimulate consumption and promote economic development in the region.
Introduction
A city is a highly complex and comprehensive system, and industry is the source of life for their survival and development. In recent years, rapid urbanization has led to rapid urban expansion (Audirac, 2018; Mallach et al., 2017). Along with resource recombination and structural changes in cities, industrial agglomeration and regional specialization are gradually emerging, in the process, achieving sustainable urban development has been an essential issue causing much concern (Awan & Sroufe, 2022; Umar et al., 2021; Weng et al., 2022). To improve sustainability, planners and decision-makers must have precise information at their disposal to implement adapted urban guidelines (Cagno et al., 2019; Foltete & Piombini, 2007). Both developed western countries and key cities in China are actively promoting the optimization of urban industrial spatial layout to promote the service of urban economy and high-end industries (Awan et al., 2022). In April 2020, the CPC Central Committee and the State Council issued the Opinions on Building a More Perfect System and Mechanism for Marketized Allocation of Factors, which emphasized deepening the optimization of the urban industrial space layout and it also clearly demonstrates the role of industrial functional zones in economic development (Wicht et al., 2020). Therefore, strengthening the accuracy, flexibility, and effectiveness of urban industrial layout optimization and governance is significant and it is crucial to achieve the identification of the spatial layout and functional characteristics of urban industries.
The spatial characteristics of urban industries are heterogeneous, and previous studies show that the spatial and industrial layout in Beijing, Wuhan, Guangdong, and Lille (France) reveal different features (Foltête, 2007; Li et al., 2021; B. Liu, 2020; Song et al., 2019; N. J. Yuan, 2014). Under the joint action of industrial chain synergy, policy drive, and geographical dependence in different cities, industrial agglomeration regions are formed. Industrial agglomeration promotes high-quality development through economies of scale, economies of scope, and external effects (Guo et al., 2020). The extensive city industrial development space can result in problems such as extensive space management, low use efficiency, and high-cost industrial collaboration (Xing & Brimblecombe, 2020; Yang et al., 2008). Therefore, it is necessary to effectively identify the industrial spatial distributions, and regional industrial characteristics to be informative of the regional industrial clusters’ development status. However, existing studies mainly focus on utilization and development of urban land (Xing & Brimblecombe, 2020), range and layout (Foltête & Piombini, 2007; Xing & Brimblecombe, 2020), and geographical distribution of economic activities (Panzera et al., 2022), etc, few scholars have studied the efficiency of urban industrial space utilization, possibly due to the lack of evidence at the micro-level (Huang et al. 2017). Probably due to the absence of micro-level evidence and the challenge of processing big industrial data, few scholars have studied the spatial layout and functional characteristics of urban industries from the perspective of industries and individual enterprises.
Spatial clustering is a popular method for spatial identification, and a number of studies have been conducted to identify and classify urban land utilization based on this approach. N.J. Yuan et al. (2014) firstly proposed the DROF machine learning framework and introduced location semantics and motion semantics to identify land functions in Beijing. In order to enable more reliable identification, Y. Wang et al. (2016) proposed a multi-channel data-mining method to integrate and utilize data from different channels. Furthermore, Zhang et al. (2017) presented a hierarchical semantic cognition (HSC) structure based on previous studies and further improved the functional area recognition model. At the same time, other researchers have also realized that traditional semantic analysis only considered the potential semantic information of points of interest (POI) data, not the geographic location information. Yao et al. (2017) combined POI data with a semantic analysis model (word2vec) for the first time and introduced POI geographic location information into word2vec. Subsequently, Yan et al. (2017) extended the Word2Vec model to the Place2Vec model by amplifying the spatial context and learning semantic vector embedding, thus enhancing the interpretation of the spatial context information of the model. All the above studies mainly identify the land use of cities by introducing POI data and information from other sources, but POI data rely to a certain extent on data updates from third-party electronic maps, and these points of interest are of many kinds, extremely noisy, and contain limited information on industrial specialties, which cannot comprehensively and accurately characterize the spatial and functional features of industrial clusters, and the use of POI data for industrial functional zone Identification will bring large deviations. Therefore, based on the Place2Vec model, this study introduces industrial and commercial registration data and geographic location information of electronic maps into the industrial functional zone identification. This enables the full utilization of industrial big data on the one hand, and makes the identification of urban industrial functional areas more reliable on the other hand.
In summary, the innovation of this study lies in the following aspects: First, we introduced a natural language processing method into the identification of urban industrial functional areas. Using this approach, this study establishes a set of industrial big data processing process, which enables to continuously update the parameters of the online deployed deep learning model based on the real-time updated business registration data to identify the industrial spatial layout and functional characteristics of the city in real time. Second, through the introduction of Place2Vec and business registration data, the identification of urban functional zones will not only be limited to land use, but can be more specialized for urban industrial layout monitoring and planning, which is difficult to achieve using POI data alone. Third, according to the division of functional zones, this study further investigates the employability, development status, and capital scale of each functional zone, which found that Nanshan has a high industrial coverage of 79.07%, with wholesale and retail enterprises as its mainstay, and that the diversified agglomeration exceeds the specialized zones in terms of capital size and employment capacity. The finding can provide scientific reference for local management agencies’ decisions on industrial layout planning. In addition, this method can also provide a novel insight for future research in the field of industrial cluster management.
Research Area and Data
Research Area and Unit Division
The study area of this paper is Nanshan District, Shenzhen, Guangdong Province (113°47′–114°01′E, 22°24′–22°39′N), with an area of 187.53 km2 and a coastline of 43.7 km. By the end of 2020, Nanshan District had 1.5458 million permanent residents, whose GDP reached 650.22 trillion yuan, ranking first among districts (counties) in Guangdong Province for seven consecutive years. Nanshan District, known as the “First Zone of China’s Listed Enterprises,” integrates emerging industries in 5G, integrated circuits, artificial intelligence, biological medicine, marine economy, and many other fields, and forms a new generation of information technology and digital economy industrial clusters with ZTE, Tencent, and other key backbone enterprises as the core (Shenzhen Taxation Bureau, http://commerce.sz.gov.cn/tzly/qyfb/gqcyjs/content/post_8572223.html.).
There are three mainstream methods in the study of regional divisions: road network division (Bing, 2020; J. Wang et al., 2019; Yuan, 2015; J. Yuan et al., 2012, N. J. Yuan et al., 2016), traffic zone division (Dong et al., 2015; Sun et al., 2019), and grid division method (Tu et al., 2018; Y. Wang et al., 2016). Among them, the data availability of the traffic analysis cell method is weak, so it cannot be used for research. The grid partitioning method divides urban areas into regular polygons of different sizes. However, it only reflects the general trend of industrial distribution, and it is difficult to achieve the purpose of improving the identification accuracy of industrial agglomeration. Therefore, this study, referring to the relevant practice (Zheng et al., 2020), divides the study area of the Nanshan District into 9191 units, according to the road network (Figure 1).

Nanshan road network.
Data and Preprocessing
The microscopic data for the enterprises are provided by the Shenzhen Municipal Government Data Open Platform (https://opendata.sz.gov.cn/data/) and Tian Yancha (https://www.tianyancha.com/), which include 6.21 million business subjects. The data set includes business scope, business place, date of establishment, registered capital, enterprise status, unique social credit code, and other eight dimensions of business subjects. After eliminating invalid samples (abnormal business status and enterprises with revoked business licenses), 4,375,613 valid samples were obtained. This study selected Nanshan District as the research area, according to the acquired enterprise name, credit code, information of the enterprise, such as location, economic industry classification (according to the national economy industry classification standard [GB/T 4754-2011]), and company registration information was collected using the Baidu map API. After calibration and filtration of the data, a total of 335,126 valid samples were obtained.
Referring to Yao et al., if the frequency of industry types in enterprises is in power distribution, the training data apply to the Place2vec model. For the types of economic industries (middle class), a scatter diagram of a frequency distribution (left of Figure 2) is drawn in ascending order of their frequency. The figure shows they obey the power-law distribution. Then, the frequency value and category rank of the frequency graph were taken with logarithms for linear fitting. The goodness of fit was 0.91. The slope coefficient and its p value were −2.38 and 5.86e−197, respectively, indicating that the scale effect was significant and the distribution is power distribution. Therefore, the data can be used in the analysis of the Place2vec model.
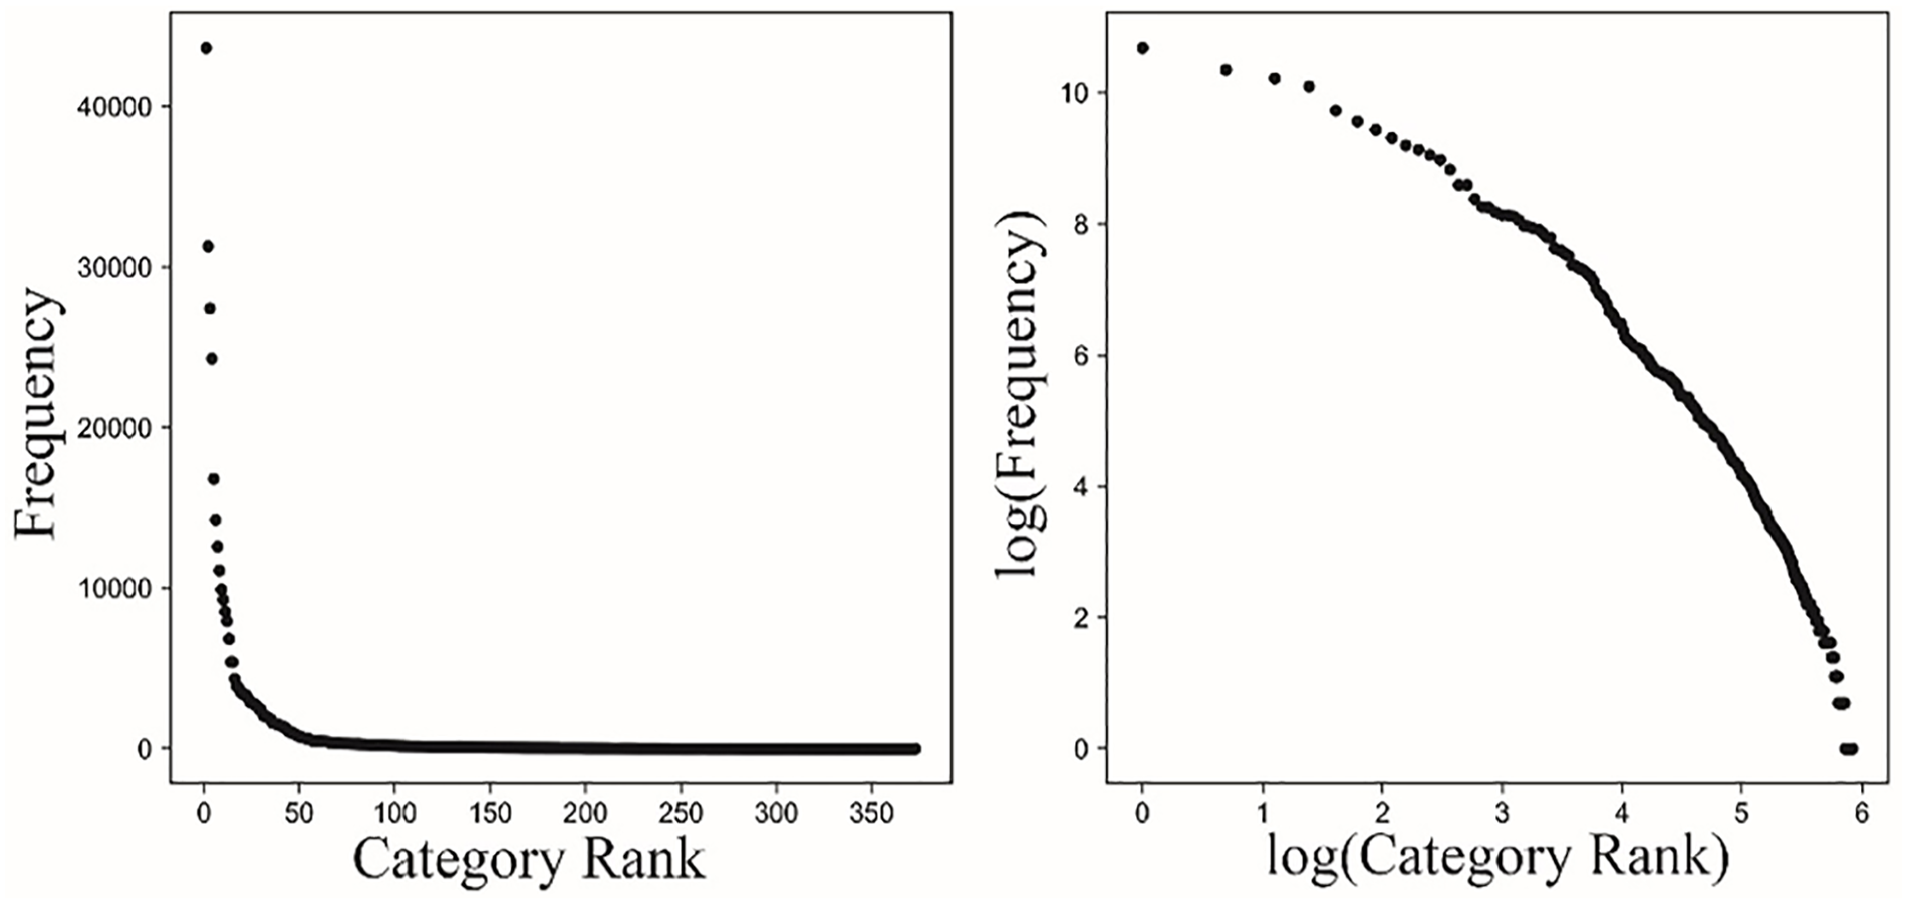
Economic types text frequency and its logarithms.
Methodology
The main task of the real-time monitoring framework is to divide industrial functional areas, mainly including the following three steps. First, a text training dataset is established based on the geographic information of commercial subjects in Shenzhen and the economic and industrial information of enterprises.
Second, based on place2vec, a pairing-matched training corpus is conducted on the economic industry information of business subjects to enhance the influence of spatial distance and, then, semantic vectors of economic industry types of business subjects are generated.
Finally, the mean values of the semantic vectors of each research unit are calculated, and K-means is used to cluster the eigenvectors to determine the types of functional areas to which each research unit belongs. The industrial functional areas in the Nanshan District of Shenzhen are identified and labeled.
Training Dataset Construction
Based on the text information of commercial subjects in Shenzhen, the Place2Vec model was established to obtain the semantic vector mapped into the high-dimensional space to vectorize the text information to measure the similarity degree of economic industry and spatial texts. In order to strengthen the influence of the geographical distance, refer to the pieces of literature (H. Liu et al., 2020; Yan et al., 2017; Zheng et al., 2020), the paper matches the adjacent POI training and augmenting factor

In Formula (1),
To minimize the time pairing-match nearest commercial subjects, a KD-tree algorithm is applied based on the locations of the commercial subjects. The longitude and latitude features were selected for the spatial segmentation. Each search for pair-matching starts with the leaf node of the target node, and the current node is set as the nearest node, and the nearest node is compared with the brother node. If the brother node is nearer, it is set as the nearest node. This procedure is repeated until the parent node of the target node is returned. Many nodes not in the same eigenspace were eliminated when searching with the KD-tree; therefore, they are more efficient than others.
Calculation of the Eigenvectors of Commercial Subjects
The eigenvector of each subject must be calculated before clustering and labeling the research units. The eigenvectors generated by the place2vec model contain the industrial characteristics and location features of enterprises. The eigenvector or each research unit is calculated by the commercial subjects’ eigenvectors, reflecting the characteristics of the entire research unit. Furthermore, the eigenvectors of the research units are clustered. The research units with similar features are put into the same cluster, facilitating the extraction of industrial features of functional areas.
Place2Vec uses a deep neural network structure with multiple layers of nonlinear variation to vectorize complex statements, integrating multiple dimensional information, including geographical locations and subject attributes. There are two types of place2vec models: CBOW and skip-gram. Based on the words-bag model, the CBOW model introduces a method of continuous word distribution, which is more advantageous for processing large volumes of texts. Since there are still 335,126 samples of commercial subjects after eliminating invalid samples in this study, the CBOW model is used to carry out semantic vectorization. The CBOW model projects the words


In formula (2),

In formula (4),
Moreover, during the training of CBOW, the eigenvectors’ dimension, the minimum word frequency truncated in a dictionary, and the maximum distance between the current word and target word are important parameters. The data used in this study are provided by the Shenzhen government and Tian Yancha, whose industrial types are standard text with no miscellaneous statements. This study uses pair-matching training to vectorize commercial subjects. Therefore, the minimal dictionary truncation frequency was set to
Functional Areas Clustering Based on Eigenvectors
After calculating the eigenvectors of the commercial subjects, those of each research unit needs to be determined. Research units with similar characteristics are clustered into a category for future identification and labeling. The CBOW model can convert the characteristics of a sample into a 50-dimensional semantic vector. Referring to relevant studies (Yao et al., 2017; Zheng et al., 2020), the weighted mean of the semantic vectors of each subject in the research unit is carried out to obtain the eigenvectors,

In formula (5), N represents the number of industrial types in a research unit,
Compared with other clustering methods, K-means clustering is more suitable for processing high-dimensional and large-volume data. However, the prior parameter clustering number K should be confirmed before K-means clustering. The classification of industries in the national economy divides enterprises into 20 categories and 473 middle categories. Considering the diversity of industrial types and the limitations of computing, the range of K is limited to between 3 and 20. Based on this point, the silhouette coefficient and elbow methods are used to determine the specific cluster number. The main measurement index of the elbow method is the sum of squared errors (SSE), while the core measurement index of the silhouette coefficient method is the silhouette coefficient. The optimal clustering number is at the node of the scatter graph of SSE and K values, and the larger the Silhouette coefficient, the better the clustering results.
Identification and Labeling of Functional Areas
This study examines the industrial characteristics of regional performance according to the economic and industrial information, physical location, and aggregation structure of the final identification of commercial subjects. The identification and labeling of industrial functional zones were carried out from the following two aspects:
(1) Frequency density (FD). Calculate the frequency density of various enterprises in each functional area and obtain the distribution of each type of enterprise. The frequency density is calculated as follows:

In formula (6),
(2) Category factor (CF). Calculate the category factors of each type of enterprise in the industrial function area and judge the leading function of each functional area by combining the horizontal and vertical aspects. The calculation method is as follows:

In Formula (7),
Based on the methods mentioned above, the deployed Place2Vec model can continuously update parameters online based on business registration data and geographic location data, which makes the Place2Vec model have the ability to capture the industrial aggregation status in functional areas online and in real time. In the next step, Place2Vec achieves real-time identification of functional features in each zone by continuously generating feature vectors obtained from real-time online learning of each research unit and completing functional zone clustering. This process also allows the proposed method in this paper to process these business registration data in real time.
Research Results
Spatial Clustering of Commercial Subjects
The spatial clustering of commercial subjects shows their regional distribution. Hierarchical clustering, systematic clustering, and other methods have high time complexity and are unsuitable for large-scale data. In addition, the spatial aggregation of the commercial subjects measures the linear distance of the geographical positions among the various subjects, and the closer the distances are, the higher the similarity of the samples. It is consistent with the idea of K-means clustering using Euclidean distance; therefore, K-means clustering is selected to study the spatial aggregation of commercial subjects.
Before k-means clustering, the prior parameter (clustering number) K should be confirmed. The optimal clustering number was determined based on the silhouette coefficients and the change in the curve. Based on the theory above, the relationship among the SSE, silhouette coefficient, and K is plotted. As shown in Figure 4, the horizontal axis represents the number of clusters, and the vertical axis represents the SSE (left) and silhouette coefficient (right), respectively. In the Figure 3, we need to find a k value with a more obvious elbow shape in the left graph, and meanwhile make the Silhouette coefficient on this k value as high as possible (right graph), it is obvious that the value of SSE does not vary noticeably from 9 to 13, and it is necessary to choose the k value with the highest silhouette coefficient in this range, so we choose k = 12 in the spatial clustering.

Relationship among spatial clustering number K, SSE, and Silhouette coefficient.
As shown in Figure 4, the spatial distribution of the commercial subjects in the Nanshan District of Shenzhen presents a pattern of “gathering in the middle and dispersing around.” Commercial subjects were mainly concentrated in the central and southern regions. However, in the northern inland area, the reservoirs and mountains are crisscrossed, and the distribution of the enterprises is relatively dispersed owing to the influence of topography. Within the administrative regions, the southern regions are mostly sea, terminals, and ports, so the distribution of enterprises is relatively dispersed, and the aggregation of dots in navy blue is far less than that of the central regions.

Spatial distribution of commercial subjects.
The results of enterprise point aggregation show the spatial distribution of enterprises within an industrial cluster, and this result also reveals that the geographical factors play an important role in the development of industrial clusters, and are necessary to be considered when further investigating the functional characteristics of industrial clusters (specifically, the functions of parcels). Therefore, in the further analysis of the functional characteristics of clusters, we will consider both geographical factors and enterprise functions, and make a comprehensive consideration of the state of industrial clusters to achieve the identification of the functional characteristics of industries in the region.
Divisions of Functional Areas
The spatial agglomeration of enterprises only reflects the geographical distribution of commercial entities, but it cannot reflect the industrial characteristics of each region. The industrial category in the commercial information of a company is a choice for the natural business scope when it is registered, which corresponds to the industry classifications in the National Economic Industry Classification (GB/T 4754-2011). By applying the industrial categories to the Place2vec model, identifying the types of regions is feasible. First, based on the OSM road network data, Nanshan District is divided into 9,191 research units in Nanshan District. Among them, 1987 valid research units contain commercial subjects. Then, the eigenvector of each research unit was calculated and clustered. Considering the huge amount of data and high dimensions, the K-means method was used to complete the clustering work. For the same reason in 4.1, we select the k value with the highest possible aggregation coefficient as the number of classes for clustering in the range of k values where the SSE does not show particularly obvious elbow shape, and finally set the number of functional zone clusters as k = 9 (Figure 5).

Relationship among industrial clustering number K, SSE, and Silhouette coefficient.
According to the plac2vec method described above, the functional areas of the Nanshan District are drawn in Figure 6 (the gray areas are invalid areas with no commercial subjects, so they cannot be identified as functional areas).

Identification of industrial functional areas.
As shown in Figure 6, the Nanshan distinct is divided into nine types, and the category factor and frequency density of each functional area is calculated as shown in Table 1, and each functional area is named as:
CF, FD Value of Each Functional Area.
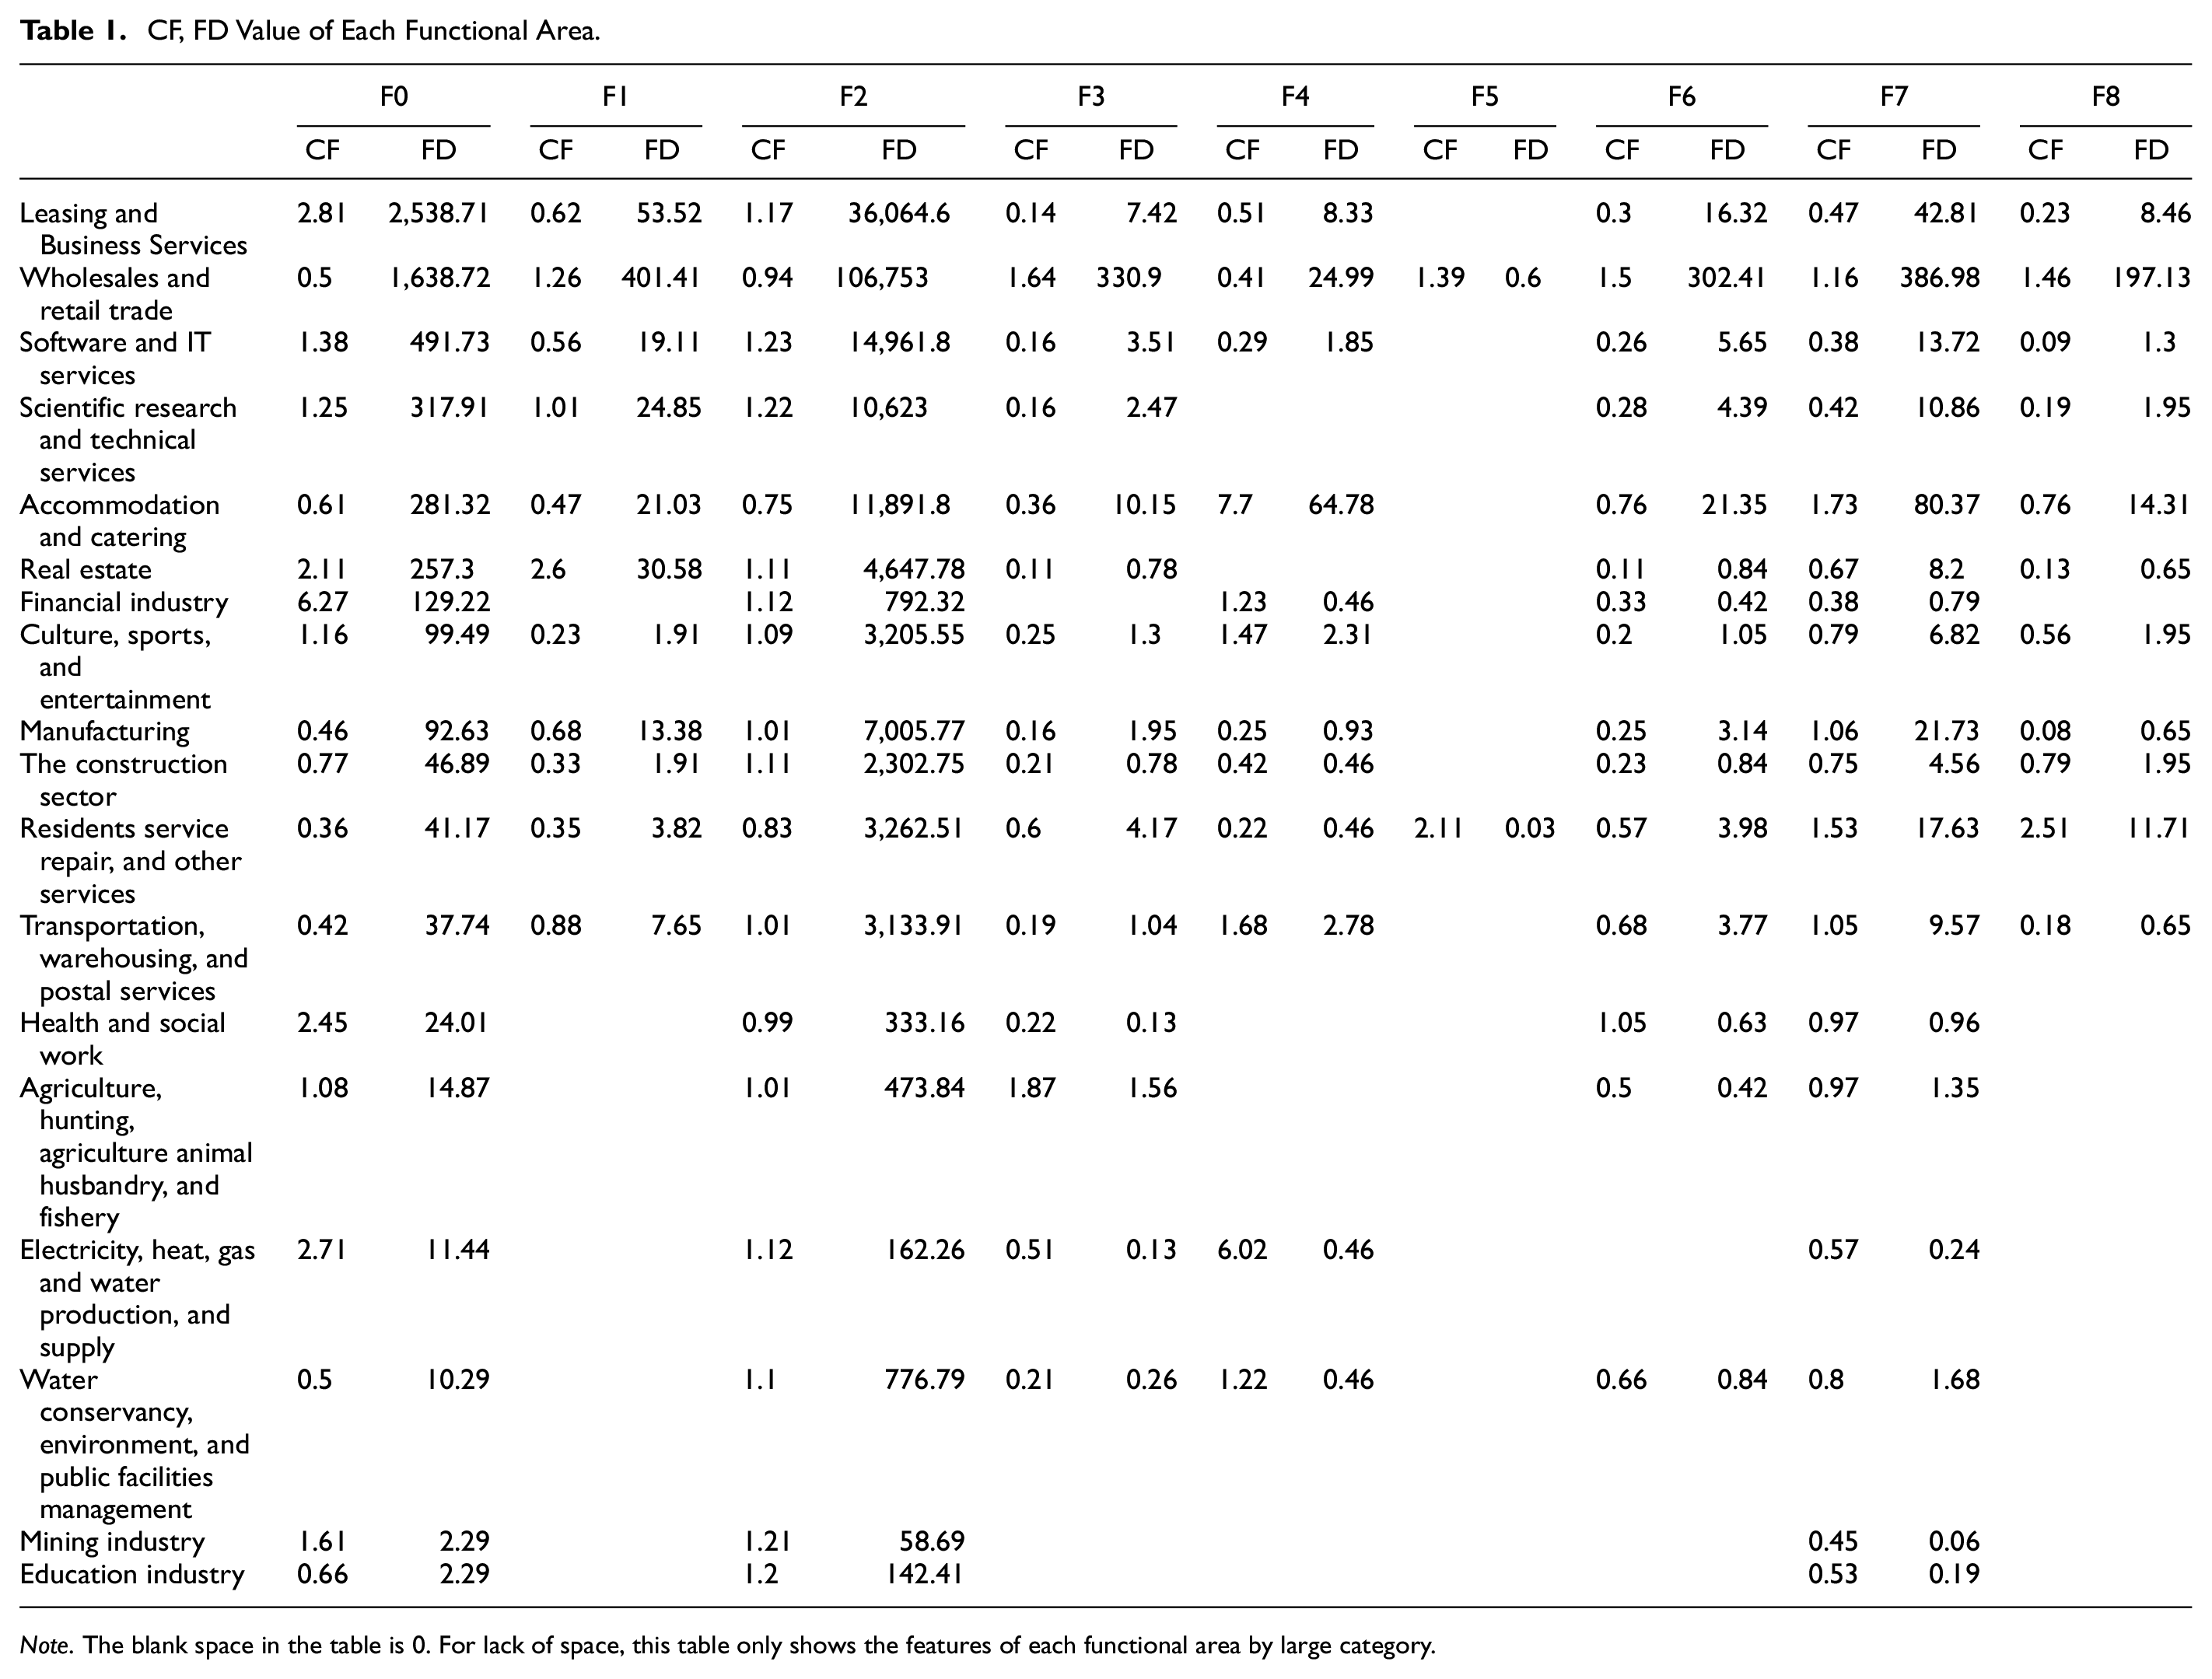
Note. The blank space in the table is 0. For lack of space, this table only shows the features of each functional area by large category.
According to the middle types of industries, there are 374 types of enterprises in Nanshan distinct, with a 79.07% industrial coverage rate. From the above discussions and the CF in Table 1, the wholesale and retail enterprises in the Nanshan district are a very large group. Among the 336,391 commercial subjects, 184,484 subjects belonged to wholesale and retail enterprises, accounting for 54.84%, the most significant industrial feature of Nanshan. Therefore, to calculate the characteristics of the functional areas in Nanshan District, it is necessary to evaluate its potential industrial characteristics. Consider several functional zones, for example,
(1) Real estate functional area (F0). The main industrial category of enterprises in this functional zone is financial industry (CF: 6.27). This functional zone has a large number of enterprises belonging to the financial industry, and a large proportion of the financial industry in the entire study area is clustered in this area, which shows a clear professional differentiation with the characteristics of finance.
(2) Comprehensive functional area (F2) This functional area mainly includes software and IT services (CF: 1.23), scientific research and technology services (CF: 1.22), mining (CF: 1.21), education (CF: 1.20), and leasing and business services (CF: 1.17). The functional area covers all industrial types in Nanshan and contains a large number of enterprises. In addition, the category factor of each industrial type in the same industry is similar; hence, the functional area does not show significant industrial characteristics and is named as a comprehensive functional area. From the map, it occupies a large part of the administrative areas of the Nanshan district, which also indicates that in the Nanshan district, a large part of the regions presents a state of diversified industrial aggregation.
(3) Life service functional area (F4). This functional area mainly includes the accommodation and catering industry (CF: 7.70), electricity, heat, gas, and water production and supply (CF: 6.02), culture and sports entertainment industry (CF: 1.47), and other life service enterprises. The most frequent type of enterprise within this functional area is the accommodation and catering sector, followed by the wholesale and retail sectors. However, most of the companies in the electricity, heat, gas, and water production and supply sectors are concentrated in this functional area. The enterprise functions covered by this functional area generally belong to life service and are named life service functional areas.
Other functional zones are also named by the procedure above.
Analysis of the Characteristics of Industrial Functional Zones
The registered capital of the commercial subjects and the number of insured workers provided by the government and Tian Yancha were used to analyze the development in functional areas. As shown in Table 2, the functional area with the largest total capital is F2, with a total registered capital of 1.93 million yuan. The functional area with the smallest total registered capital was F5, with approximately 57 million yuan. Generally speaking, the enterprises in the F0, F2, and F7 functional areas have a relatively large scale, with the registered capital reaching 100 billion yuan or even a trillion yuan. The scale of F5, F4, and F1 functional areas is relatively small, with a total registered capital of 100 million yuan or less. The number of insured workers in the enterprises measures their employment ability. Among the nine functional areas, F2 has the strongest employment ability, with 717,803 insured workers in this functional area, and F7 has 104,073 enrollees. The F0 function area comprised 27,569 insured workers. However, F3, F5, F6, and F8 districts are relatively weak in boosting employment, with fewer than 1,000 insured workers.
Basic Information of Enterprises in Each Functional Area.
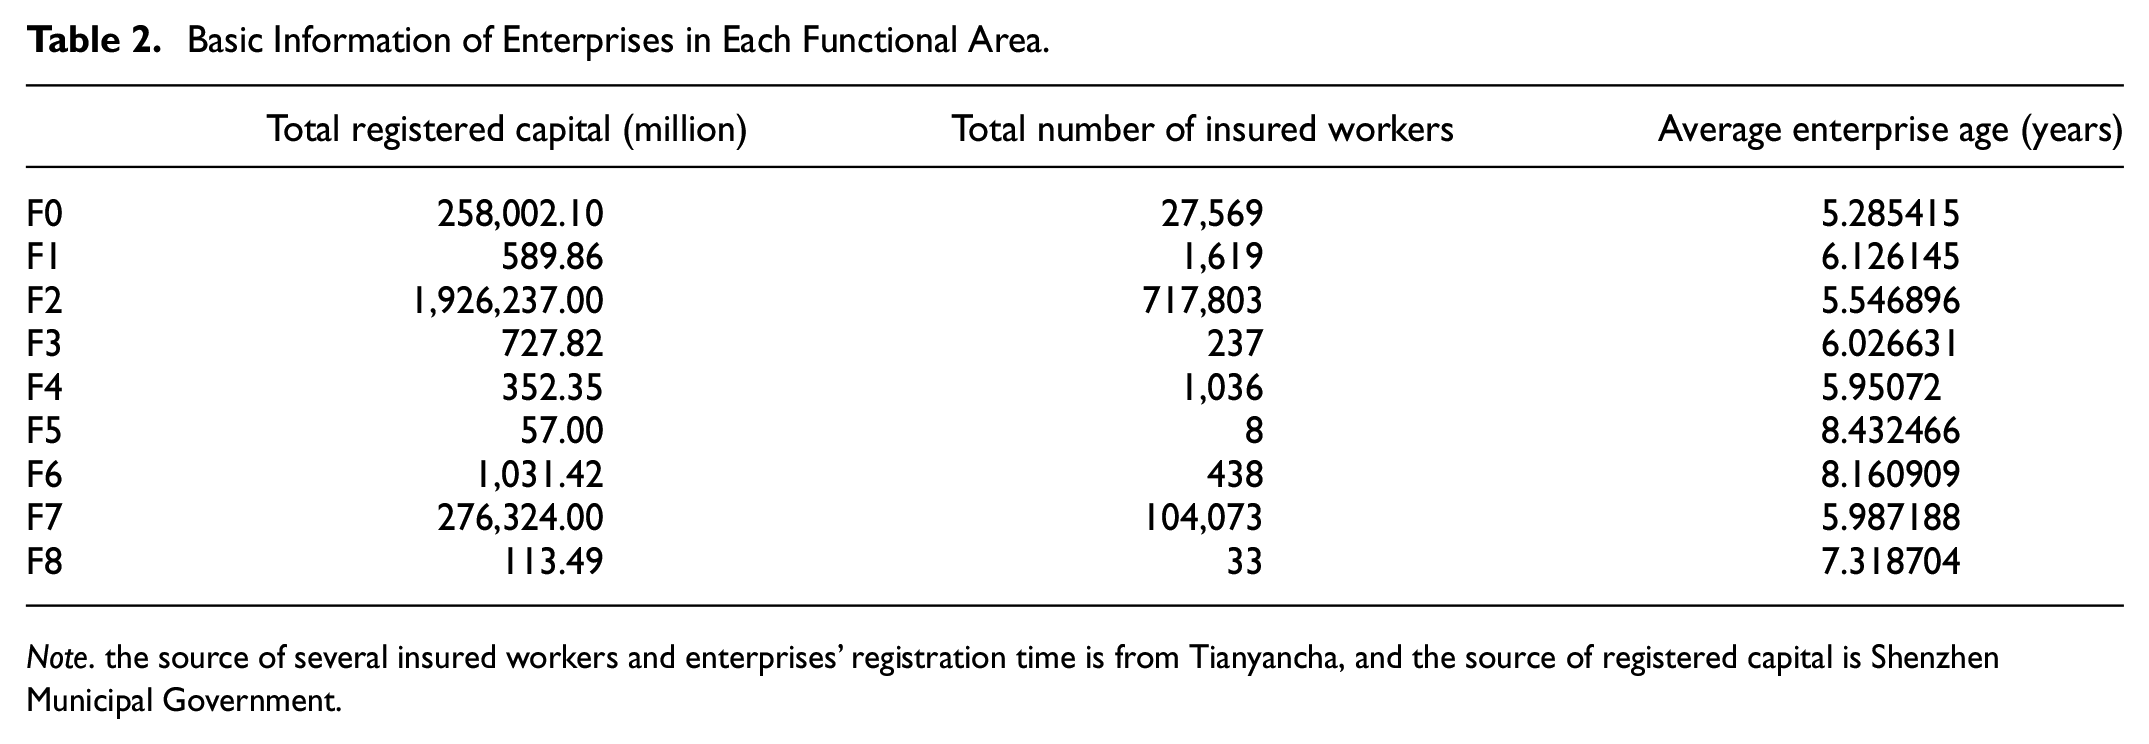
Note. the source of several insured workers and enterprises’ registration time is from Tianyancha, and the source of registered capital is Shenzhen Municipal Government.
The average ages of enterprises in each industrial functional zone were calculated according to the registered age of the commercial entities in the dataset (Table 2, Figure 7). The oldest functional zone in the Nanshan district is F5 (8.43 years), and the youngest industrial function area is F0 (5.29 years). The industry in Nanshan District is still dominated by young enterprises; they account for the majority. The average age of the enterprises in F7 is 5.99 years, and the average age of enterprises in F2 is 5.55 years. The average age of the enterprises in these two functional areas was relatively high. At the same time, elderly enterprises (enterprises aged greater than 20 years) are also concentrated in these two functional areas. In addition, the average age of the enterprises in the F0 area is the lowest. There are not many senior enterprises in F4, F5, F8, and F1. The age distribution of the enterprises is likely biased toward young companies. Therefore, these four functional areas are more dynamic than the other functional areas, while enterprises in functional areas such as F7, F2, and F0 are relatively mature.

Box diagram of enterprise registration age.
Furthermore, we analyzed the spatial distribution of the average registered capital (Figure 8 (a)), number of insured workers (Figure 8 (b)) and average registration year (Figure 8 (c)) in each unit. The variables in Figure 8 were graded by nature breaks (Jenks) to ensure maximum variation among the grades. From Figure 8, it can be seen that large-scale enterprises (with strong registered capital and a large number of insured workers) are mainly concentrated in the north-central and southern coastal locations of Nanshan District, while older enterprises are mainly distributed around Nanshan District. This suggests that the emerging enterprises in the central area are developing rapidly and have been at the top of the scale in a short period of time, while the development of the older enterprises is gradually sluggish and not as impressive as the emerging enterprises in the central area.

Average registered capital (a), insured workers (b), and company age (c) of each unit in Nanshan.
Conclusions
The identification of spatial layout and functional characteristics of industrial clusters is essential to support the development of industries in the region. In this study, we introduced natural language processing into the study of industrial functional zones identification, and to promote the accuracy of industrial functional zone identification, we also introduced commercial registration information and location information of enterprises. With the real-time updated industrial and commercial registration information, we can realize the real-time identification of the industrial functional areas in the region. Compared with traditional urban functional zone identification, the proposed method in this study overcomes the high noise characteristics of POI data and realizes specialized industrial big data processing. This real-time industrial function monitoring frame provides a new method for identifying the spatial distribution and functional characteristics of industrial agglomerations with low cost and high reliability. It also provides theoretical reference and support for industrial planning and layout, which is helpful for the sustainable development of urban industries.
The industrial coverage in Nanshan District reaches 79.07%. Among these enterprises, wholesale and retail businesses are the mainstay of the industry, accounting for 54.84%. The huge scale of the wholesale and retail industry in this region has become a characteristic of the overall industry in Nanshan District, which is usually the main type of industry in southern cities in China. This suggests that the study area has a large number of retail tenants, and it also means that this area is more capable of driving consumption and has a high level of urban activity and economic vitality. In the context of expanding domestic demand, in order to boost consumption and stimulate regional economic development, the government needs to pay more attention to the policy inclination of this area. Among the nine subdivided industrial functional zones, F0 and F4 exhibit a clear professional aggregation, while F2 shows a clear diversified aggregation, and the capital scale and employment capacity of the professional functional zone are lower than those of the diversified functional zone. Among the nine subdivided industrial functional zones, F0 and F4 show a clear professional-type aggregation, while F2 shows a clear diversified aggregation, and the capital scale and employment capacity of the professional-type functional zone are lower than those of the diversified functional zone. Among them, F0 zone is mainly characterized by financial industry and has the youngest age among all functional zones, but the second largest number of insured workers, while F4 zone is mainly characterized by life services, with fewer insured workers compared to F0 zone and older average enterprise age than F0. The capital scale of F2 zone jumps to the top of all functional zones, and F0 is the second. This phenomenon implies that the emerging financial industry in F0 zone pulls great employment in the region and has a certain scale of enterprises, but even so, the diversified gathering area of F2 is still better than other zones in terms of capital scale and ability to pull employment, so the development status of diversified industrial functional areas is better than specialized functional areas in the study area, and should be promoted in the future development planning of industry this diversified industrial distribution.
Certainly, the proposed methodology and analytical results in this study also have certain limitations. First, the business registration data contains more detailed industrial classification of enterprises, compared with the most detailed classification, the functional zone identification in this study is rougher, which is because the industrial classification under small categories is more detailed and complex, causing a series of problems such as calculation increase, the inconvenience of statistical summarization and not easy to display, etc. In the future studies, how to deal with the detailed industrial classification data to achieve a better identification of the functional characteristics in industrial functional zones is an important direction. Secondly, the real-time update of industrial functional zone status depends on the real-time update of business registration information. Only by crawling the business registration information online in real time, the spatial distribution and functional characteristics of industries can be updated in real time, which also needs to be permitted. Finally, the commercial registration data contains relatively limited valuable information, and in the future, more diversified sources of evidence can be used to study the development characteristics of industrial functions in the temporal dimension.
Footnotes
Declaration of Conflicting Interests
The author(s) declared no potential conflicts of interest with respect to the research, authorship, and/or publication of this article.
Funding
The author(s) disclosed receipt of the following financial support for the research, authorship, and/or publication of this article: This research was supported by the National Natural Science Foundation of China (no. 12026239, 71872034), Scientific Research Project of Liaoning Education Department (LN2020J35), Special fund project for graduate innovation in Jiangxi Province in 2021 (YC2021-S478) and and Humanities and Social Sciences of Ministry of Education Planning Fund (22YJA910004).