
Abstract
This paper examined finance-growth nexus in the finance industry and the influencing factors of economic indicators which deliberate on the performance of the Solow Growth model to prove the actuality of financial development (FD) inside the economic growth (EG) model, based on the regional data from 1980 to 2017 in Africa. We applied the econometric method of GMM style panel vector autoregressive (PVAR) and panel quantile regression (PQR). With the optimal finance-growth outcome, the review shows that the economic indicators influence the finance-growth nexus. The quantile results show that high economic indicators help to strengthen the finance-growth nexus, whereas low economic indicators hinder it. The GMM style PVAR results present a mixed effect in terms of the connection and marginal significance, indicating that FD has a varied impact on economic growth. Last, the granger causality results show a two-way causal association amid finance-growth in Western, Central, Eastern, and Southern African economies and a unidirectional causal link of finance-growth in Northern Africa. The policy conclusion is that to gain the long-term economic benefits of FD, African countries should strive for low and steady economic stability. To attain the required economic stability, it may be important to use suitable fiscal and monetary policies.
Keywords
Introduction
Empirical confirmation vis-à-vis financial development (FD) and growth display the benefits differing across nations and regions, and the influence of economic growth (EG) commonly depends on the FD of the nation. This infers that well-functioning fiscal management is an essential precondition for FD to have a positive effect on growth (Alfaro et al., 2009; Azman-Saini & Law, 2010). When a fiscal policy in the economy is better developed, technological spillovers to domestic enterprises and the diffusion process are more efficient because the subsidiary of an international organization can expand its investment in the economy (Hermes & Lensink, 2003). The more established a country’s financial industry is, the better it will be able to influence credit constraints in its economy and potential entrepreneurs, contributing to EG. However, an existing review advocates that once a country grasps the minimum FD threshold, FD begins to affect EG, with the effect expanding in proportion to the quantity of FD (Alfaro et al., 2009; Azman-Saini & Law, 2010). Africa’s growth trajectory and monetary improvements, where most of the economic structure of the country remains extremely weak and shallow in the CFA (David & Grobler, 2020). Backwardness relative to the financial region where the loss of both institutional (Singh et al., 2009), informality, poor governance, political uncertainty, and finance has been due to this, and population density is sparse. More recently, monetary integration is recommended by David et al. (2020) as a significant medium for economic improvement, especially in more institutional outstanding locations. More generally, monetary intermediation and inclusion remain substantially reduced in this region, which is relatively developed, and developing countries represent a mix of different aspects. Africa’s FD is still quite low in comparison to other international regions, despite a series of measures aimed at strengthening it (Aluko & Obalade, 2020). Rajan and Zingales (1998) suggest that trade and economic openness are essential for the proper improvement of the monetary situation.
Consequently, there is no well-organized, well-run, or widely recognized organization in Africa in the responsibility of emerging, supporting policy execution, and incorporating all African countries. The West, South, North, Central, and East regions of Africa serve as the foundation for economic blocs like the Economic and Monetary Community of Central Africa (CEMAC), East African Community (EAC), Southern African Development Community (SADC), and Economic Community of West African States (ECOWAS). The sub-regional groupings all have a distinct objective, and via the merger of their nations, they are liable for various industrial achievements in the regions. Their activities have contributed to differences in regional progress and change. Consequently, it may be inaccurate to compare African nations without taking variation into consideration. Similarly, it could be challenging to put the findings of such a study into reality as there is no centralized organization in place to apply such policies on a wider scale. This study will help financial sector authorities select suitable management techniques that will increase the overall value of their organizations. The results of this study will also help policy-makers create thorny strategies and programs to promote the expansion and sustainability of the financial sector in Africa. Additionally, supervisory organizations in Africa, like the Bank of Africa and other authorities that oversee the capital market, may use the study’s findings to enhance their policy structure. Furthermore, by offering more recent empirical facts on corporate and firm financial performance, the study improves the already-existing finance literature in Africa. This serves as a reserve for scholars and academics who want to learn more about this topic, which is very advantageous to academia.
A critical review of these studies discovered two common limitations: (i) inconclusive results of the subjects and (ii) little recognition of moderating economic stability variables (FDI, INFLATION, and GFE) to analyze the responsiveness of finance-growth, especially within the African context. This has led to a new area of research focusing on environmental determinism within the framework of financial development (Nasreen et al., 2020; Omri et al., 2019). In line with the limitations found in earlier studies, this study seeks to examine the responsiveness of moderating economic stability variables (FDI, INFLATION, and GFE) in finance-growth nexus. This objective is divided into two sub-objectives. First, we analyze how (i) how finance reacts to shocks to economic growth using PVAR and (ii) due to the disparities among the selected countries in Africa, we examined heterogeneous responses of FD-EG nexus among the selected African countries using PQR.
The below are the contributions made by this review: First, while there have been various reviews on finance-growth nexus in Africa, many of these reviews have paid little consideration to the controlling effects of economic stability indicators, (FDI, INFLATION, and GFE). This research contrasts with prior studies in this respect since it analyzes the literature on the FD-EG nexus without sighting the controlling parameters. Preceding reviews (Aluko & Obalade, 2020; Ibrahim & Alagidede, 2017; Manu et al., 2020) reiterated the empirical literature’s findings and techniques on the FD-EG nexus while neglecting variables that have negative or positive moderating effects on the FD-EG nexus. Second, this study accounts for geographical variability by looking at the topic from the perspective of Africa’s five geographical regions (Western, Southern, Northern, Central, and Eastern). According to the literature in Africa, many studies in Africa address the problem by focusing on Africa as a whole, a region in Africa with income levels, or sub-groups with less attention on the corresponding sub-regions. By researching the problem from subregions, the study aims to give empirical findings not only for comparison but also for specific regional policy decisions. We fill this study need by integrating empirical evidence that shows that FD-EG nexus is influenced by the level of some key economic stability indicators (FDI, INFLATION, and GFE). Our goal is to examine the variables that influence the FD-EG nexus to offer scholars a picture of recent research and to suggest policy inferences for future research. Insight into the elements that influence the FD-EG will be used to help policymakers in various sub-regions design policies. As a result, policymakers must have a thorough understanding of the factors that promote or obstruct the finance-growth nexus to create policies that will help finance drive EG. Policymakers will be able to properly evaluate these variables in their drive to boost EG via the financial sector if they have a thorough knowledge of their moderating effect. The results of this survey shed light on the critical role that macroeconomic stability indicators (FDI, INFLATION, and GFE) play in determining the influence of FD on EG. This research explores the need for solid institutions for FD and growth by combining empirical information from prior studies. It also emphasizes the need for governments to achieve the long-term economic benefits of FD by ensuring macroeconomic stability. In the FD-EG nexus, the level of FD and EG is also important, according to this poll. Consequently, impending studies should integrate these metrics in determining the impact of FD on EG. Lastly, our study provides policymakers with the required FD policy options to promote growth. Comprehensive established improvements, the retention of stable economic stability, and the design of measures that can increase FD-EG are examples of such policy alternatives.
Theoretical Background
Financial Structure and Finance-Growth Nexus
The point of view primarily grounded on the financial institutions emphasizes the high quality effect of banks within the economy by way of increasing venture efficiency, the control, and liquidity risk, efficiency of capital apportionment and company sovereignty (Diamond, 1984), assembling capital to make the most economies of scale, taking gain of economies of scale and statistics collecting and processing (Beck et al., 2004), and accelerated performance and price of debt corporations, mainly in countries with susceptible agreement enforcement abilities (Rajan & Zingales, 1998). Further, the bank based likewise emphasizes the weaknesses of the financial market-based systems. Perhaps, as economic markets firms disclose information swiftly and publicly, man or woman traders do not have any incentive to acquire records (Boot et al., 1993; Stiglitz, 1985). Similarly, in contrast to banks that act as associations of investors coordinated, markets dearth incentives efficient to control corporations and reduce ethical danger submit-loan, intending to result in substitutions property. Moreover, liquid markets can create a feeling of myopic funding because buyers can sell their shares at a low value, which has much less incentive to workout strict control of corporations (Bhide, 1993). Thus, financial market-based systems are inaudible in treating both the unruly of the business enterprise and short-termism. In dissimilarity to the vision based on the bank, the market-based view emphasizes the prominence of financial markets for EG. For example, excellent markets strong enticements to encourage individual stockholders to study companies, such as information that is unidentified to others can certainly translate into earnings (Holmström & Tirole, 1993). Financial markets also improve communal governance, and risk supervision support and transfer through modification of financial resources (King & Levine, 1993). Furthermore, the point of view based on the market believes that the bank’s innovation by preventing the extraction of rents of information and protection of signatures established by the Bank with close firm ties competition in the market (Rajan & Zingales, 1998). For example, once the privileged banks obtain evidence about corporations, firms have to pay more for countless access to capital, reducing the firm’s effort to undertake innovative activities and profitability. Meanwhile, the powerful banks may conspire with the manager’s firm against other creditors and deter the efficient cooperation government (Beck et al., 2000).
Financial Development-Economic Growth
In Latin American economies, Campos and Karanasos (2008) used a database of the World bank’s financial structure to explore the impact of financial structure indicators on FDI inflows as a % of GDP. Using System GMM, Blundell and Bond (1998) found that financial liberalization has a positive substantial impact on the attraction of foreign capital flows, stressing the necessity to engage in financial reform. With a focus on 29 economies, Schmitz (2011) used indicators from the EBRD transition Report to analyze the determinants of FDI from 1989 to 2007 and found that strong financial institutions have a positive impact on foreign capital flows. Soumare and Tchana (2011) used indicators originating from the database of IMF to analyze the bi-directional causality between reform of the financial system and FDI in 29 countries for the period 1994 to 2006. Through PVAR and Granger Causality analysis, they found the direction of the causal effect. Furthermore, they estimate a three-stage least squares (3SLS) of the relation between the development of the banking sector and foreign direct investment flows and stock Market development (SMD) and foreign capital inflow. The result suggests the existence of interrelationships while the 3SLS result provides evidence that the stock market has a significant causal effect on foreign capital inflows. Exploring the role of FD in attracting FDI, Dellis (2019) relied on OECD’s database for foreign direct investment statistics, the author drew financial variables from the WDI Database and the FD Database of IMF. In the study, the financial system encompasses 25 indicators covering the financial market, FD, stock market development, and banking governance. The results of the two-step IV-GMM exhibit that the host country’s efficient financial system with diversified sources of funds acts as the key determinant of FDI inflows increasing the multinational firm’s participation in the economic growth.
Bayar and Gavriletea (2018) in their study use panel data analysis to investigate the relationship between FD and FDI inflows in Eastern and Central countries of the European Union for the period 1996 to 2015. They found that no co-integration exists between FD and foreign capital inflows. Tsaurai and Makina (2018) directed their research towards the analysis of the influence that threshold levels of FD have on FDI inflows in 21 developing countries, they found that well-developed banking and stock market have a significant effect on FDI inflows. Furthermore, a high level of bond market development has a significant effect on foreign capital inflow. Abdul Bahri et al. (2019), use co-integration, cross-sectional dependency auto-regressive distributed lag (CS-ARDL), VECM, and FMOLS analysis to explore the upshot of FD on FDI inflows in five economies in Asia including the Philippines, Thailand, Singapore, Malaysia, and Indonesia from 1980 to 2017. They find that the decision of investors relies on the status of the financial system, furthermore, the causality test reveals that there is a short and long-run relationship between FD and FDI inflows.
Azman-Saini and Law (2010) examined the role of the host country’s domestic financial markets in mediating the effects of FDI on growth. With a sample study of 91 counties from 1975 to 2005, based on the threshold effects they applied a regression model with cross-country observations and found evidence that the effects of foreign direct investment on growth are effective only after the FD reaches a certain degree of the threshold level until then, the gains originating from the FDI are not effective (Azman-Saini & Law, 2010). Analyzing the impact that the financial market has on the relationship between FDI and business start-up Munemo (2017) found that the extent to which FDI stimulates start-ups deeply relies on the level of financial market development of the recipient country. Alfaro et al. (2009) investigated the diverse links existing between financial markets, FDI, and EG. Their research examined whether or not economies that have better financial systems can exploit more effective foreign direct investment, the result of their analysis revealed that when countries have a well-developed financial system they benefit more effectively from foreign technology spillovers raised by FDI inflow. Dellis (2019) focused on the analysis of the financial determinants of FDI inflows and outflows in 54 countries from 1997 to 2012 and found a positive impact of finance on FDI. Exploring the role of FD in attracting FDI relied on OECD’s database for FDI statistics, the author drew financial variables from the WDI Database and the FD Database of IMF. In the study, the financial system encompasses 25 indicators covering the financial market, FD, stock market, and banking governance. The results of the two-step IV-GMM exhibit that the host country’s efficient financial system with diversified sources of funds acts as a key determinant of FDI inflows increasing the multinational firm participation in the EG. Several recent studies on the FD and EG bond have found an inverted U-shaped connection between FD and growth, portentous that FD promotes EG up to a certain threshold, beyond which the effect of FD on EG disappears or becomes insignificant (Arcand et al., 2012; Beck et al., 2000; Law et al., 2018; Samargandi et al., 2015).
Finance-Growth Nexuses Realities in Africa
Focusing on seven sub-Sahara African economies Enisan and Olufisayo (2009) applied the ARDL and VECM to provide an empirical study of the causality and long-run connection between stock market development (SMD) and growth. The study supports that while Nigeria does not display any significant relationship between FD and growth, in South Africa and Egypt, economic performance and stock market development are cointegrated, furthermore, in the long-run, SMD positively and significantly influences EG, and in both countries, the causality runs from SMD to EG. In the case of Morocco, Ivory Coast, Zimbabwe, and Kenya, the result shows the existence of two-way causality between growth and SMD. The work of Adjasi and Biekpe (2006) uses panel data of 14 African economies to examine the relationship between SMD and economic performance. The findings indicate that there is a positive link between SMD and growth, for a more precise, positive, and significant effect of SMD on EG is found in middle-income countries. Adjasi and Biekpe (2006) explain that in an economy, capitalized markets have to exist at a moderated level for SMD to exert a considerable impact on growth, their study poses that if African countries with the weak stock market and low income expect their EG to benefit from stock markets they will have to improve the extent and activities of their stock markets. N’Zue (2006) focuses on the case of Ivory Coast to examine the link between SMD and EG from 1976 to 2002. The findings show that there are a co-integration and long-term relationship between SMD and EG, with a one-way causality running from the development of the stock market to growth. The FD is beneficial for EG in general, but this consensus is not true for all sizes and levels of FD. If “more finance, more growth” holds only up to a certain point, FM may have a role in interceding the effects of FDI on EG. Nonetheless of the hypothetical and empirical prominence of FDI role in EG, empirical evidence on this issue remnant incomprehensible. The study of (Xuezhou et al., 2021) shows that there is a bi-directional causal relationship FD and EG.
Data and Econometric Method
Variables and Data Source
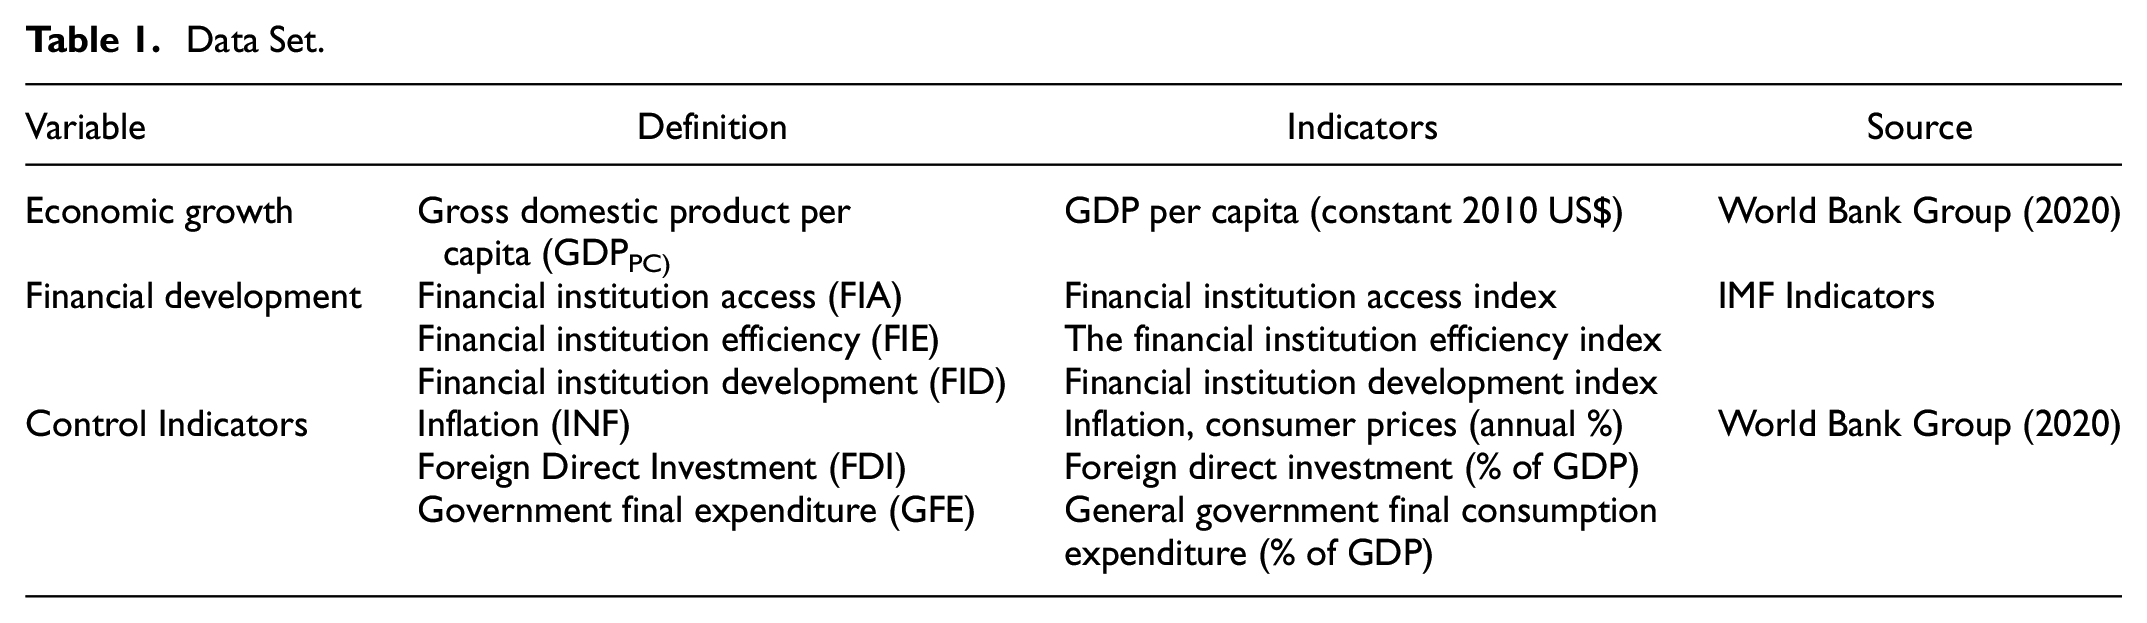
Table 1 reports a summary of the data set, variables, definition, indicators, and data source. This paper examined the finance-growth nexus in the finance industry and the influencing factors of some control economic indicators using panel data on 34 countries (Appendix) which incorporate economic growth (GDP per capita), and financial development indicators (FIA, FIE, and FID). The information was accomplished from the World Bank Group (2020) and IMF. The information per each factor was changed into a common logarithm to derive the parameter approximations with regards to the definitiveness of the reliant indicator. The underpinning variables’ sources and descriptive analysis are summarized inTable 1, and the descriptive statistics amid the inherent variables are reported in Table 2. The correlation coefficient results show that GDP is correlated with FD-EG, implying that the preliminary analysis supports both the market-based and financial service viewpoints. World Bank Group (2020), explains the meaning of the variable FD. The EG variable is expressed in the previous literature as GDP per capita. Knowledge of EG reflects people’s perspectives on the subject, which promotes people’s well-being. Economic growth comprises not only the large forms of progress that most people are familiar with but also some smaller forms of growth. The multivariable model in this study included inflation, FDI, and GFE. Inflation is defined as an increase in the prices of most goods and services that are used on a daily or frequent basis, such as food, clothing, housing, recreation, transportation, basic consumer goods. Inflation is defined as the average price change over time of a basket of goods and services. Trade liberalization measures the proportion of total GDP exports and imports, reflecting the amount of foreign exchange within GDP percent. Foreign trade’s impact on local demand is extensively discussed. Exports are regarded as one of the most important components of the national economy in macroeconomics. Furthermore, foreign trade creates a new generation of workers in the country, which will eventually lead to an increase in national production. The IMF states that FD is built using highly complex data indexed summary expending an ordinary three-step methodology found in the literature: (i) variable standardization; (ii) accumulation of stabilized variables in sub-indices animated a specific functional dimension, and (iii) combination of subscripts in the final index. The optimal balance of GDPpc, FD, EG markets, and mediators (or, what amounts to risk sharing and growth) designates that economies based on the market always benefit from higher growth, whereas economies where households are expected to be more risk-averse benefit from lower growth. As a result, it is reasonable to assume that GDPpc in our paper is a dependent variable with different positive marginal effects that determine both the existence and the direction of the independent indicators and the control indicators. Based on the estimation procedures, we retained inflation, FDI, and GFE to control their impacts within the model. The potential control variables such as inflation, FDI, and GFE were found to be jointly influencing the finance-growth and may prevent model uncertainties (Dufrenot et al., 2010). In addition, we found that the variables are highly correlated with other key macroeconomic variables that may pose threats to the stability and convergence of the models used in the study. The control variables used in this study are similar to the variables controlled in studies by (Al-Moulani & Alexiou, 2017; Arcand et al., 2012; Omri et al., 2019).
Data Set.
Descriptive Statistics and Correlation.

, **, and *represent significance at 1%, 5%, and 10% levels, respectively.
Descriptive Statistics
The inferential analysis is shown in Table 2 for the indicators of FD and EG for the period 1980 to 2017, which are presented in percentages (%). Averagely, GDPpc over the sample study is 7.94$ representing low income for the developing African countries. GDPpc is interpreted as the large standard deviation across income differences in Africa. Over the study period, GFE averaged 2.5% relative to INF, which equaled 1.848%. FID as a percentage of GDP is also 0.28%, with no significant variances amongst countries. To assess the relative dispersion of the variables, we determine the coefficient of variation as the ratio of the standard deviation to the mean. Given the high values, FID is the most volatile variable. In terms of kurtosis, all the variables with sharp measurements (FDI, INF, GFE, FIE, and FID) are leptokurtic because their inducements of kurtosis are all around 3, with the exception of GDP and FIA, which are mesokurtic. Table 2 shows that for tolerance values of less than 0.2 and VIF values less than 5, there is no multicollinearity between predictors, indicating that the variables are independent of one another and can thus be called independent variables.
Panel Unit Root and Cross-Sectional Dependency
The results of the panel unit estimation on CADF and CIPs Pesaran maintains its strength in the facet of heterogeneity and cross-section, as seen in Table 3. The study focuses on continuous evaluation to produce good trend indicators. For all the panels that can be rejected, both calculations explain the H:0 of nonstationarity of the metrics. This ensures that the variables do not have a unit root. After confirming that the variables at levels and first difference do not have a unit root. Our results confirm a study by Song et al. (2021), that indicates a long-run cointegration and causal relationships exist between EG-FD and corruption in the long run.
Panel Unit Roots and Cross-Section.

, **, and * indicate significant at 1%, 5%, and 10% level, respectively.
Model Estimation
An Extended Solow Growth Model
This paper examined the finance-growth nexus in the finance industry and the influencing factors of some control economic indicators. We use the ordinary expectations in the literature to simplify the theoretical analysis. To begin with, the economy is closed, with only the financial and real sectors operating. As a result, global capital can be separated into two categories: financial capital (FK) and physical capital (PK). FK includes two types of capital raised through financial management and financial institutions. Second, it is assumed that a country’s economic structure remains untouched, that the technology process is impartial, that capital flow generously, and that the capital-labor combination is efficient. The financial performance can be written as follows:

where Y, Kr, Km, Ki, and K signify real output, FK, PK, FMK, and TSC, correspondingly. Moreover, assumed the proposition that capital from diverse segments is equal, and under the circumstances that the physical capital is standardized and proceeds to scale are unceasing equation (1) can be modified as:

let y = Y/Kr mean output per PK, km = km/kr designate the ratio of FMK over PK, and ki = ki/kr symbolize the ratio of FK to PK. Then, can be articulated as FD = Km/ki = km/kb and the PF can be inscribed as;

From equation (3), the terms
and

supporting the law of diminishing MP, we achieve the succeeding results: (i)
The Existence of Financial Development
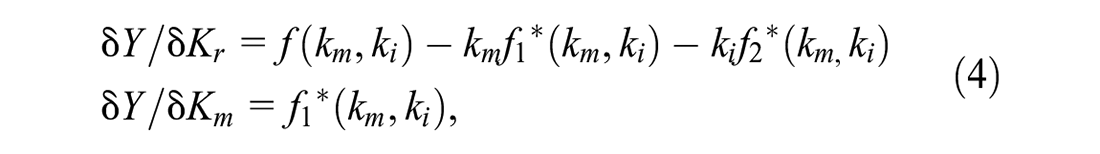
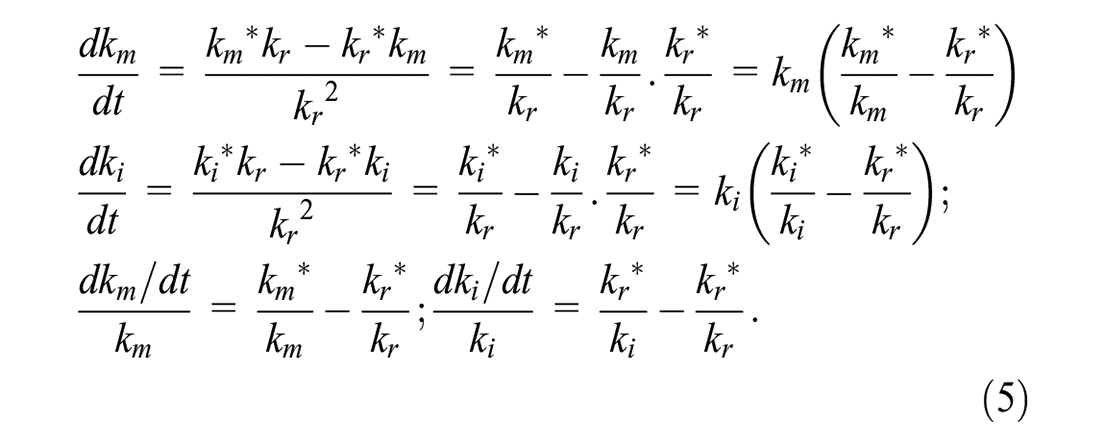
Under the previous expectations, it is clear that the form and nature of the PF (3) are reliable with the neoclassical model acclaimed by Solow (1956). Also, derivation based on the above calculations offers convenient outcomes as follows. First, variations in the number and level of FK divided by PK are:
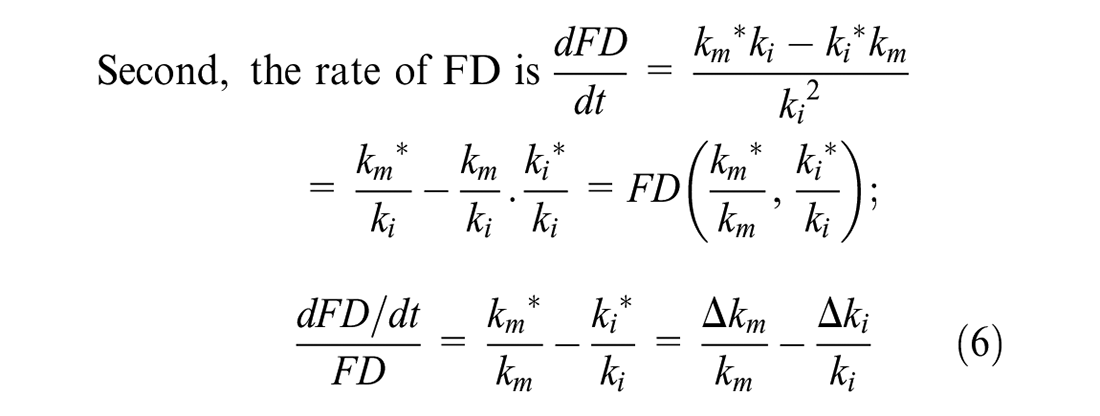
Third,

Let
Equation (7) can be changed into:

where n is the growth rate of PKS, δ(km) epitomizes the productivity resistance of FM and
Besides, let

According to equations ((5)–(8), when the industry is in balance, the growth rate of EG is n, and

Therefore, the optimum FD is liberated of the growth rate of PK n but hinges on the ratio of the amount of change in FMK, Km*, and FI capital, Ki*. The PVAR model is neutral against specific growth theories making the model more based on contemporary movements from a series than on certain macroeconomic dynamics concepts, which, if not agreed, can distort (Kireyev, 2000). The general procedure for PVAR employed by Love and Zicchino (2006) is represented as:

A(L) = A1L1 + … + Ap-1Lp-1 + ApLp. δt represents the dummy variables for the country’s specific time, and εi,t denotes errors, with
Equation (11) can be updated to depict systems of procedures that integrate the study’s variables, such as:


The PVAR estimate will follow the procedures of Arellano and Bover (1995) mean-differencing or “Helmert Procedure,” which consequently preserves orthogonality between converted and lagged independent variables (Love & Zicchino, 2006). In this case, the quantile regression technique is used to estimate our results on various quintiles of the dissemination and provide heterogeneous retorts. PQR is known for its robustness to outliers and capacity to capture crucial associations that OLS and other traditional econometric methods failed to capture. We used the recent PQR method (MM-QR) of Machado and Santos Silva (2019). Unlike earlier PQR methods, MM-QR is used to estimate results through moment conditions (Machado & Santos Silva, 2019)that do not assume the presence of the moment function or make distribution assumptions. Therefore, we consider estimating the quantiles

where Qτ denotes PQR parameters of the τth point, τ indicates the point for the independent variables. Thus, equation (14) denotes the PQR equation of EG being regressed on fixed effects (
Empirical Results and Discussion
FD-Economic Growth
We implemented Sasabuchi-Lind-Mehlum (SLM) test to exam for finance-growth nexus in Africa (Lind & Mehlum, 2010). According to Table 4 Optimal FD-EG, both the coefficients of the linear and quadratic terms of the FD variable-FD, FIE is positive and statistical significance suggesting an evolutionary stage of FD in Africa Figure 1 affords the plots of the coefficient approximations with all the control variables. From panel (b, c, d) inflation had a significant positive impact on EG except for panel (a) which is significantly negative with less impact on EG which supports Rousseau and Wachtel (2000) showed that the FD-growth nexus depends on the rate of inflation. Also, from panels (b, c, d) FDI had a significant negative impact on EG except for panel (a) which is significantly positive with and has a high impact on EG. Similarly, GFE had a significant positive impact on EG for all the panels. The panel’s a–e in each figure provide the estimation results for the West, South, North, Central, and East districts. However, both the coefficients of the linear term of the FD variable–FIA is positive and statistically significant while the coefficient of the quadratic term is negative and statistically significant suggesting an optimum stage of FD in Africa. Thus, the findings show that FD in Africa depicts the evolutionary stage and optimum stage of EG. The findings of this study support the study of Liu and Zhang (2020) who revealed that there is no fixed optimum FD at different stages of EG in China. Conferring to the fitted values for the regression line in Figure 1, the coefficients for the FD in the West and South districts are roughly 14 and 12 with a downward slope, whereas that in the East district tends to upsurge as the economy progresses. Thus, expanding the value of corporate markets in the FS may result in a greater improvement in GDP in the central province, implying that the uneven district expansion between the West and North areas is larger, whereas that amid the central districts is smaller. The findings reveal that in the finance-growth nexus, the level of FD matters; the greater the level of FD, the more finance fosters growth. However, there is a point beyond which additional FD stifles EG. In other words, too much finance stifles growth. In addition, the financial system (bank- or market-based) has an impact on EG. The policy consequence is that emerging countries should work to speed up the development of their financial systems to boost EG. It may be vital for industrialized countries to keep a close eye on their financial systems’ development, as excessive FD is detrimental to EG.
Optimal Financial Development-Economic Growth.

, **, and * indicate significant at 1%, 5%, and 10% level correspondingly.

The trend of FD-EG growth among the regional countries of Africa.
Higher degrees of macroeconomic instability, such as inflation, real exchange rate, indebtedness, and fiscal deficits, are detrimental to the finance-growth nexus, according to our findings. As a result, in a stable macroeconomic environment, finance has a bigger impact on growth than in an unstable macroeconomic environment. Furthermore, for a healthy pace of financial sector expansion, a stable macroeconomic environment is required.
Panel Quantile Regression Result
Though we estimate for OLS to provide a basis for developing judgments of how different levels of EG respond to the impact of FD, we do so for comparison purposes. We estimate three different quantiles to provide detailed findings from the PQR estimates (25th, 50th, and 75th). The PQR findings are presented in Table 5, FDI had a positive significant impact on EG at all levels of quantiles and the marginal impacts increases from 25% to 75% whiles the comparable OLS for FDI report a positive significant impact on finance-growth. Also, inflation had a negative significant impact on EG at all levels of quantiles and the marginal impacts decreased from 25% to 75% whiles the comparable OLS for inflation report a negative significant impact on finance-growth while GEF had a positive significant impact on EG at 25% to 50% quantiles. This study shows that high macroeconomic stability helps to strengthen the finance-growth nexus, whereas low economic stability hinders it. The policy conclusion is that to gain the long-term economic benefits of FD, developing countries should strive for low and steady macroeconomic stability. To attain the required macroeconomic stability, it may be important to use the appropriate fiscal and monetary policies.
FD-EG in Africa.

Note. All regression includes year dummies to minimize year shocks.
, **, and * indicate significant at 1%, 5%, and 10%.
The PQR results in Table 5 indicate that, after controlling for other determinants of EG, FIA had a markedly strong outcome on EG at all parametric levels, but the marginal effect rises from low percentiles to greater percentiles 1%, a 1% rise in FIA will lead to a 0.144% to 0.186% rise in EG from moderate (25th percentile) countries to strong growth (75th quantile). As a result, countries with a strong mind are more positioned to gain from increased FIA than countries on a moderate path. When other growth determinants were considered, FID had a strong positive effect on EG at all parametric levels at a 1% significance level. The absolute value increases directly with quantile level, indicating that countries on a strong path are better positioned to benefit from increased FID than countries on a minimal path. As a result, a 1% increase in FID leads to a 0.057% to 0.077% rise in EG from low-growth to high-growth countries. In conversely, FIE had a significant positive effect on EG at the 5% level of significance in high-growth countries but not in low and moderate-growth countries. Thus, a 1% increase in FIE results in a 0.076% to 0.153% in EG from nations in the 50th to 75th percentiles, respectively. This study’s findings generally support previous research (Beck et al., 2004; Kpodar & Singh, 2011) that found that FD promoted EG at various stages. Following previous findings, this study contends that FD has different or heterogeneous effects on EG in high and low-growth markets. Sethi et al. (2020) investigate the environmental sustainability effects of globalization, FD, EG, and energy consumption. The paper’s novelty reveals that the development of the banking sector has an impact on environmental sustainability via the EG channel. To strengthen this argument, we employ a graphical method to depict the marginal effects of FD on the EG of countries at various levels of growth. Figure 2 depicts a graphical picture of the PQR and OLS results of the FIA, FIA, and FID effects on EG. The PQR coefficients around the coefficients fluctuate considerably with the various EG percentiles, whereas the OLS method (dotted line) relics constant in the chosen quantiles.
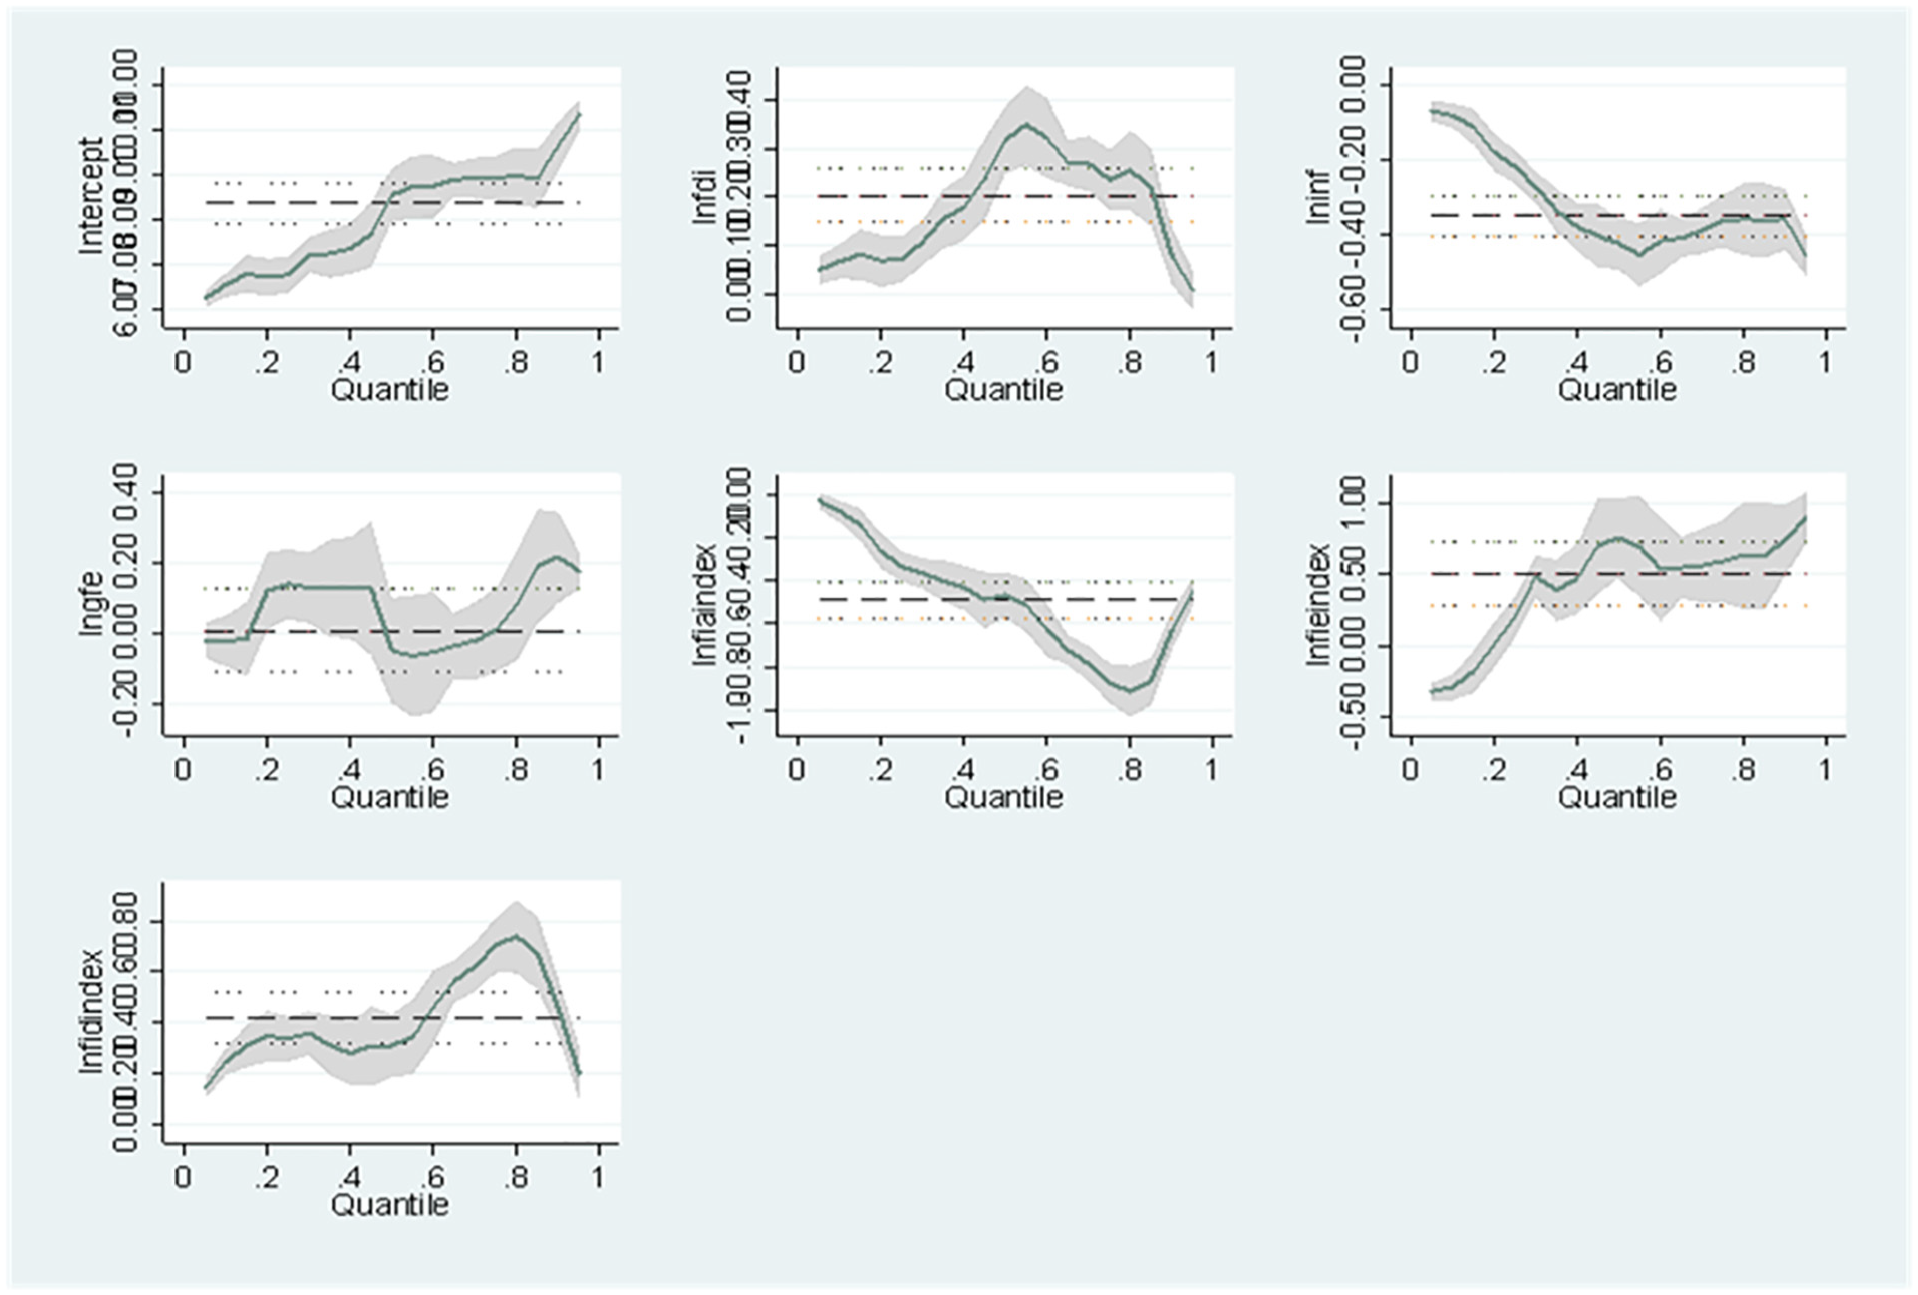
PQR of the impacts of FD on EG.
GMM Style Panel Vector Auto-Regression (VAR) Results
On the premise of equation (11) using the GMM style, we forecasted the first-order lag PVAR model and chose the best lag. The PVAR forecasts for African economies are shown in Table 6. In West Africa, inflation had a significant negative impact on finance-growth while the other sub-regional countries (South, North, Central, and East) report significant positive impacts on finance-growth. FDI in the West, report a significant and positive impact on growth while North, Central, and East had a negative significant impact on finance-growth. Finally, GFE had a negative significant impact in the North, Central, and East while low macroeconomic stability impedes finance-growth in Africa.
Results of PVAR Across the Regions in Africa.

, **, and * show significant at 1%, 5%, and 10% level correspondingly.
At a 5% probability value, the FIA had a considerable effect on the EG of West, South, and Central republics, according to Table 6. However, the gross amount is higher in West republics than in South and Central republics, insinuating that EG in West republics will fall more as a result of aggregate FIA than in other republics. Thus, a 1% growth in FIA results in a 0.045%, 0.014%, and 0.018% shrinkage in the EG of West, South, and Central republics. At a 1% significance level, the FIE had a strong positive influence on the EG of West republics but a substantially adverse effect on the EG of Central and East republics. This study discovered that increasing FIA increases growth in West republics while shrinking growth in Central and East republics. As a result of a 1% increase in FIE, the EG of West republics will soar by 0.064%, while the EG of Central and East republics will fall by 0.028% and 0.018%. As a result, this study found mixed results for FIE and EG, with opposing marginal effects across districts. Lastly, the outcomes display that FID has a direct moderating impact on the EG of West and East African republics at 1% and 5% significant levels. As a result, a 1% increment in FID will stem in a 0.027% and 0.013% increase in the EG of West and East republics. Depending on other growth determinants, West republics will increase their EG swiftly than East republics. Overall, the results of this study on FD and EG are conflicting. It does support the two opposing viewpoints in the literature on FD and EG: FD is unrelated to EG (Beck et al., 2000) and FD has a significant impact on EG. In regards, Lee and Wang (2022) investigate the relationship between FD, ICT diffusion, and EG by taking into account the interdependence of finance and ICT. Fortunately, this study clarifies the mixed findings by proving that the mixed outcomes should be viewed via the viewpoint of local markets with fluctuating levels of FD; thus, regions with well-developed FD may find FD contributing considerably to EG, whereas regions with less industrialized or unbalanced FD may find FD having mixed or no effects on EG.
PVAR Granger Causality Results
We then proceed to apply the Granger causality test, which is premised on the Wald test (Abrigo & Love, 2016). The H:0 asserts that there is no causality. The granger causality results are presented in Table 7.
PVAR Granger Connectedness Results Across Regions in Africa.

Note. For presentation and clarity purposes the results for the control variables—FDI, INF, and GFE are not shown in this table.
, **, and * specify significant at 1%, 5%, and 10% level, respectively.
The granger causatives outcomes show a two-way link amid EG and FIA among South and Central African republics but a one-way causative link from FIA to EG among West African republics and a one-way pivotal link from EG to FIA among North African republics. The findings show that the EG and FIA to South and Central African republics are inextricably linked, and thus changes in one variable have a direct impact on the other. Regrettably, the two-way causative links appear to be stronger from EG to FIA among South African republics, whereas the impacts appear to be stronger from FIA to EG among Central African republics. Comparably, there are bilateral causal links between EG and FIE in West, Central, and East republics, but only a unidirectional causal association amid FIE and EG in South and North African republics. Furthermore, the findings revealed a unidirectional causal relation amid FID and EG in West and East African countries, as well as a one-way causative association amid EG and FD in South and North African republics. Given the causative associations revealed in this study, it is clear that this study supports the argument of heterogeneity in FD and EG impacts among African republics (Luintel et al., 2008; Pesaran & Smith, 1995). In addition, Shahbaz et al. (2013) empirically examined the relationship between FD, energy consumption, and EG in India from 1970 to 2018. The ARDL-bound tests and the VECM method were used in the study. In the short term, the Granger causatives test results show a unidirectional association from EG to FD. In the long run, however, we find a two-way causal association amid EG and energy consumption, as well as energy consumption and FD.
Variance Decomposition Results
We estimate the variance decomposition (VD) to provide details of the way FD explains the variations in EG across the regions in Africa over the period. The variance decomposition estimates had been acquired from the orthogonalized impulse reaction coefficient matrices. We center our construal of the variance decomposition on the 10th period where the FD variables have the highest explaining power of the opposite (Table 8).
Results of Forecast Error Variance Decomposition.

The result displays that FIA, FIE, and FD approximately explain 1%, 22%, and 14% correspondingly of the variance in the EG of West republics in the 10th period. Thus, among the three financial variables, financial institutions’ efficiency has the highest explanatory power in the EG of West African countries while financial institutions’ access has the weakest explanatory power. Furthermore, the result shows that FIA, FIE, and FD approximately explain 18%, 3%, and 2% respectively of the variation in the EG of South African republics in the 10th period. In contrast to West African countries’ finance-growth pattern where financial institutions access has the weakest explaining power, among Southern African countries’ finance-growth, financial institutions access has the highest explaining power among the three financial institutions variables. Among the North African countries, the financial institution’s efficiency has the highest explaining power in terms of variations in EG with approximately 36%, which is more than the explanatory power (34%) of EG itself. Also, financial institution access and financial development explain approximately 11% and 0.3%, respectively. Additionally, FIA, FIE, and FD explain approximately 5%, 7%, and 2% respectively. Among the East African countries, approximately 74% of the variation in economic growth is explained by economic growth itself thus leaving financial institutions to access, financial institutions’ efficiency, and financial development with approximately 1%, 3%, and 4%, respectively. The vector error decomposition results provide further evidence to support the strand of studies (Beck et al., 2000, 2004) that argues FD has a significant impact on EG. Also, Nasreen et al. (2020), used a composite index of FD to cover various dimensions of the financial market, that is, depth, FIA and FIE, and four-way classification of institutions as suggested by (Law et al., 2018), the empirical results indicate that EG are associated with FD. Generally, the results show that among the FD variables, the FIE has the highest explaining power in terms of variables within EG for most of the regional economies in Africa.
Conclusion and Policy Recommendation
The following are the key conclusions of this study based on the review: First, despite the presence of alternative views, unwavering support exists for the mixed results in terms of the impact of FD on economic progress in Africa. This means that a higher degree of EG encourages the FD-EG nexus, but a lower level of economic development may suppress it. The PVAR and PQR approaches were used to investigate the impact of financial development on economic growth, which is influenced by the level of some economic stability indicators (FDI, INFLATION, and GFE). We discovered that financial-growth nexus differs among Africa’s sub-regional republics at different phases of development. The following is a summary of the findings:
With the optimal financial-economic growth report from panel (b, c, d) inflation had a significant positive on EG except for panel (a) which is significantly negative with a less impact on EG. Also, from panel (b, c, d) FDI had a significant negative impact on EG except for panel (a) which is significantly positive with a high impact on EG. Similarly, GFE had a significant positive impact on EG for all the panels. The review shows that the macroeconomic stability indicators (FDI, INFLATION, and GFE) affect the FD-EG nexus, which states that the higher the FD, the more finance encourages growth. However, there is a point at which the financial sector’s development obstructs EG’s progress. Also, too much finance impedes growth. Furthermore, the financial structure has an impact on EG.
The quantile results report that FDI had a positive significant impact on EG at all levels of quantiles and the marginal impacts increases from 25% to 75% while the comparable OLS for FDI reports a positive significant impact on finance-growth. Also, inflation had a negative significant impact on EG at all levels of quantiles and the marginal impacts decreases from 25% to 75% while GEF had a positive significant impact on EG at 25% to 50% quantiles. This study shows that high macroeconomic stability helps to strengthen the FD-EG nexus, whereas low macroeconomic stability hinders it. The policy conclusion is that to gain the long-term economic benefits of FD, developing countries should strive for low and steady macroeconomic stability. To attain the required macroeconomic stability, it may be important to use the appropriate fiscal and monetary policies.
the GMM style PVAR results present a mixed effect in terms of the connection and marginal significance, indicating that FD has a different impact on EG. Our findings need not be interpreted as a rejection of the perspective of FD-EG nexus, but as an alternative means that may replicate mismatch issues in African and the distribution of EG.
Last, the granger causality results show a two-way causal association amid finance-growth in Western, Central, Eastern, and Southern African economies and a unidirectional causal link of finance-growth in Northern Africa. In general, there is a long and short-term relationship between finance-growth and the economic indicators that influence the finance-growth nexus which supports that the higher the level of FD, the more finance promotes growth.
From a policy perspective, by researching the problem from the subregions, the study aims to give empirical findings not only for comparison but also for specific regional policy decisions. We fill this research void by bringing together empirical evidence showing FD-EG nexus and the impact level of macroeconomic stability indicators (FDI, INFLATION, and GFE). Our goal is to examine the elements that influence the FD-EG nexus to provide researchers with a picture of existing research and to identify policy implications for future research investigations. Understanding the elements that influence finance-growth nexus will be used to help policymakers in various sub-regions formulate policies. As a result, policymakers must have a thorough understanding of the factors that promote or inhibit the FD-EG nexus to create policies that will help finance drive EG. Policymakers will be able to properly prioritize these variables in their drive to boost EG via the financial sector if they have a thorough knowledge of their effect. This study sheds light on how economic indices impact FD. This study underlines the need for solid associations for FD and growth by combining empirical information from prior studies. It also emphasizes the importance of macroeconomic stability for countries to reap the long-term economic benefits of FD. In the finance-growth nexus, the level of FD and EG is also important. As a result, future research should take these factors into account when estimating the impact of FD on EG. Finally, this study provides policymakers with the required policy options for FD to boost EG. Comprehensive established transformations, the conservation of continual macroeconomic stability, and the design of policies that can improve FD and EG are examples of policy possibilities.
Footnotes
Appendix
List of Countries.

| Benin Burkina Faso The Gambia Ghana Liberia Niger Nigeria Senegal Sierra leone Togo |
Botswana Lesotho Namibia South Africa |
Algeria Libya Morrocco Sudan |
Cameroon The central African Republic Chad Congo Dem. Rep Gabon |
Burundi Comoros Ethiopia Madagascar Mauritius Mozambique Rwanda Seychelles Tanzania Uganda |
Declaration of Conflicting Interests
The author(s) declared no potential conflicts of interest with respect to the research, authorship, and/or publication of this article.
Funding
The author(s) received no financial support for the research, authorship, and/or publication of this article.
Data Availability Statement
Financial Access Survey, 2019. International Monetary Fund, http://data.imf.org/?sk=F8032E80-B36C-43B1-AC26-493C5B1CD33B. World Bank Group (2019) World Development Indicators 2019, Washington DC: World Bank. [Dataset for GDP, FDI and Trade]. ![]() .
.