
Abstract
This paper examines the responses of stock traded and economic activity in relation to central bank independence shocks. The analysis is based on a panel Vector Autoregressive estimation covering 25 developing countries for a quarterly period between 1990 Q1 and 2021 Q4. Panel VAR estimation is known to be potentially biased in a dynamic panel data model if the coefficient on the endogenous variables differs across countries. To test the pooling assumption of the model, this paper applies the Chow and Roy-Zellner tests. The results establish that the models contain the heterogeneity among samples; thus, mean-group estimation for panel VAR is performed as a solution for heterogeneity problem. The results show that there is a delayed effect of CBI to increase stock traded. This demonstrates that CBI takes around six quarters to strengthen the financial market. By dividing the sample into two groups, we find that CBI has a different effect on stock traded for countries that have high and low stock traded.
Introduction
Central bank Independence (hereafter, CBI) became a fashionable issue among economist in the last three decades. In the beginning, CBI is adopted to combat high inflation to make price stability. Seminal paper of Kydland and Prescott (1977) show theoretically that CBI is the best tool to eliminate inflation bias due to time inconsistency in monetary policy. Cukierman et al. (1992) show an empirical evidence that CBI has a reverse relationship on inflation in advance counties. After succeeded create price stability in developed countries, many developing economies reform their central banks to increase the degree of CBI with the aim to reduce inflation.
According to Bodea and Hicks (2015), a higher CBI index is a positive signal to encourage investment since the more credible the central bank is perceived to be in setting and implementing monetary policy, the more independent it is. This view is supported by theoretical and empirical analysis of Smets (2014), Belke and Beckmann (2015), Sari et al. (2017), and Rahman and Ermawati (2020), that optimal monetary policy increases stock market. In developing countries, international financial integration causes financial market, particularly stock market, become the most favorite instrument for investors. As a result, central bank should establish good expectation for market participants, and hence boost the stock market. Since stock market provides a competing source to mobilize capital, thus, stock market becomes an attractive institution for companies in developing countries to obtain external capital (Nwosu et al., 2019).
Prior empirical studies have investigated the influence of CBI on stock return such as Förch and Sunde (2012), Kurihara et al. (2012), Papadamou et al. (2017), and Garcia and Costa (2019). They find a positive effect of CBI on stock price return. There are some limitations of those studies on the influence of CBI on stock market: (i) their studies mostly focus on developed countries; (ii) none of the studies investigate stock market capitalization or stock traded per GDP; and (iii) they fail to to explain the differences in the impact of the CBI on the stock market in different countries. We suggest that the influence of CBI on the stock market differs across country. This diversity reflects the central bank’s varied qualities in accomplishing its monetary policy aim, as well as variation in the structure of macroeconomic factors. These issues arise a research gap on the effect of CBI on stock market. The main motivation of this paper is to fill this research gap.
This study offers an empirical evidence on the responses of stock market capitalization to CBI shock. We provide three main contribution in this study: First, we estimate a panel VAR on a set of 25 developing economies for which the stock exchange was particularly existed and has a reform in their central bank. The paper focuses on developing countries because the effect of CBI on macroeconomic variable differs among developing countries, such a diversity may be caused by financial structure among countries. Then, investigate a heterogeneity effect of CBI on stock traded in developing countries to be a challenging for researchers. Second, we check the homogeneity assumption in the panel VAR model to identify a heterogeneity effect of CBI shock on stock traded, consumption, and investment. We perform Chow and Roy-Zelner test following Baltagi (2008). Third, we apply the mean-group estimation developed by Pesaran and Smith (1995) to investigate the average shock of CBI on stock traded, consumption, and investment. For that purpose, we run a VAR model for each country then we average the coefficient of the shocks. This provides us with a group of impulse response functions (IRF) based on an average of all country samples.
Our results suggest that the stock traded decreases due to CBI changing at the beginning until period six after the shock but after period six, the response is positive. This demonstrates that there is delayed effect of CBI to strengthen the financial market. The stock traded has a positive impact on both investment and consumption. This signifies that higher stock traded initiates higher investment and consumption. We ascertain that CBI has a positive influence on both investment and consumption. We divide our sample to be two groups based on the proportion of traded stocks to GDP. We find the different responses of stock traded to CBI shock for both groups. However, the effects of CBI and stock traded on consumption and investment are the same for both groups.
Literature Review
After the financial crisis of 2007 to 2009, the role of the central changed to the apparent increase in financial instability (Anwar, 2022). Associated with financial instability, Bernanke and Gertler (1999) argue that financial instability is closely interconnected with asset price fluctuation. The role of CBI to affect financial asset prices can be explained as follow: central bank reform (change in the degree of CBI) will alter the public’s expectation of inflation. Then, if the public perception of inflation change, the asset price should also change due to the sensitivity related to inflation. This means that financial asset prices contain information pertaining to future inflation. Smets (2014) explained two key reasons concerning the relationship between financial asset prices and expected inflation. First, aggregate demand change is directly due to a change in asset price, whilst second, financial asset prices depend on future return expectation, such as future economic activity, inflation, and monetary policy. These changes highlight the importance of investigating the relationship between CBI and financial asset prices. Claessens and Kose (2017) categorize asset price into stock market, house prices, exchange rate, and interest rate.
Since the last two decades, most intriguing research topics in macroeconomic policy has been the impact of central bank policy on asset prices. Rigobon and Sack (2004) estimated how asset prices respond to an alter in the Fed policy using daily data from January 3, 1994, to November 26, 2001. They performed identification by means of the heteroskedasticity method which relies on examining interest rates and asset values vary when one of the system’s shocks shifts. Hence, asset prices respond to the interest rate can be measured. They claimed that stock index has a negative respond to monetary policy.
Based on a data set for 20 emerging nations from 1992 to 2006, Moser and Dreher (2010) investigated the influence of changing the central bank’s governor on the exchange market, local stock market, and sovereign bond spreads. They imply that financial markets respond positively to the appointment of a new central bank governor. Their findings demonstrate that replacing the central bank’s governor has a detrimental impact on the financial market. Kurihara et al. (2012) examine the connection between stock market return and CBI for 14 developed countries and 9 developing countries from 1989 to 2007. For the entire sample and advance nations, they discovered a positive and substantial association between CBI and stock market return, but they were unable to obtain the same finding for developing nations.
The effect of CBI on stock market return from 1988 to 2007 in 27 emerging markets has been analyzed by Förch and Sunde (2012). Their initial study test the stock market returns before and after changes in CBI in relate to how CBI affected stock market returns. According to their findings, changes in CBI are positively correlated with stock market returns more than a month following the changes. They employ fixed effect panel data estimate in their second study. They discover that CBI has a positive and significant impact on stock market returns, indicating that CBI looks to be advantageous in terms of market performance.
The impact of CBI on stock market volatility was examined by Papadamou et al. (2017). Their sample including 29 developed and developing nations for annual data for the years 1998 to 2005. They show that CBI has a positive and significant effect on both the current and past volatility of the stock market. Garcia and Costa (2019) test the effect of CBI on stock market return for the data of 35 developed economies for the period 1988 to 2007. They confirm that CBI has a positive impact on stock market return. Anwar (2021a) studied the effect of CBI on stock price in seven developing countries and found that CBI effectively improve stock price. Anwar (2022) examined the effect of CBI on exchange rate in developing countries. Using panel data for developing countries, he showed that the effect of CBI on exchange rate different among countries. He found a puzzle effect of CBI on exchange rate in developing countries, meaning that it takes time for CBI to appreciate the exchange rate.
From the above research questions, our research hypotheses are:
H1: CBI has a positive effect on stock market
H2: CBI has a positive effect on investment
H3: CBI has a positive effect on consumption
H4: Stock market has a positive effect on investment
H5: Stock market has a positive effect on consumption
Econometric Methodology and Data
Econometric Methodology
Using a panel VAR suggested by Anwar (2021b), we examine the influence of CBI shock on the stock markets of emerging nations.

where


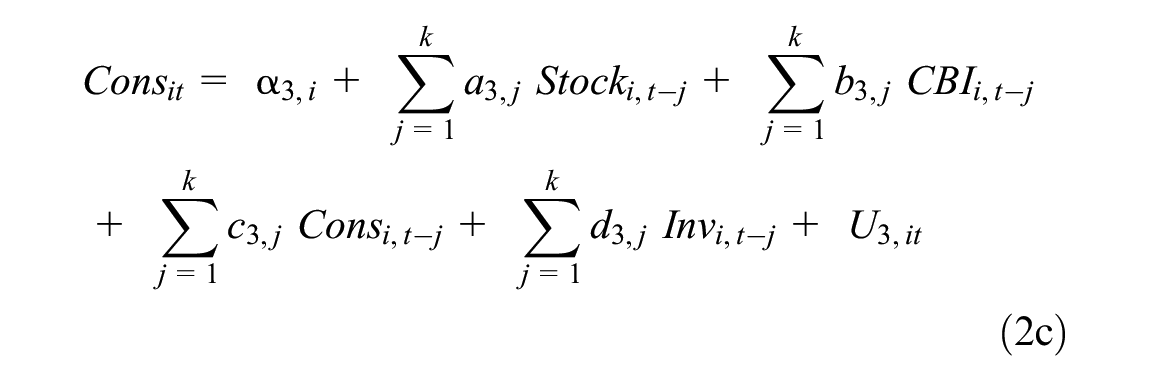
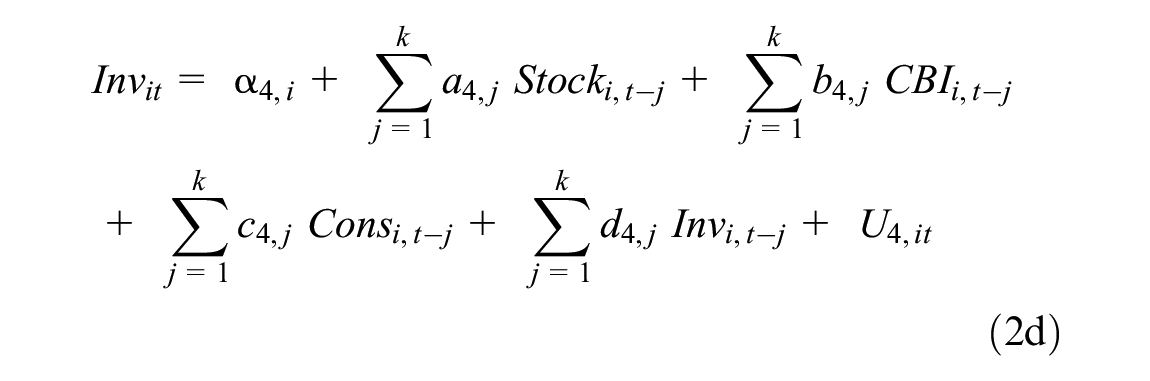
In equations (2a–2d), the panel VAR models are estimated using pooled least squares (POLS). The POLS estimator is biassed in a panel setting due to heterogeneity problem (Anwar, 2022). Each group’s restricted model is:

Where

where
The null hypothesis of the probability test is:

The Chow and Roy-Zellner tests suggested by Baltagi (2008) are used in this paper to explore the model’s heterogeneity coefficients. We suggest that there exist a heterogeneity in the model. Hence, the mean-group estimation approach provided by Pesaran and Smith (1995) is one way to address the heterogeneity issue. In particular, let

By averaging each period’s impulse response function for each unique countries, the same operations are carried out for impulse response function.
Data
We then investigate the interrelationship between CBI, stock trade, consumption, and investment for 25 developing countries (see Appendix). Our dataset consists of four variables: CBI, exchange rate, household consumption, and investment. Quarterly data over the period 1991 quarter 1 to 2021 quarter 4 are applied.
The CBI index data was acquired from Garriga’s (2016) data set. The legal index has an index between 0 and 1, with higher values indicating a higher CBI. We use the total value stock traded per GDP as a stock market capitalization. This paper uses household consumption and investment following Claessens and Kose (2017). The reason why this paper uses total consumption and investment is because Consumption accounts for the majority of production, whereas investment is the most variable component of GDP (Beaudry et al., 2015). The data are obtained from the IFS of the IMF.
Summary Statistics
The descriptive statistic in Table 1 show that during the period 1991 Q1 to 2021 Q1, the average stock traded per GDP was 15.7539, with the minimum was 0.0058 and the maximum was 355.5198. The average CBI degree was 0.5672 with the lowest was 0.1345 and the highest was 0.9512. The average private consumption, 237 billion US Dollar with the range between 1.76 and 8,000 billion US Dollar. Finally, investment had an average of 125 billion US Dollar with the lowest was 30.1420 billion US Dollar and the highest 6,180 billion US Dollar.
Summary Statistics.
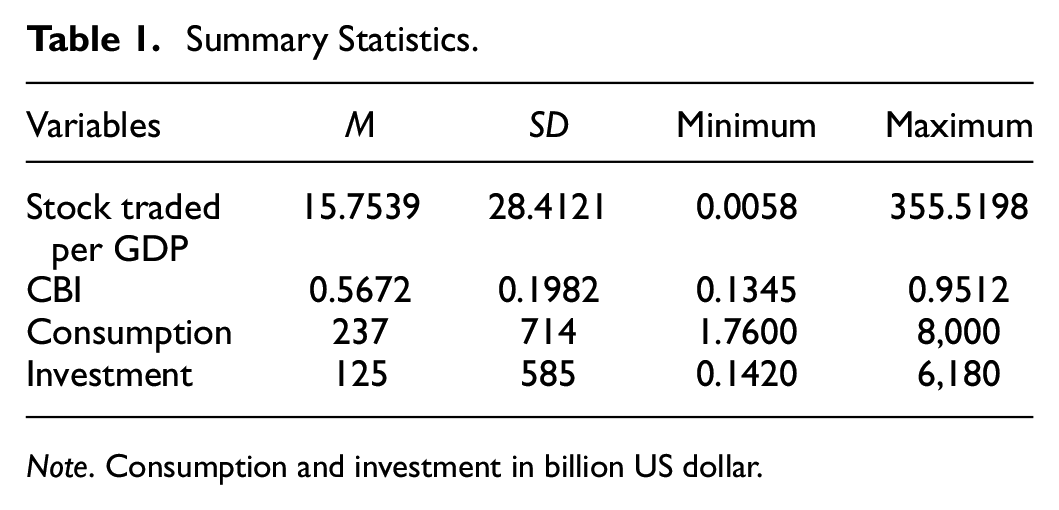
Note. Consumption and investment in billion US dollar.
Empirical Findings
Panel Unit Root Tests
This paper uses the panel unit root tests proposed by Levin et al. (2002), in conjunction with Im et al. (2001) and Breitung (2001) panel unit root tests to check the stationary series of the CBI, exchange rate, consumption and investment. Table 2 represents the result of the panel unit root test at level. The result illustrated that the null hypothesis is rejected for all variables at the 5% level of significance. Rejecting the null hypothesis means that those variables are I (0).
Panel Unit Root Tests.

Note. Critical values: 1%: −2.33; 5%: −1.65; and 10%: −1.28.
p ≤ 10%. **p ≤ 5%. ***p ≤ 1%.
Full Sample Countries Panel VAR
Lag Length Criteria
We estimate the model in equations (2a–2d) to investigate the interlink between CBI, stock traded, consumption, and investment by performing a panel VAR. The most effective lag is determined to be 4 for full sample, group 1 and group 2. Those selected lag are based on the Akaike information criterion which reveal in Table 3.
VAR Lag Selection Criteria.

Note. The superscripts *indicate a lag order selected by Akaike information criterion (AIC).
Full Sample Countries Panel VAR
By using panel VAR, we first estimate our model to look at how the CBI, stock market, and economic activity are related. Based on the Akaike information criteria, lag 4 is chosen as the optimal lag (Table 4).
PVAR Regression.
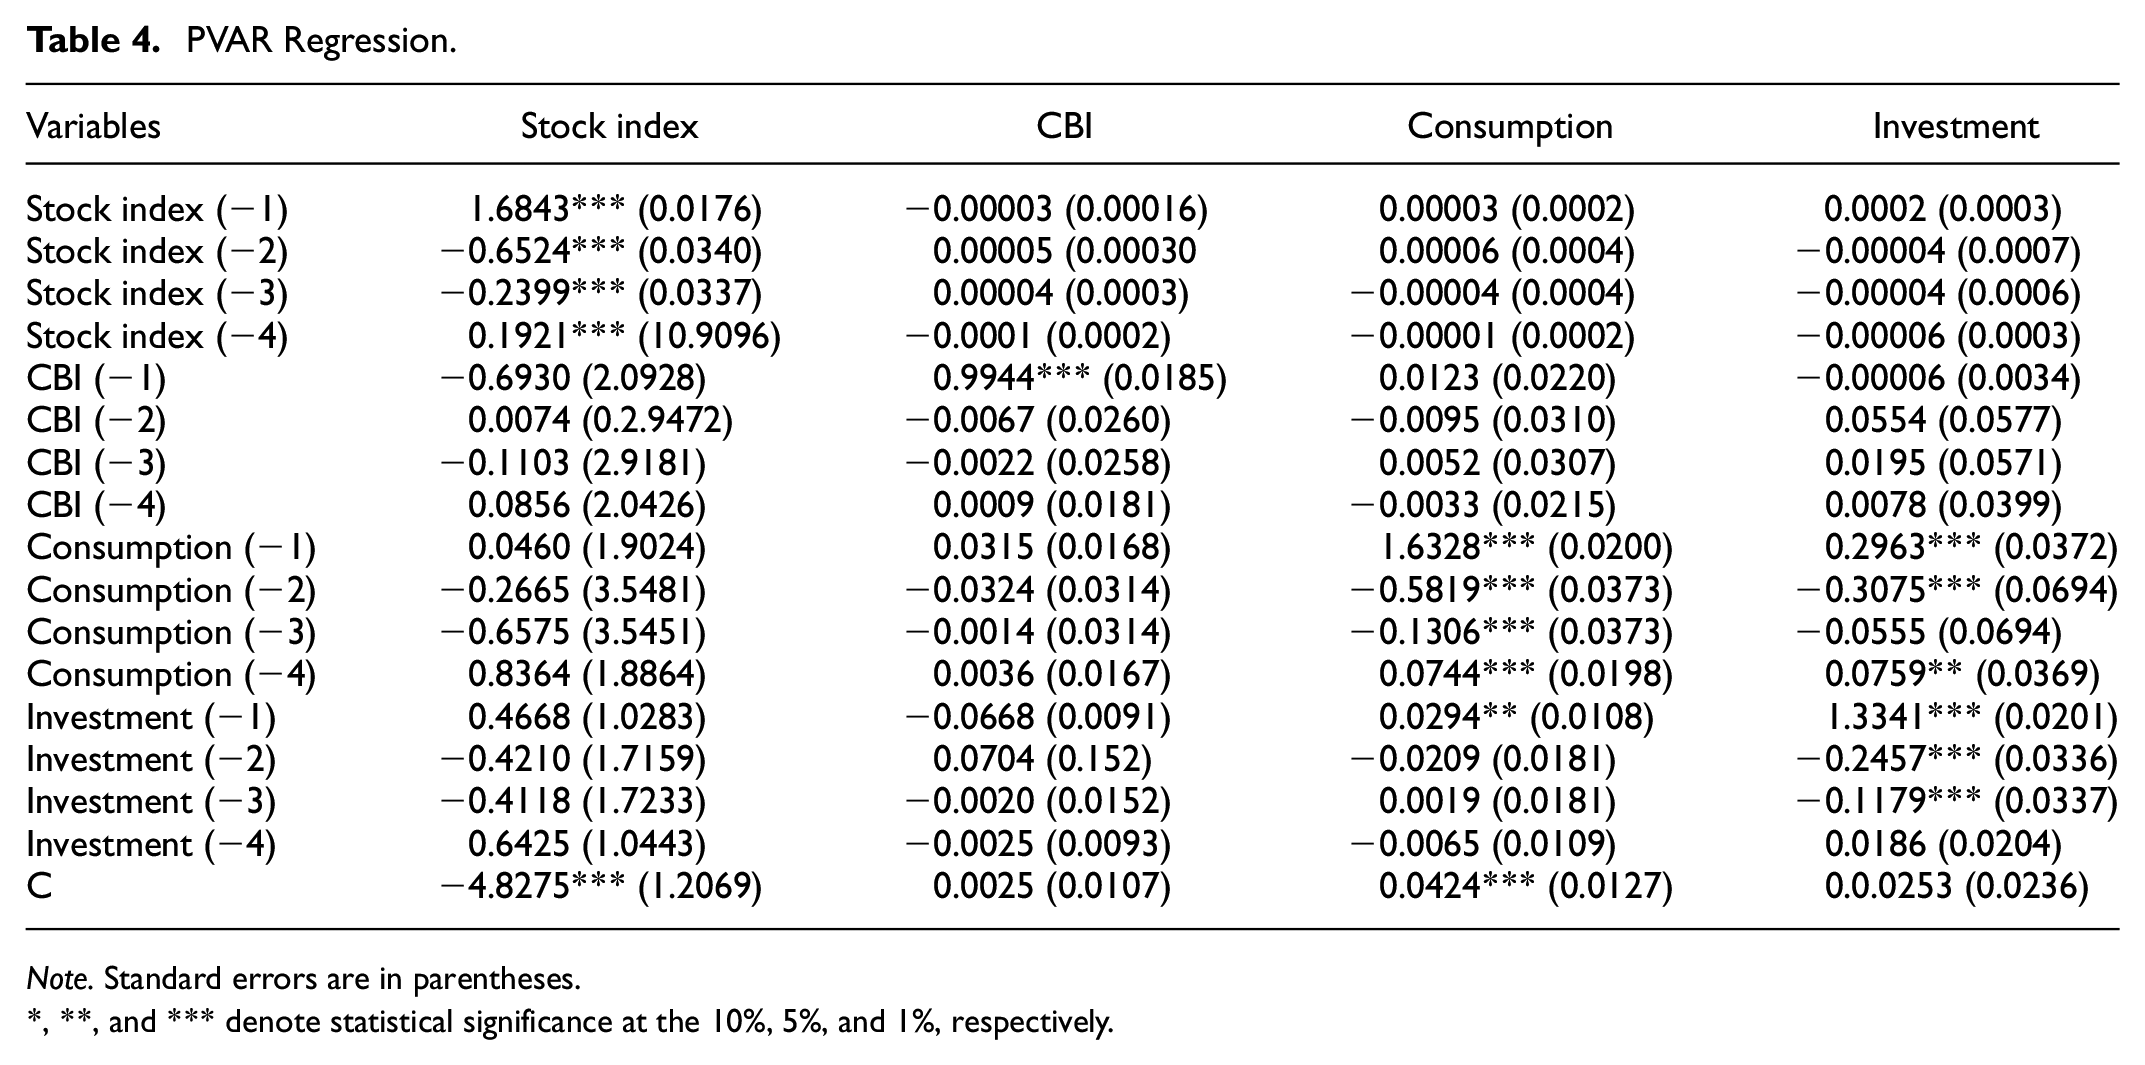
Note. Standard errors are in parentheses.
, **, and *** denote statistical significance at the 10%, 5%, and 1%, respectively.
Poolability Test for Panel VAR
The result in Table 5 reveals the poolability test for the models. The poolability tests explain that the null hypothesis is rejected. This indicates that panel VAR model coefficients are heterogeneous.
Poolability Test.

, **, and *** denote statistical significance at the 10%, 5%, and 1%, respectively.
Mean Group for Panel VAR
First, we evaluate the link between CBI, stock traded, investment and consumption using panel VAR estimation. The optimal lag is determined by the Akaike information criterion to be 4. Then, we run Chow and Roy-Zellner tests to evaluate the possibility of the model is not poolable. The results of poolability test explains that the null hypothesis was rejected. We find that the coefficients in the model contain cross countries heterogeneity. This implies that the result of the panel VAR model is biased. In light to this problem, we perform MG estimation for panel VAR. We treat such estimation in two steps: A first step, we estimate individual VAR for each country A second step, we average the coefficients of the variables across counties.
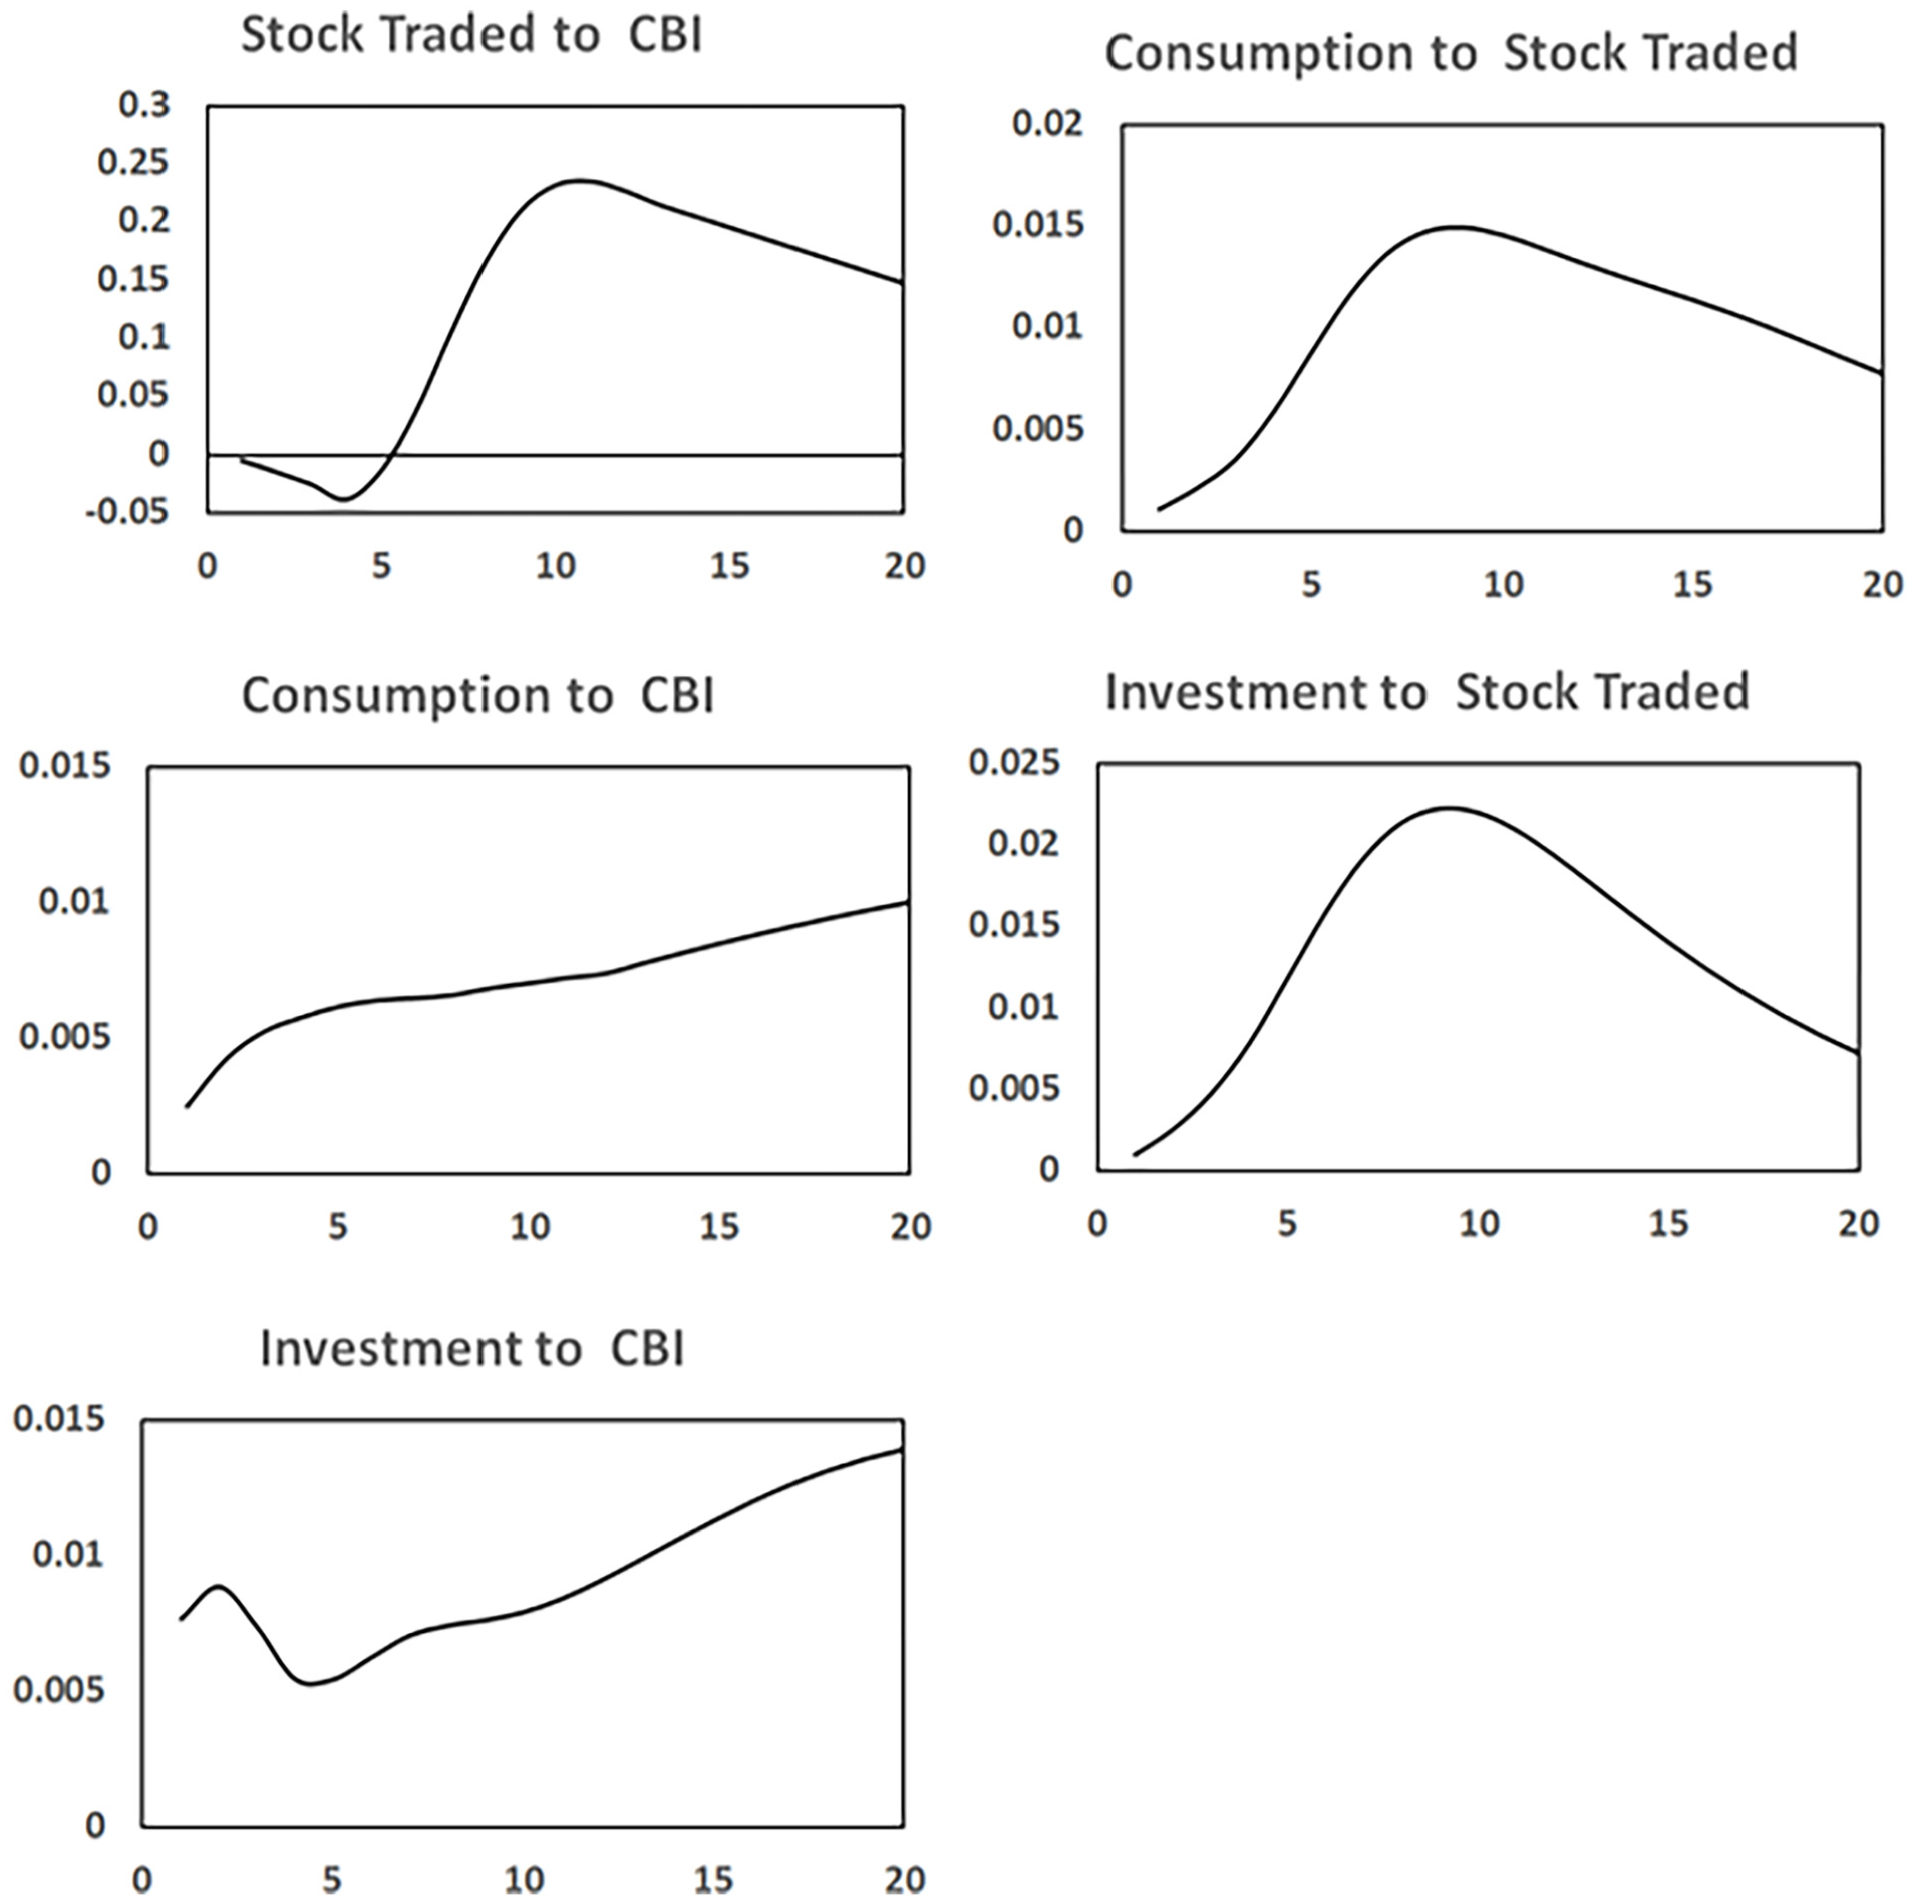
Figure 1 shows the interactions of CBI, stock traded, and economic activity implied by the MG estimation. First, we look at the impulse response of the stock traded to CBI shock. Regarding the shock one standard deviation relating to CBI, the stock traded responds negatively until period six. This means that greater CBI will harm the stock traded in developing countries. The negative respond of the stock index to an increase in CBI is also known as the “paradox of central bank credibility” (Ioannidis & Kontonikas, 2008). They stated that the opposite relationship is the result of a larger amount of imperfect information, which may decrease the stock market’s ability to transmit information and the effectiveness of this monetary transmission mechanism. Another reason is stated by Li et al. (2010) who claimed that foreign financial factors have a greater influence on stock indexes in developing nations than local monetary policy. From quarter six onwards, the response of the stock traded to CBI shock is positive. This finding corresponds with our expectation that CBI improves stock market performance. This implies that higher legal CBI index is valuable with regard to financial market performance. Enhancing the degree of CBI is also a signal that good government establishes a strong commitment in fighting inflation for investors (Lavezzolo, 2006). Consequently, the investors will believe that national economic policy will be stable and consistent (Pastor & Maxfield, 1999). This evidence appears to support the work of Förch and Sunde (2012) and Anwar (2021a), who found that CBI changes are related to higher stock price returns over 1 month. Nonetheless, stock price does not respond significantly over a period of 12 months after the CBI shock.
Impulse response function mean group estimation.
The responses of investment and consumption to stock traded shock are statistically significant and a positive sign. Concerning consumption, an increase in the stock traded enhances consumption. This result supports the life-cycle effect’s hypothesis that consumer spending rises due to the positive wealth effect. Shock one standard deviation of the stock traded triggers higher investment. This result is in lines with Tobin’s q theory which links asset prices and investment.
Next, we turn to the response of economic activity to CBI shocks. Shock to the degree of CBI increases private consumption. This result might be caused by tight monetary policy to combat high inflation in developing countries; and thus, resulting higher public consumption. The effect of CBI shock increases investment. This result confirms that higher CBI is a good signal to attract investors.
Forecast Error Variance Decompositions
Subsequently, the results of the forecast error variance decompositions which reveals the contribution of the variable’s to the variation of one variable are reported in Table 6 is presented. Panel 1 of Table 6 reveals that approximately 100% of the variance of the errors in forecasting the stock traded comes from innovations to the stock traded itself at the 4-quarter horizon. Moreover, the contribution of innovations to the stock index drops to around 99% at the 20-quarter horizon.
Forecast Error Variance Decompositions.

From panel 3 in Table 6, it is evident that consumption explains above 98% of the forecast error variance of the consumption at the 4-quarter horizon, even though the contribution declines continuously to around 94% at the 20-quarter. The importance of innovations to the stock traded contributes approximately 0.02% in the 4-quarter then increases to roughly 0.87% in period 20.
The last panel in Table 6 explains that the importance of investment decreases with the increase in forecast horizon. The investment contributes approximately 70% of the variance of the error in forecasting the investment at the 4-quarter horizon, then falls to around 57% at the 20-quarter horizon. The contribution of stock traded innovations to forecast error variance decompositions of investment rise from just 0.07% in quarter 4 to around 1.65% at quarter 20.
From the result above, we conclude that the the stock traded comes from innovations to the stock traded itself; the consumption is explained by innovations to the consumption itself, and the importance of investment decreases with the increase in forecast horizon.
Sub-Sample Analysis
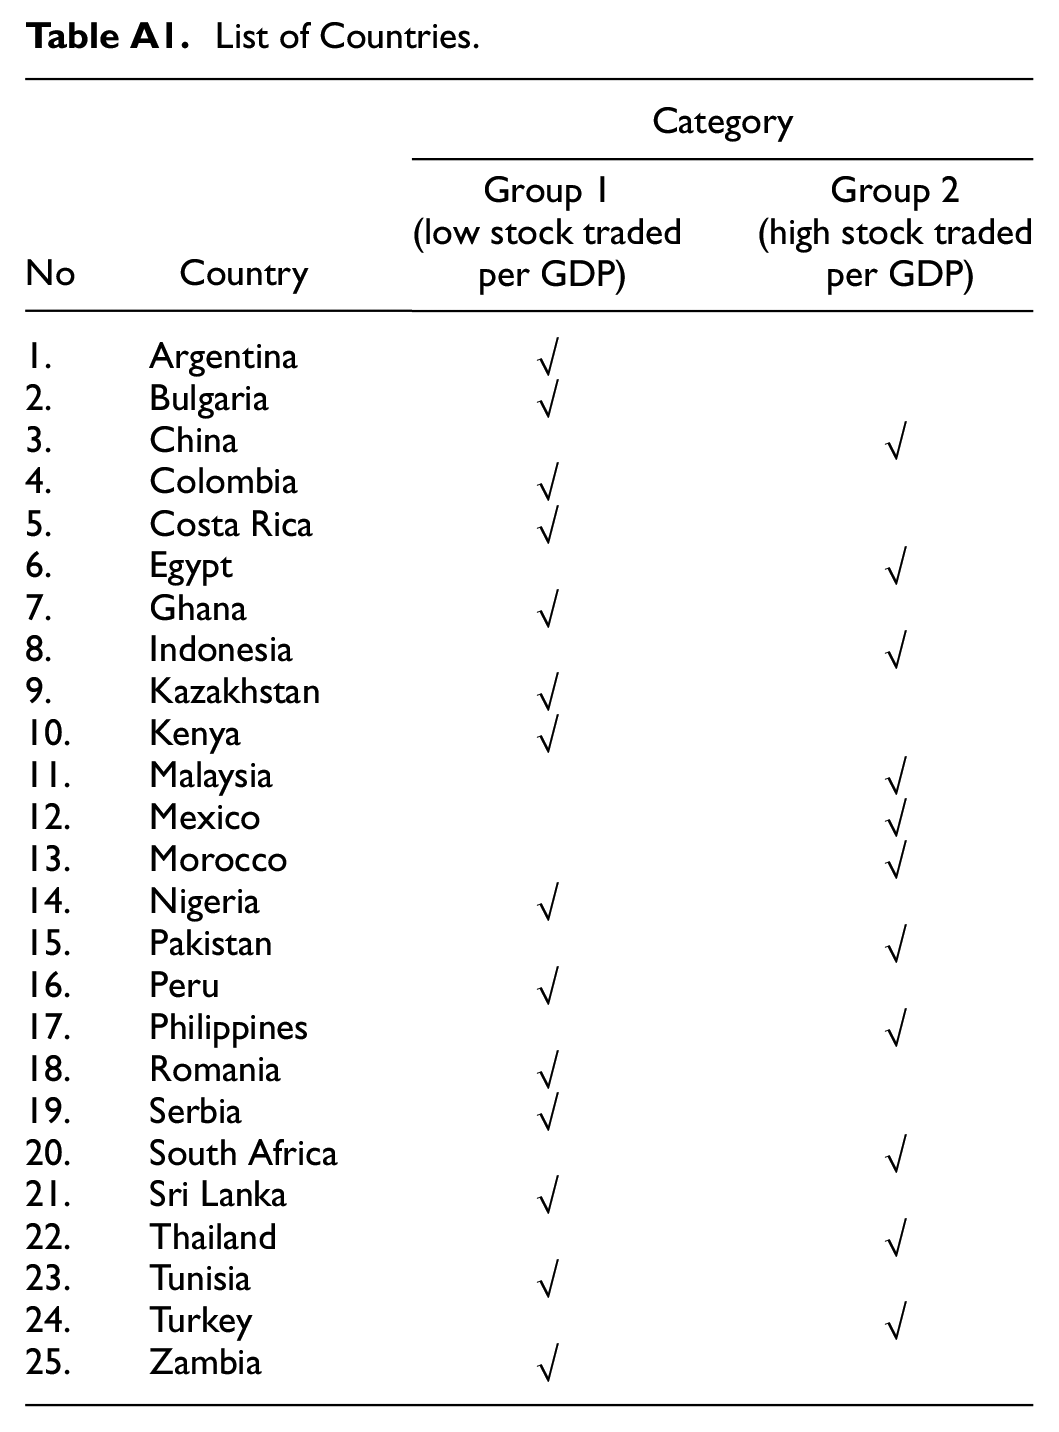
We distinguish our countries samples based on the ratio stock traded per GDP, specifically low and high stock traded per GDP. The first group is low ratio stock traded per GDP and the second group is high ratio stock traded per GDP.We then estimate the panel VAR for each group and explore whether the impact of CBI on stock traded differs between two groups. Our method of dividing the sample of nations into two groups and computing Panel VAR for every category may be robust for the relationship between CBI on stock traded. We treat the same processes with the full sample for the two subsamples.
We perform the panel VAR with lag 4 for both groups; then we run poolability test. The results reveal that the null hypothesis was rejected. This indicates that our panel VAR model cannot be pooled and that there is heterogeneity among the sample regions. We then perform MG estimation for panel VAR for groups 1 and 2. Figure 2 reveals the IRF for group 1, while the Figure 3 shows the IRF for group 2. Now, we can compare the results for both groups.

Impulse responses function group 1.

Impulse responses function group 2.
First, we look at the impulse response of the stock traded to CBI shock. Regarding the shock one standard deviation relating to CBI, the stock traded responds positively for all periods for group 1; while, for group 2, the stock traded responds negatively until period six but from period six onwards, the response of the stock traded to CBI shock is positive. The positive effect of CBI on stock traded corresponds with our expectation that CBI improves stock market performance. This implies that higher legal CBI index is valuable with regard to financial market performance. Enhancing the degree of CBI is also a signal that good government establishes a strong commitment in fighting inflation for investors (Lavezzolo, 2006). Consequently, the investors will believe that national economic policy will be stable and consistent (Pastor & Maxfield, 1999). This evidence appears to support the work of Förch and Sunde (2012) and Anwar (2021a), who found that CBI changes are related to higher stock traded. The different effect of the CBI on stock traded in both groups could be because there is a different market capitalization in both groups.
However, the negative response of stock traded to CBI in the first six period means that greater CBI will harm the stock traded in high ratio stock traded tor GDP countries. The negative reaction of the stock index to increasing CBI is also known as the “paradox of central bank credibility” (Ioannidis & Kontonikas, 2008). They argued that the negative relationship is due to the higher level of asymmetric information which may reduce the ability of the stock market to transfer information and lowering the efficiency of this monetary transmission mechanism. Another reason is stated by Li et al. (2010) who claimed that international financial factors have a larger impact than domestic monetary policy on stock index in developing countries.
The responses of investment and consumption to stock index shock are positive for both groups. For the impulse response of consumption to stock traded shock, an increase of one standard deviation of stock traded increases consumption. This result is in line with Friedman’s permanent income hypothesis pertaining to the positive relationship between stock traded and consumption. Shock one standard deviation of the stock traded leads to higher investment. This result corresponds with Tobin’s q theory developed by Tobin (1969), who argued that the market value of a company’s existing fixed capital stock can be determined by asset price. q is defined as the ratio of the total market value of companies relative to the replacement cost of their existing capital stock at current prices. When q is high (q > 1) implies that a company’s stock is more expensive than the replacement cost of its asset. Thus, the company can increase new equity to develop its capital and therefore, improve its value. Specifically, a company tends to invest more when its stock index increases. According to Fama (1990), stock index is a leading indicator for the economy overall. Hence, the investor will understand that an increase in stock index will assist the economy will grow quickly. Davis and Stone (2004) have shown that a 1% change in equity price creates a 1% change in long-run investment.
The responses of consumption and investment to stock traded shock are statistically significant and a positive sign for groups 1 and 2. Concerning consumption, an increase in the stock traded enhances consumption. This result supports the life-cycle effect’s hypothesis that consumer spending rises due to the positive wealth effect. Shock one standard deviation of the stock traded triggers higher investment. This result is in lines with Tobin’s q theory which links asset prices and investment.
Next, we turn to the response of economic activity to CBI shocks. We find the same responses of consumption and investment to CBI shock for groups 1 and 2. Shock one standard deviation related to the degree of CBI increases private consumption. This result might be caused by tight monetary policy to combat high inflation in developing countries; and thus, resulting higher public consumption. The effect of CBI shock increases investment. This result confirms that higher CBI is a good signal to attract investors.
Robustness Test
In order to ensure that the estimation in the model was accurate and robust, first, we replace the stock traded by stock turnover and we treat the same processes with the full sample. The results in Figure 4 show that it is similar with Figure 1. The response of stock turnover to CBI shock is positive. A shock related to stock turnover increases consumption. Shock one standard deviation of the stock traded leads to higher investment. Finally, a shock related to the degree of CBI increases private consumption and investment.

IRF mean group estimation.
Conclusion
Our panel VAR results reveal that the model incorporates country-specific heterogeneity. Then, we adopt the MG panel VAR by averaging the individual VAR for each sample. This demonstrates that CBI has a delayed effect on increases financial market. This implies that increased stock traded results in increased consumption and investment. Our sample is then divided into two categories based on the ratio of stock traded to GDP. For both categories, we observe different responses of stock traded to CBI shocks. The effects of CBI and stock traded on consumption and investment are identical for both groups.
This study has two recommendations for policymakers in developing countries. First, policymakers must be more vigilant to improve their credibility in the international financial market in order to attract capital; a higher index of CBI reflects more transparency and credibility, thus attracting more investment. Second, governments in developing nations steadily boost financial capitalization through listing public enterprises on the stock market. In order to encourage corporations to invest in the stock market, we recommend that government in emerging nations eliminate tax, regulatory, and legal obstacles.
Footnotes
Appendix
List of Countries.
| No | Country | Category | |
|---|---|---|---|
| Group 1 (low stock traded per GDP) | Group 2 (high stock traded per GDP) | ||
| 1. | Argentina | √ | |
| 2. | Bulgaria | √ | |
| 3. | China | √ | |
| 4. | Colombia | √ | |
| 5. | Costa Rica | √ | |
| 6. | Egypt | √ | |
| 7. | Ghana | √ | |
| 8. | Indonesia | √ | |
| 9. | Kazakhstan | √ | |
| 10. | Kenya | √ | |
| 11. | Malaysia | √ | |
| 12. | Mexico | √ | |
| 13. | Morocco | √ | |
| 14. | Nigeria | √ | |
| 15. | Pakistan | √ | |
| 16. | Peru | √ | |
| 17. | Philippines | √ | |
| 18. | Romania | √ | |
| 19. | Serbia | √ | |
| 20. | South Africa | √ | |
| 21. | Sri Lanka | √ | |
| 22. | Thailand | √ | |
| 23. | Tunisia | √ | |
| 24. | Turkey | √ | |
| 25. | Zambia | √ | |
Declaration of Conflicting Interests
The author(s) declared no potential conflicts of interest with respect to the research, authorship, and/or publication of this article.
Funding
The author(s) received no financial support for the research, authorship, and/or publication of this article.