
Abstract
Recommender systems capable of discovering patterns in stock price movements and generating stock recommendations based on the patterns thus discovered can significantly supplement the decision-making process of a stock trader. Such recommender systems are of great significance to a layperson who wishes to profit by stock trading even while not possessing the skill or expertise of a seasoned trader. A genetic algorithm optimized Symbolic Aggregate approXimation (SAX)–Apriori based stock trading recommender system, which can mine temporal association rules from the stock price data set to generate stock trading recommendations, is presented in this article. The proposed system is validated on 12 different data sets. The results indicate that the proposed system significantly outperforms the passive buy-and-hold strategy, offering scope for a layperson to successfully invest in capital markets.
Trading successfully in stock markets is considered to be a challenging task. Becoming a successful stock trader requires significant stock trading experience and the ability to spot trends in stock price movements. A stock trading recommender system, which can take on the role of an “expert” trader and generate stock buy/sell recommendations, is thus, of great value to a layperson who wishes to profit by investing in stocks. There have been several studies in the past, most notably by Cowles (1933, 1944) and Fama (1965a, 1965b, 1970), which suggested that stock prices follow a random walk and that it is impossible to profit from trading in stocks. However, more recent studies (Atsalakis & Valavanis, 2009; Brabazon & O’Neill, 2006; Nair & Mohandas, 2015a; Nair & Mohandas, 2015b; Nair, Mohandas, & Sakthivel, 2010a) have demonstrated that it is indeed possible to forecast stock prices and generate returns from stocks that are much higher than the traditional passive buy-and-hold (B&H) strategy. It is also observed from Atsalakis and Valavanis (2009), and Nair and Mohandas (2015b) that soft computing based systems perform better when compared with traditional linear models. Soft computing based techniques, such as artificial neural networks (ANNs) (Nair, Patturajan, Mohandas, & Sreenivasan, 2012; Saad, Prokhorov, & Wunsch, 1998; Zahedi, 1993), combination of genetic algorithms (GAs) and ANN (Nair, Sai, et al., 2011), combination of decision trees and rough sets (Nair, Mohandas, & Sakthivel, 2010a), support vector machines (SVMs) (Huang, Nakamori, & Wang, 2005; Nair, Mohandas, & Sakthivel, 2010b), ant colony optimization (ACO) (Nair, Mohandas, & Sakthivel, 2011), and neuro-fuzzy systems (Nair, Dharini, & Mohandas, 2010; Nair, Minuvarthini, Sujithra, & Mohandas, 2010), have been successfully used for the purpose. A more comprehensive list of such soft computing based systems can be found in Atsalakis and Valavanis (2009). In Nair and Mohandas (2015a), a survey of more than a 100 publications in the field of finance is presented. However, it is observed that association rule mining (ARM) algorithms have not been widely used for generating stock trading recommendations. Therehas been very little research on application of ARM techniques for financial applications. ARM was used in Srisawat (2011) to discover relationships between individual stocks. ARM was used in Ting, Fu, and Chung (2006) for identification of frequently occurring patterns in a stock time series and for finding interrelationships between stock price movements of pairs of stocks. However, the economic performance of the system was not considered. An ARM-based system was proposed in Kumar and Kalia (2011) to find similarity between stocks traded on Indian stock markets, similar to the one proposed in Ting et al. (2006). However, no trading strategy was proposed.
The primary issue with ARM algorithms is that temporal information is not considered while mining association rules, which makes the task of mining temporal association rules from stock price time series and their incorporation into a trading recommender system all the more challenging.
The stock trading recommender system proposed in this article uses Symbolic Aggregate approXimation (SAX) to obtain a symbolic representation of the stock time series. The symbols are then used to form a transaction database, from which the association rules are obtained. Association rules that can be used for generating trading recommendations are identified from the obtained rules. Based on these rules, at the end of each trading session, recommendation for the next trading day is made. Proposed recommender system is validated on four different stocks, namely, Cipla, Hindustan Unilever (HUL), GlaxoSmithKline (GSK), and Royal Bank of Scotland (RBS), with Cipla and HUL drawn from the emerging market—India (Bombay Stock Exchange)—and GSK and RBS from the mature market—the United Kingdom (London Stock Exchange). Three different time frames are considered for each of these stocks to demonstrate the efficacy of the proposed system under different market conditions such as uptrend, downtrend, and no-trend in the stock price movements. Hence, the proposed system is validated on a total of 12 different data sets. Two variants of the proposed system are considered, and their performance is compared with that of the ARM-based stock trading decision support system proposed in Nair et al. (2013). Results are also compared with the traditional B&H strategy.
The remainder of the article is organized as follows: The following section presents the overall design of the proposed system. The implementation results are presented in the penultimate section, and the conclusions drawn from the results are presented in the last section.
System Design
Block diagram illustrating the functioning of the proposed system is presented in Figure 1. The detailed working of the system is as follows:

Block diagram of the proposed system.
Identification of Training and Testing Data
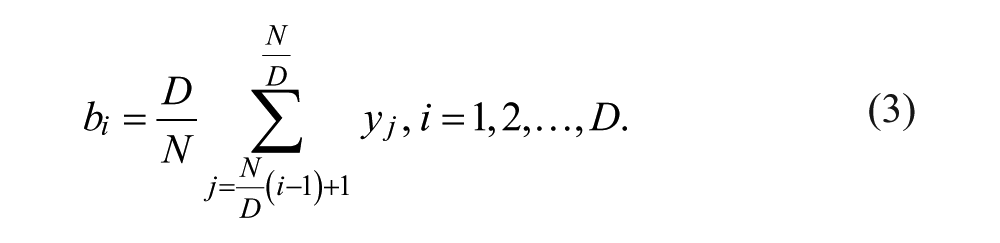
The first step in the design of the proposed stock trading recommender system is the selection of training and testing data sets. The selection process as proposed by Nair et al. (2013) is followed and is described as follows: Initially, the stock price data for 1 year are considered. These data are then separated into their trend and cyclic components using the Hodrick–Presscott (HP) filter (Hodrick & Prescott, 1997).
The HP filter considers the value of a time series at time t, y(t) to be the sum of a trend component g(t) and a cyclic component c(t), that is,

where N is the length of the time series and
The HP filter minimizes variance in c(t) while incorporating a user-defined penalty λ for the lack of smoothness in g(t). Hence, the HP filter isolates c(t) from y(t) by finding the following:

The value of the smoothing parameter is set in this study as 14,400, because it appears to be the most common value (e.g., Doorn, 2001; Iannaccone & Otranto, 2003; Nair et al., 2013). c(t) is further filtered using a 10-day moving average filter. The frequency content in this filtered component is then identified by computing the Discrete Fourier Transform (DFT) using Fast Fourier Transforms (an implementation of Cooley–Tukey [Cooley & Tukey, 1965] algorithm is used). From the DFT, the dominant frequency is identified from which the duration of the most prominent cycle is identified. Number of samples in the test set (out-of sample) is fixed as 1 × Duration of the dominant cycle (rounded to the nearest integer).
It was observed that training sets consisting of number of samples that are multiples of the dominant cycle duration resulted in good out-of-sample performance. A line search was used to identify the multiple for each time frame that generated the best in-sample performance.
SAX-Based Conversion of Time Series to Symbols
Once a training data set is selected, the data set is then converted into symbols with the help of SAX algorithm (Lin, Keogh, Wei, & Lonardi, 2007). The SAX algorithm works by first converting the series, say
The resulting series
To obtain a symbolic representation of the series, the amplitude of the series is divided into S intervals, with each interval assigned a unique symbol. It is assumed that the samples in the series
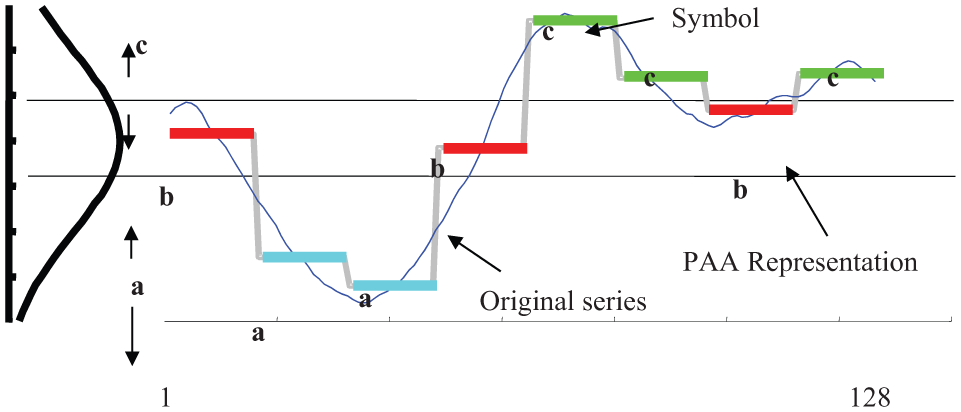
SAX representation of a series adapted from Lin, Keogh, Wei, and Lonardi (2007).
In Figure 2, the original series consisted of 128 samples, that is, N = 128. Also, D = 8 and S = 3. The symbols were
Because the attempt in this study is to recommend 1-day-ahead trading decision, the window size is chosen to be 1, that is, D = N. In this study, the number of symbols to be considered for each data set is determined based on the minimum and maximum value of the data (here, the data are the closing value of the stock every day). As a modification to the SAX algorithm, the breakpoints are not fixed, as proposed by Lin et al. (2007), but dynamically vary with each data set. An attempt in this direction was reported in Nair et al. (2014); however, only the number of symbols was optimized. The algorithm used for finding the bounds is presented in the algorithm SAX_Bounds below.
//max: maximum closing price, min: minimum closing price in the given data set
Output: Bounds
Begin
1. Temp ← min
2. Bounds(1) ← min
3. i ← 1
4.
Temp ← Temp + 1.02* Temp
i ←i + 1
Bounds (i) ← Temp
Identification of optimal breakpoints is accomplished with the help of GA, which finds the optimal breakpoint between each of the two consecutive bounds that maximize the given objective function. Hence, if there are a total of β bounds {Bounds(1), Bounds(2), . . . Bounds(β)}, the GA will find β −1 optimal breakpoints with the upper and lower bounds for each breakpoint in the GA given by the set of tuples {(Bounds(1), Bounds(2)), (Bounds(2), Bounds(3)), . . ., (Bounds(β− 1), Bounds(β))}. Detailed description of the GA parameters and the objective functions used is presented below.
GA-Based System Optimization
In the present study, GA is used to identify the optimal breakpoints in SAX. Because the objective of the present study is to obtain maximum trading profits while minimizing the losses incurred due to trading, two different systems were evaluated, the first with objective function = Profit factor, and the second with objective function = Profit per profitable trade. Here,

and

Hence, the proposed system uses GA–SAX combination to maximize the profit factor and the profit per trade, respectively.
The rest of the parameters for the GA is the same for both the cases and are listed as follows:
The initial population size is 40. Considering β to be the number of variables to be optimized, 0.05 × min(max(10 ×β,40),100) number of individuals with highest fitness are directly selected for the next generation. Eighty percent of the remaining individuals are subjected to crossover. In the crossover process, initially, a random binary vector with number of bits equivalent to number of genes in each chromosome is generated. For each bit position of the binary vector containing “1,” the corresponding gene is taken from one of the parents, and for each “0,” corresponding gene is taken from the other parent. Similarly, for another offspring, a new random vector is generated. The remaining individuals in the population are subjected to mutation. The Gaussian mutation technique is used. The GA stops if the value of the objective function value does not improve in 10 consecutive generations.
Mining Temporal Association Rules
After the stock price series has been converted into symbols, association rules are identified. Apriori ARM (Agrawal & Ramakrishnan, 1994) algorithm is used in the present study. ARM algorithms are used to detect associations between items in a transaction database. Let

The confidence is expressed as

As can be seen from the above expressions, temporal information is not considered a parameter for mining association rules from the data set. However, while attempting to mine associations from time varying data sets, such as stock price data, time information is of paramount importance. Incorporating temporal information into ARM has been attempted, for example, by Liang, Xinming, and Webliang (2005), and Winarko and Roddick (2007). The temporal ARM system proposed works by incorporating the temporal information into the item sets, as follows:
Time series represented in Equation 1 is converted into its string representation using SAX (Lin et al., 2007) algorithm, with the cut points being determined using GA as described above. The set of symbols can now be represented as
For the item set dj,

where Ki = 1 if
0 otherwise.
Trades are recommended based on the rules obtained from the frequent two-item sets. To illustrate the functioning of the system, assume that the time series has been converted into its symbolic representation, and that there are only two symbols S1 and S2 with the price ranges represented by the two symbols being such that price range for S1< price range for S2. The rules obtained can then be of three types:
Rule is of the type
Rule is of the type
Rule is of the type
Only the rules that correspond to the third type above are considered as trading rules and are stored along with their respective support values. Once the trading rules are identified, the system is now ready to generate trading recommendations. The recommendations are generated as follows:
Once a “trade” recommendation has been generated, the user is supposed to follow the recommendation and buy the stock at the opening price on the next day. The stock should be held till the day indicated in the second item of the selected trading rule (see Step 4 above). The stock should then be sold at the closing of the indicated day.
Results
Two different trading systems were evaluated. The first system used profit factor (PF) as the objective function for the GA, whereas the second system used profit per successful trades (PPT) as the objective function. Results are compared with those generated by a similar ARM-based decision support system proposed in Nair et al. (2013), and the returns generated by the B&H strategy. Time frames selected using the technique described earlier are presented in Table 1. The data sets represent three commonly occurring trends in stock price movements, namely, uptrend, downtrend, and no-trend, as can be seen clearly from Figures 3 to 5. Two different variants of the proposed system were validated, based on the objective functions used for identifying the optimal breakpoints. The first variant used PF as the objective function, because maximizing PF implies that the GA attempts to maximize the profit from profitable trades while minimizing the loss from loss-making trades. The second variant uses PPT as the objective function, because maximizing PPT will result in identification of rules with higher profit-generation capability. A transaction cost of 0.5% per trade was considered for all the stocks over all time frames. The results are presented in Tables 2 to 5. The results presented in the tables are separated into in-sample results (In) and out-sample results (Out). It must be noted that in Table 2 (Cipla) and Table 3 (HUL), the currency unit is Indian Rupees (Rs), whereas in Table 4 (GSK) and Table 5 (RBS), the currency unit is Great Britain pence (p). The performances of both the variants of the proposed system are validated on eight different parameters as suggested in Brabazon and O’Neill (2006). In Tables 2 to 5, the performance measure—“maximum drawdown” indicates the worst profit or loss generated by the recommender system for the given data set; hence, in cases where the proposed system does not generate any loss-making trades, the lowest profit generated of all the trades is presented as the maximum drawdown. It must also be noted that “Inf” in Tables 2 to 5 implies a divide-by-zero condition; for example, if there are no loss-making trades over the considered time frame, the PF (which is the ratio of gross profits to gross losses) and the win ratio (which is the ratio of number of profitable trades to number of loss-making trades) will both be “Inf.” The overall profits generated by both the variants are compared with the profits generated by the temporal ARM-based recommender system proposed in Nair et al. (2013). The results are presented in Figure 6. It is observed from the results that the proposed system with PPT as the objective function generates higher out-of-sample profits than all the other systems considered in the present study for 9 out of the 12 data sets, whereas the proposed system with PF as the objective function generates highest out-of-sample profits of all the systems considered for 1 out of the remaining 3 data sets.
Selected Stocks and Time Frames.

Note. HUL = Hindustan Unilever; GSK = GlaxoSmithKline; RBS = Royal Bank of Scotland.
Cipla training and testing closing price time series data for Time Frame 1 indicating an uptrend in prices.

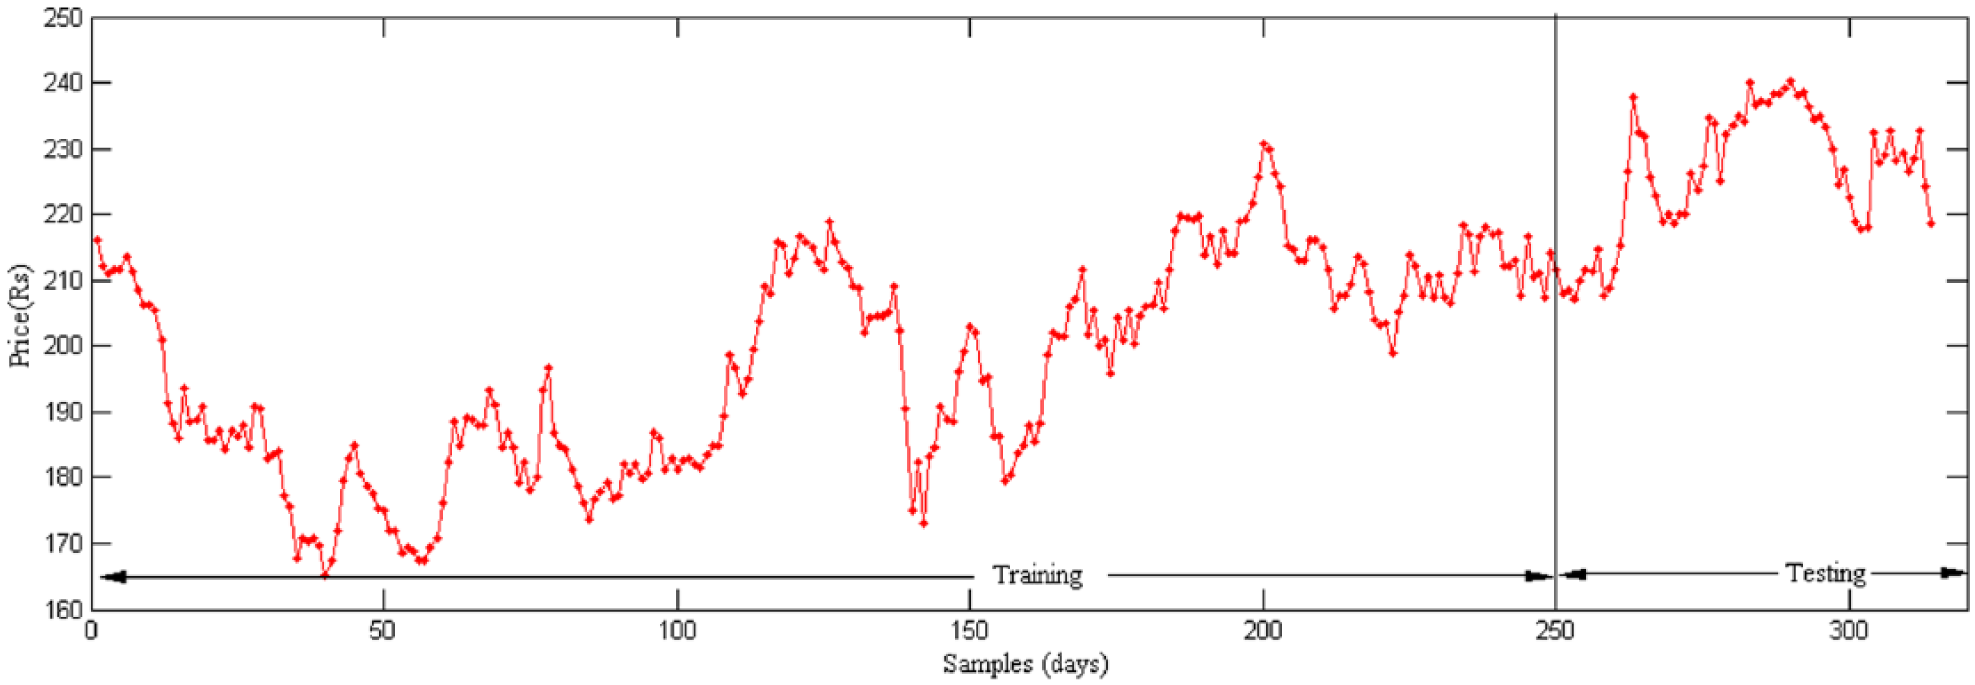
Royal Bank of Scotland (RBS) training and testing closing price time series data for Time Frame 2 indicating a downtrend in prices.

Cipla training and testing closing price time series data for Time Frame 2 indicating no trend in prices.
Economic Performance of Cipla Stock for Three Time Frames.

Note. PF = profit factor; PPT = profit per successful trade; B&H = buy-and-hold.
Economic Performance of HUL Stock for Three Time Frames.

Note. HUL = Hindustan Unilever; PF = profit factor; PPT = profit per successful trade; B&H = buy-and-hold.
Economic Performance of GSK Stock for Three Time Frames.

Note. GSK = GlaxoSmithKline; PF = profit factor; PPT = profit per successful trade; B&H = buy-and-hold.
Economic Performance of RBS Stock for Three Time Frames.
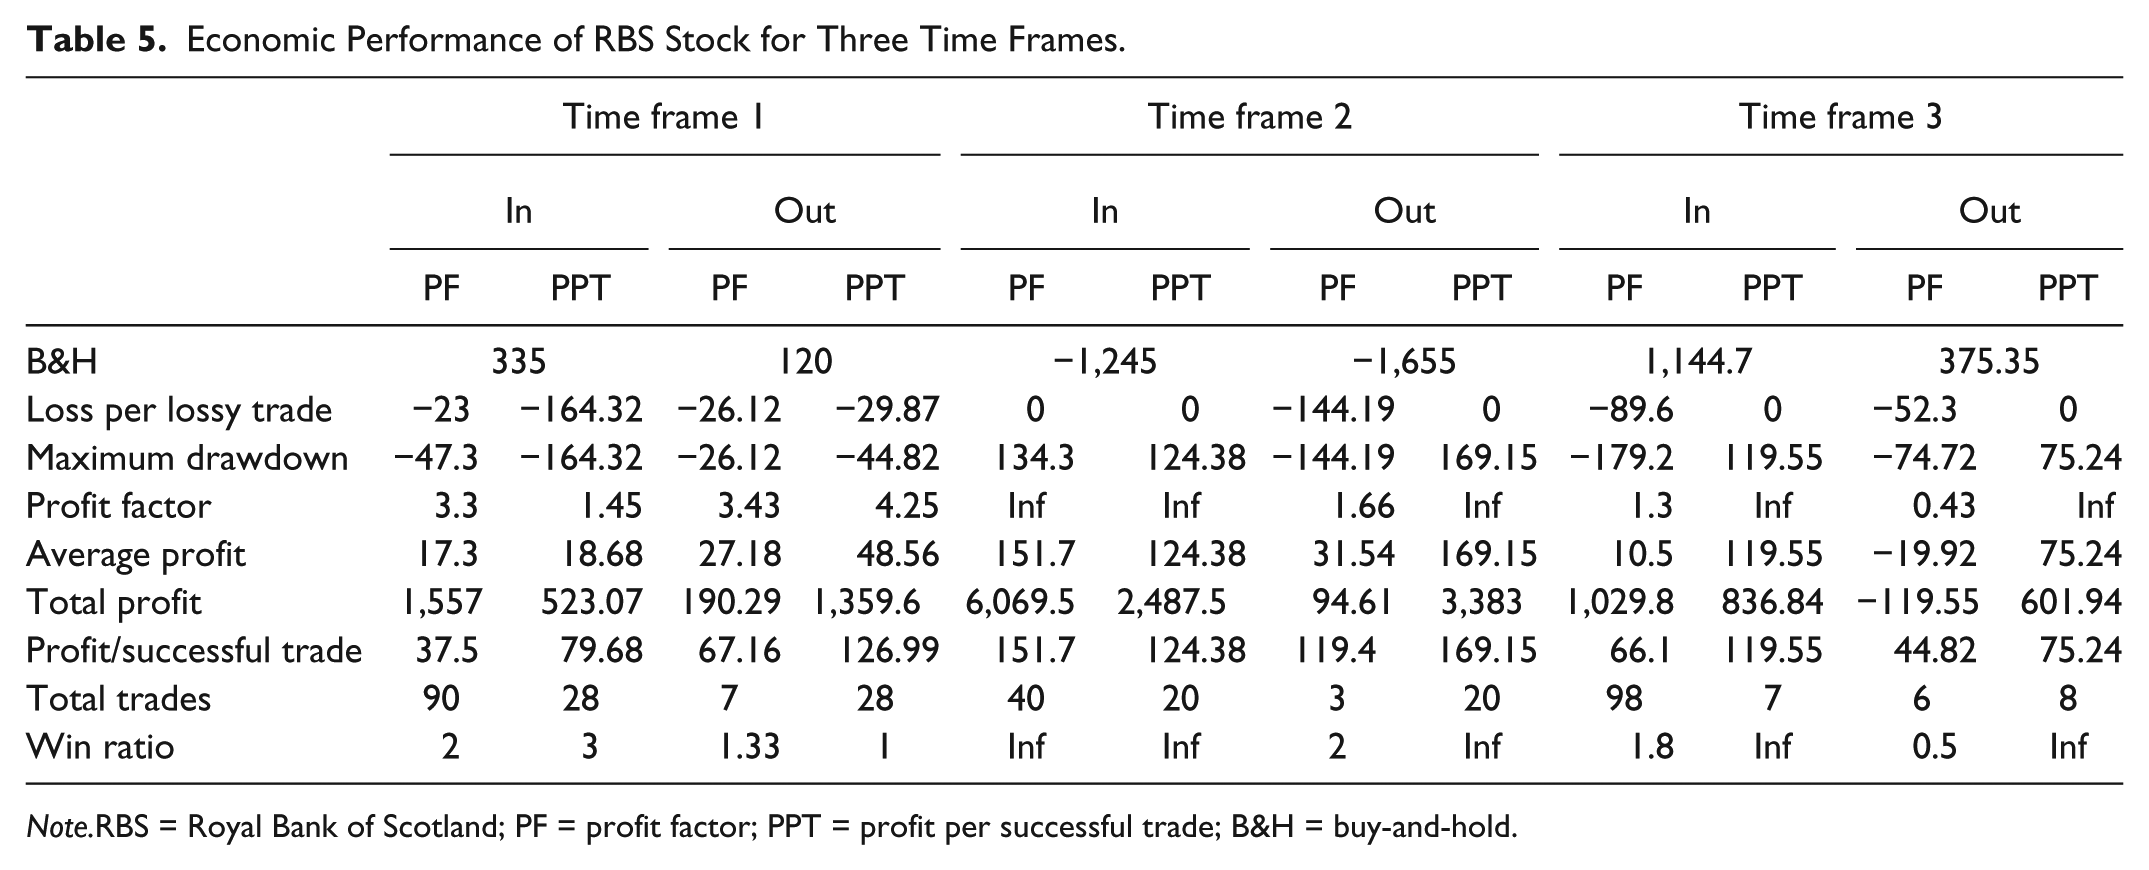
Note.RBS = Royal Bank of Scotland; PF = profit factor; PPT = profit per successful trade; B&H = buy-and-hold.

Comparison of profits generated by the two proposed systems with that generated by the B&H strategy and the system proposed in Nair et al. (2013).
Conclusion
In the present study, a stock trading recommender system based on mining of temporal association rules in stock prices is proposed. Performance of the system was optimized using GA. The system was validated on stocks belonging to two different markets—an emerging market (India) and a mature market (the United Kingdom). For each stock, the system was validated over three time frames. Two different variants of the proposed system are presented, based on the objective functions used for identifying the optimal temporal association rules. From the results obtained, it can be seen that the proposed system is capable of learning patterns from the stock price data and is able to execute profitable trades resulting in much higher profits than that generated by the traditional benchmark B&H strategy. Hence, it can be said that the proposed stock trading recommender system with PPT as the objective function can be successfully used to generate stock trading recommendations that can help a layperson trade successfully in the stock markets.
Footnotes
Declaration of Conflicting Interests
The author(s) declared no potential conflicts of interest with respect to the research, authorship, and/or publication of this article.
Funding
The author(s) received no financial support for the research and/or authorship of this article.