
Abstract
Tanzania port sector performs an essential function in the development of the economy and transportation of goods and services. The raised question is, what is the impact level of a seaport infrastructure on the Tanzania economy? To respond to this question, we assess the impact of seaport infrastructure on promoting economic growth in low-income country, Tanzania. A Structural Equation Modeling (SEM) approach employed to analyze the rapport of variables, using statistical data from 2005 to 2017. The results demonstrate a direct relationship between seaport infrastructure and economy. In addition, the relationship between seaport infrastructure and international trade were determined. The results also, shows a significant relation between international trade and economic growth. It is recommended in this study that, seaport infrastructure need to be improved alongside with the international trade so as to maximize its potential in promoting the growth of Tanzania’s economy, because transporting of goods through maritime is cheaper compared to other mode of transportation. Likewise the existing transportation and port policies should be maintained and implemented for improving transport infrastructure for promoting the growth of Tanzanian economy.
Keywords
Introduction
A port is a maritime business flair where ships load and unload cargo and passengers. In recent years, ports have evolved into a transportation hub that connects transportation infrastructure such as railway, road and airport avenues (Song & Wang, 2019; Wang & Wang, 2019). Tanzania’s port sector is a crucial player in the country’s rapid economic growth. Furthermore, according to data from Tanzania’s Ports Authorities (TPA), Tanzania has made significant investments to upgrade the port facilities in terms of technology and construction of new berths, increasing from 11 in 2005 to 17 in 2019. In this sense, it is fitting to investigate the economic contribution of its ports.
Earlier authors (Chang et al., 2014; Santos et al., 2018) investigated multiple models, including the Input-Output model, in determining port contributions to economic growth. For a long time, the input-output model was used to determine the port sector’s direct, indirect, and influence on economic growth in terms of outcome, income, and employment. Moreover, to assess the impact of port infrastructure on the economy and trade (Shan et al., 2014; Song & Mi, 2016) used Granger causality modeling and panel data modeling. They discovered that port infrastructure promotes trade growth.
In particular, this research uses a structural equation modeling approach to evaluate the impact of seaport infrastructure in economic growth, as mediated through international trade. SEM has been widely used in a variety of fields, including banking and finance (Cheng & Yeung, 2006), technology (Matemba, 2018), geochemistry (Liu, Cheng et al., 2015), behavioral management (Sharma et al., 2017), and transportation and logistics (Lu et al., 2007). In recent years, marine and port researchers (Deng et al., 2013; Lu et al., 2016; Munim & Schramm, 2018) have recognized the utility of SEM as a novel statistical tool. SEM was recently approved as a primary data analysis approach utilized by operational researchers in operations management studies (Shah & Goldstein, 2006). In a linear shipping environment (Lu et al., 2007), used SEM to investigate the relationship between security protection, perceived ease of use, perceived utility, and usage intention of internet services. Cheng and Tsai (2009) applied SEM to assess the relationship between logistics operation, warehousing, distribution, political incentives, logistics information technology service, and logistics cost. Deng et al. (2013) employ SEM to assess the relevance of port variables (port demand, port supply, and port value activities) to the regional economy.
Based on the literature review, we discovered that many ports and marine studies that used SEM as an analysis technique used primary data and collected data from designed questionnaires (Lu et al., 2007; Yang et al., 2009), while others such as Deng et al. (2013) used secondary data to investigate the relationship between port and regional economy. As a result, the goal of this study is to refine the research model by using secondary or institutional data and applying structural equation modeling (SEM) to examine the influence of seaport infrastructure in fostering economic growth in Tanzania. The impact of seaport infrastructure on stimulating economic growth in Tanzania was studied using data from 2005 to 2017 to address a gap in the marine and port literature. Figure 1 depicts the study’s methodological structure.

Methodological framework of the study.
Furthermore, the spillover benefits of ports are comparable to those of other types of transportation infrastructure, such as railroads and highways, which have a broader economic impact on the regional economy. As protuberances compel port cities and their environs, ports are located in specific zones. As a result, the economic effect of seaport infrastructure should be reconsidered to provide the best basis and validation for port authorities in their investment decision-making process. The goal of this article, contrary to the introduction, is to investigate the role of seaport infrastructure in encouraging economic growth in Tanzania. Structural Equation Modeling (SEM) is used to accomplish this goal. Part 2 presents theories and hypothesis formulation, Part 3 presents an overview of seaport infrastructure, Part 4 demonstrates the technique utilized, Part 5 gives study results, and Part 6 and 7 deal with discussion, conclusion and recommendations.
Theorizing the Port-Economic Linkages and Research Hypothesis
Review of Literature
Port infrastructure is thought to be a stimulus for economic growth at the local and regional levels. Many studies have been undertaken to assess the impacts of transportation infrastructure and the economic inclination based on the quantity of investment and the outcome gained (Berechman et al., 2006). Furthermore, past works of literature emphasized the economic consequences of road and railway infrastructure on economic development while placing less attention on port and airport infrastructure. On the other hand, improved transportation infrastructure may impact the development of the industrial sector by enabling the transit of raw materials, labor, and manufactured goods, increasing market share and as a result, company growth.
Furthermore, transportation infrastructure aid economic growth by lowering living costs, allowing people to acquire commodities at a lower price, improving transportation, and encouraging local manufacturers to compete. Businessmen and businesswomen can transfer goods and services to the market and vice versa due to improved transport infrastructure.
The economic consequences of port infrastructure are similar to those of other kinds of transportation infrastructure (railway, road, and airport). The function of ports in economic growth is still unclear. According to UNCTAD (2016), maritime services accounts for 80% of the world international trade, making port infrastructure critical to improving global connectivity and international trade growth for a given region. According to Wang and Wang (2019), the port business is a significant driver of local and national economies.
In addition, according to Song and Mi (2016), port infrastructure plays a significant role in China’s economy through enhancing transportation and growing other socio-economic sectors. Bottasso et al. (2003, 2014, 2018), on the other hand, discovered that port infrastructure has a favorable impact on commerce, local employment, and economic growth. Moreover, Shan et al. (2014) discovered that port cargo throughput adds to the economic growth of port cities. According to Santos et al. (2018), ports have a considerable impact on the Portuguese economy.
Moreover, Chang et al. (2014) used an input-output model to evaluate the economic impact of the port sector in South Africa. The study concludes that South Africa’s economic growth is influenced by port infrastructure. In addition, Santos et al. (2018) found that the port has a favorable impact on the economic growth of Lisbon and the cities surrounding the harbor. Furthermore, Cheung and Yip (2011) conducted a study to determine the factors contributing to increased port productivity using regression analysis. According to the study, an improvement in port productivity is linked to a port city’s economic and demographic growth. Conferring to Bryan et al. (2006), port infrastructure plays a significant role in developing industries, which leads to the region’s economic and social development. Deng et al. (2013) exposed a significant positive association between provincial economies and value-added activities at Chinese ports.
In addition, Musso et al. (2000) also looked into the impact of ports on employment in port cities. They discovered that port infrastructure creates jobs and boosts regional economic growth. Furthermore, in port infrastructure spillover effects, it has been found that port infrastructure encourages economic development in adjacent cities or regions. Trade improvement, market accessibility, labor mobility, technology transfer, and employment are multiplier impacts of port infrastructure to the port closest to town.
The main question then becomes how to estimates the impact of Seaport infrastructure on economic growth. Bryan et al. (2006) establish the conceptual framework (Figure 2). Based on the conceptual framework, the expansion of the strategic port asset has both direct and indirect effects on the region’s and port towns’ economic growth. Others are depicted in the framework as extensive economic benefits such as employment, industrial production, and a high standard of life. In the case of jobs, those employed will earn money and thus contribute to government revenue. An improvement in industrial productivity, on the other hand, will lower the cost of goods, promote small and medium businesses, and raise living standards. Port infrastructure serves as a gateway to both local and international markets, in addition to enhancing productivity. Investors will import and export goods at a fair price, improving international trade and increasing competitiveness among businesses.

Ports and regional economic merits.
Liu et al. (2006) discovered that logistics infrastructure is linked to regional economic growth. According to Fan and Chan-Kang (2008), logistics infrastructure investment alleviates poverty and boosts China’s region’s economic growth. In addition, according to Mody and Wang (1997), transportation infrastructure (road) was a significant component in the growing economy of China’s coast. Chang and Chang (2009) found that freight expansion and economic growth have a positive relationship.
Furthermore, Zhu et al. (2007) discovered that the relationship between logistical infrastructure and the economy is not equal but related. They explained that the Chinese economy is pushing logistics infrastructure but that its contribution to the Chinese economy is insufficient. Lean et al. (2014) indicate that logistic infrastructure has a strong link to economic growth. Economic growth is aided by improved transportation infrastructure since it reduces travel costs, journey time, and labor mobility; yet, economic growth impacts transportation infrastructure development. In addition, He et al. (2019) find that transportation infrastructure investment has considerable short and long-run effects on economic growth. Furthermore, several studies discovered the significant impact of other mode of transport infrastructure. For instance, Arbués et al., 2015; Iacono & Levinson, 2016; Li, Liu et al., 2018), have demonstrated that road infrastructure is a catalyst for regional economic growth and the advancement of other economic sectors, Pradhan and Bagchi (2013), Yu et al. (2018), Banister and Thurstain-Goodwin (2011) found a significant and positive association between railway infrastructure and economic growth, Button et al. (2015), Hakim and Merkert (2016), and Heinz and O’Connell (2013) found that airport infrastructure promotes economic growth by promoting local and international business growth and improving market accessibility. In addition, Kauzen et al. (2020) discovered a good and significant link between Tanzania transportation infrastructure and economic development. Increased passenger and freight throughputs will result from the improved road, rail, seaport, and airport infrastructure, resulting in increased national income and economic growth.
In general, logistics and logistics infrastructure contribute to economic growth in the following ways: (i) increased demand for goods and services due to investment in logistic infrastructure. (ii) Improvements in logistics infrastructure reduce travel costs and time, benefiting passengers and freight transporters directly in terms of time and cost savings (Gunasekera et al., 2008). Improved transportation infrastructure promotes economic growth by allowing enterprises to access the market, moving raw materials from various locations, and stimulating industrial production. (iii) Improved logistics infrastructure attracts more foreign direct investment, which is a critical engine for host country economic growth (Hong, 2007; Zhang & Ji, 2018) and (iv) Advanced logistics infrastructure reduces transportation costs and thus promotes industrialization, resulting in increased productivity, market accessibility, and local firm competition(Liu & Zhang, 2018; Murakami et al., 2016).
Furthermore, Seaport infrastructure has the direct and indirect effects on the economic growth of the region. For instance, directly it generates employment, increases income and contributes to regional gross value added. Seaports also, indirectly support international or local trade, enabling regionally based and national firms to gain access to cheaper products and profitable international markets (Dwarakish & Salim, 2015). In addition, the port might also have a role in improving the general location offer of a region, improving access to tourists and providing the physical conduit for the transfer of new technology and ideas (Morrissey & O’Donoghue, 2013; Song & van Geenhuizen, 2014).
Table 1 summarizes some of the most recent empirical port studies. Only two studies used the Structural Equation Modeling (SEM) approach, and most of these investigations used various methodologies. What’s missing is that none of these studies took into account seaport infrastructure or international trade. As a result, the current analysis emphasizes the broader economic benefits of Tanzania’s seaport infrastructure and foreign trade.
Summary of Studies Explaining the Impact of Seaport Infrastructure on Economic Growth.

The primary goal of this study is to assess the economic impact of seaport infrastructure, especially given the scarcity of information in Africa, notably in Tanzania, on the influence of seaport infrastructure on economic growth. The broader economic implications of FDI, marketing, and tourism are far more challenging to determine, but they are no less critical in national economic discussions.
Conceptual Framework
Based on existing literature and conversations with various port specialists, we offer a conceptual framework that indicates a possible link between port infrastructure and economic growth. On the impact of port infrastructure, past research has shown that port infrastructure boosts economic growth through increased international trade ( Munim & Schramm, 2018; Santos et al., 2018). The conceptual model of this study is embellished in Figure 3. It demonstrates the impact of two elements on the region’s economic growth (port infrastructure and international trade). These variables are linked together to have a direct effect on economic growth. We believe that significant investments in port infrastructure will increase the quality of port infrastructure, such as contemporary technology, port equipment, and cargo handling facilities, among other things. Improved port infrastructure makes it easier to access local and international markets. Consequently the correct utilization of global market opportunities improves cross-national trade and international trade success leads to economic prosperity in the region (Lakshmanan, 2011).
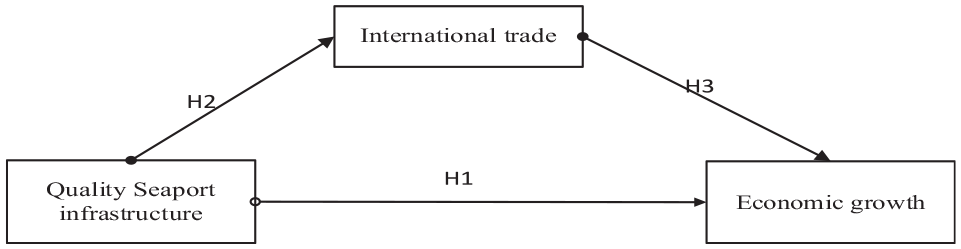
Conceptual model diagram.
Research Hypothesis
The capacity to provide high-quality port infrastructure has long been recognized as a marker for port logistics performance and port management services. Quay length, port gantries, port berths, port logistics information systems, terminal area, and warehouses are all part of the Seaport infrastructure. Several studies (Amairia & Amaira, 2017; Rothengatter, 2017; Tripathi & Gautam, 2010) shows that transportation infrastructure has a favorable impact on economic growth. Pradhan and Bagchi (2013) observed that transportation infrastructure could affect economic growth by influencing total demand. For Example transportation infrastructure construction creates and increases the need for transitory inputs from other sectors and boost economic impacts. Furthermore, to hard Seaport infrastructure such as Quay length, port gantries, quayside length, and terminal area, Song and van Geenhuizen (2014) illustrate the effects of soft Seaport infrastructure, such as port logistics information systems in improving Seaport logistics. As a result, we propose the following hypothesis:
It has been extensively indicated in literature that quality seaport infrastructure is closely related to international trade (Bottasso et al., 2014, 2018; Song & Mi, 2016). The total port throughput results from enhanced port infrastructure such as quay length, number of births, port gantries, terminal space, and port logistics information system (Song and van Geenhuizen (2014)). According to UNCTAD (2016), port services account for 80% of global international trade, implying that seaport infrastructure plays an essential role in improving global connectivity and international trade growth for a given region. As a result, we propose the following hypothesis:
Ports are the hub and protuberance of all types of maritime transit and connect countries worldwide. Ports make it easier to move and distribute goods and services at low rates. Ports facilitate international trade, reduce freight transportation costs, and provide access to global markets (Gunasekera et al., 2008). Port activities such as receiving, encumbering, and unloading of products, warehouses, and logistic amenities, according to Deng et al. (2013), have a variety of effects on economic growth. Song and Mi (2016) revealed that a country’s GDP is positively connected to the number of globally renowned ports. Bottasso et al. (2014) proclaim that ports increase the GDP of the regions in which they are located and nearby areas in small amounts. According to Haddad et al. (2010), increased port throughput leads to economic growth in the area. In addition, van de Vooren (2004) illustrated that the rise in freight transportation volume directly correlates with regional economic growth. As a result, we propose the next hypothesis:
Prevailing Prominence of Tanzania’s Port Sector
Tanzania has 22 ports, three of which are major (Dar es Salaam, Mtwara, and Tanga) and 19 small ports (a total of 1,424 kms of coastline). Tanzania’s ports serve as a vital gateway for international trade in East and Central Africa. Water transport is a crucial mode of transportation in Tanzania, aside from being the main gateway for business. Tanzania’s transportation sector has been steadily growing, with a 16.6% gain in 2017. Furthermore, the transportation industry provides 7% of the national GDP.
By establishing new six berths in Dar es Salaam port, including a RORO dock, boosting port security, upgrading port cargo processing facilities, and improving ICT, the Tanzanian government has made a significant investment in extending and modernizing the port infrastructure (Tanzania Port Handbook, 2019). Furthermore, Tanzania’s economy is growing at a rate of 7%, which is the highest among East African countries. Figure 4 depicts Tanzania’s GDP growth over the last 13 years and port performance over the same period.
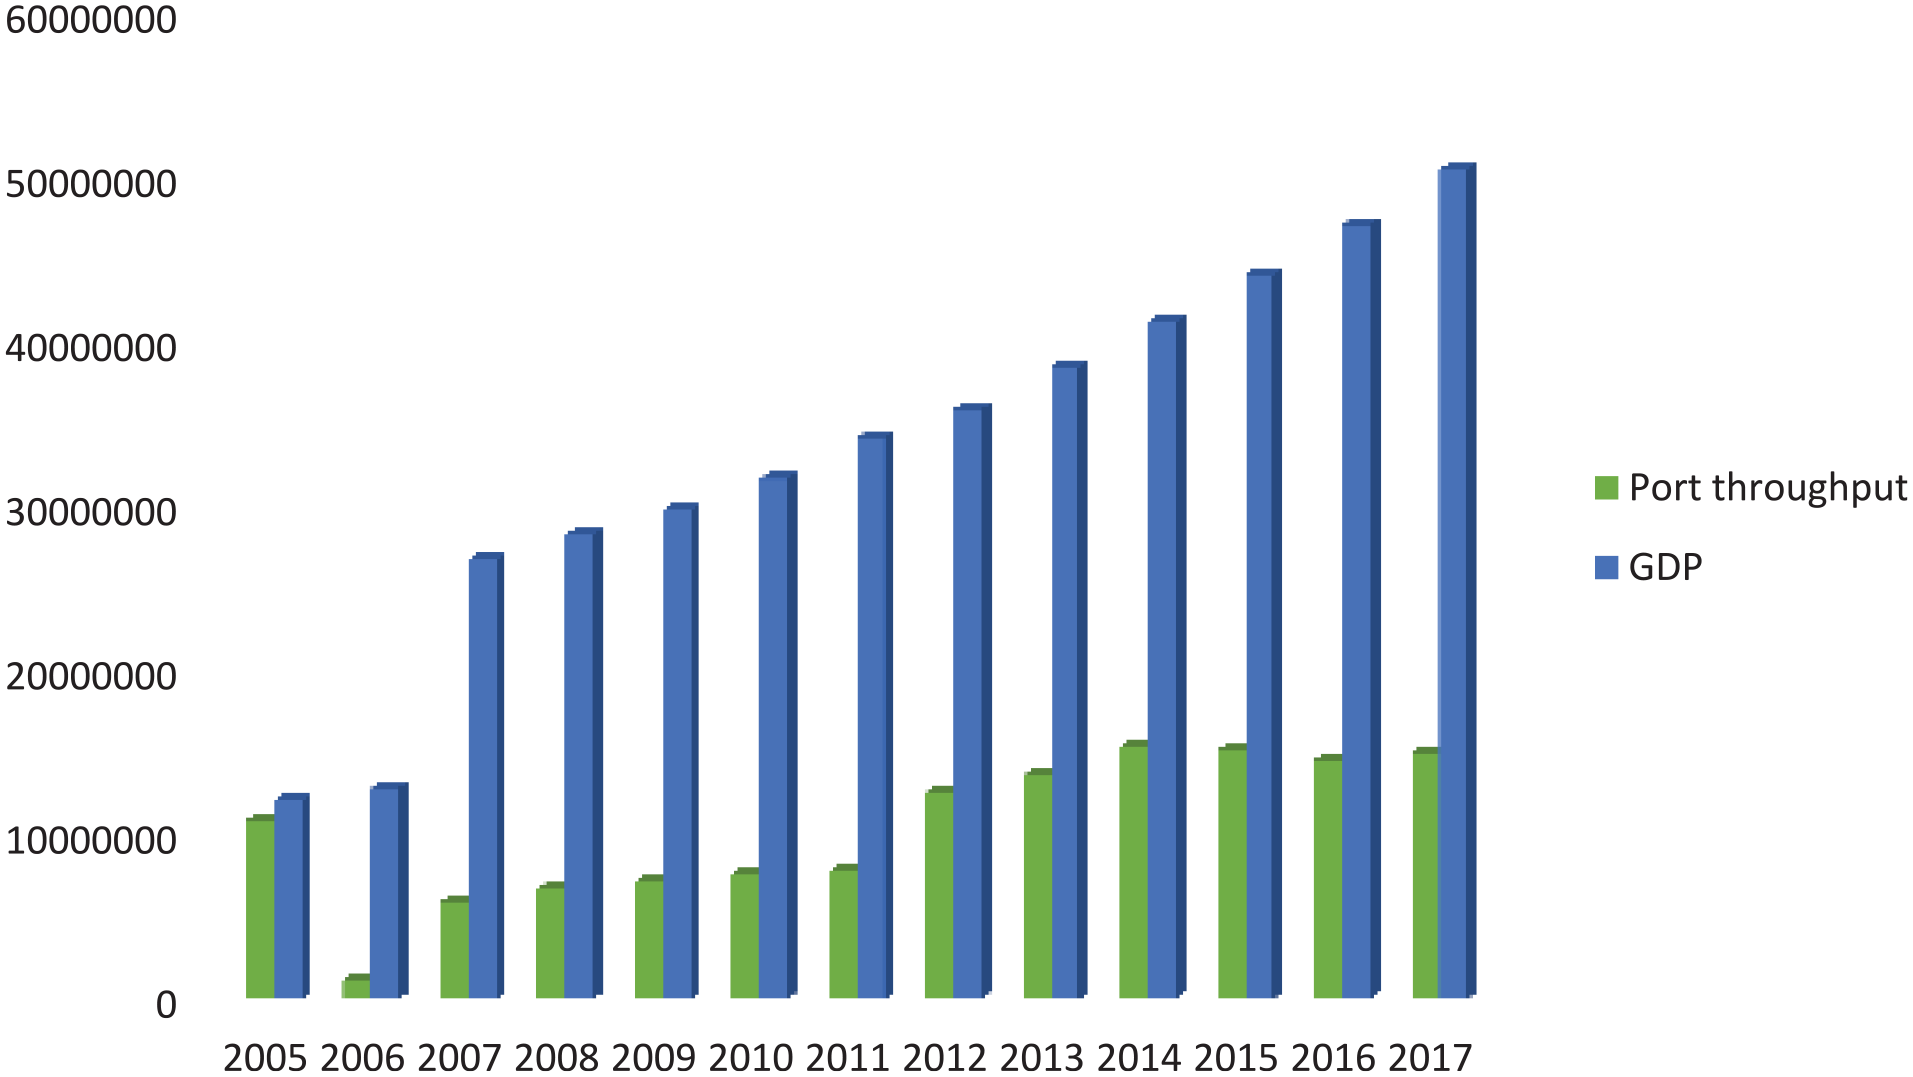
Tanzania’s GDP and Port performance from 2005 to 2017.
Furthermore, through the port of Dar es Salaam, Tanzania ports have been serving neighboring countries, mostly landlocked countries such as Burundi, Rwanda, Zambia, and the Democratic Republic of Congo. According to Tanzanian port authority figures, the number of transit products imported and exported through Tanzania’s port has increased considerably in recent years as other transportation infrastructure such as roads, railways, and airports have been improved. The transit flow through Dar es Salaam port to neighboring countries is depicted in Figure 5.
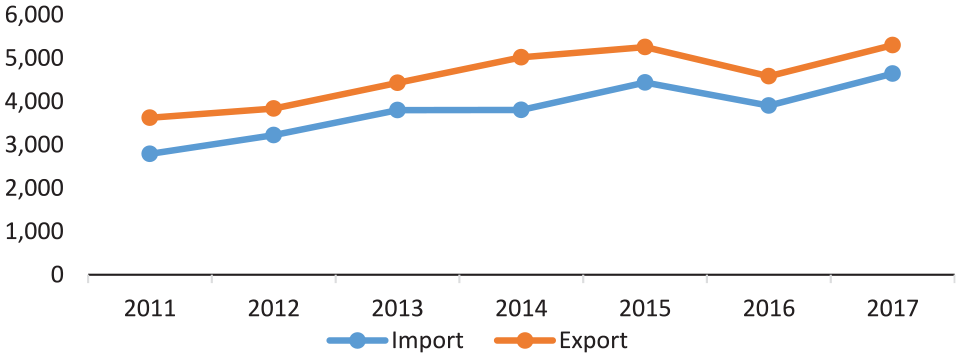
Transit traffic through Dar es Salaam Port.
Data and Methodology
Data Source
This study gathered data from a variety of domestic and international sources, including the World Bank, the Tanzania Ministry of Works, Transportation and Communication report (2016–2017), the Tanzania Economic Survey Book (2005–2017), Tanzania Ports Authority annual reports (2005–2016), Tanzania National Accounts report (2005–2017), African statistics yearbook (2005–2017) and Tanzania transport review (2017). The details and descriptions of variables are shown in Table 2. This study used data from 22 Tanzanian ports. The variables port infrastructure and foreign trade are utilized in this study to examine the impact of economic growth. The data used in this study is based on an annual basis and spans 2005 to 2017.
Variables and Description.

Note. Tsh. = Tanzania shillings; MWTC = Ministry of Works, Transportation, and Communication.
In this study, we choose variables based on past research and data availability. For example, port infrastructure proxy, quay length, and port gantries (Cullinane et al., 2005), terminal area (Yeo, 2010), and port berths (Deng et al., 2013). For international trade proxy, cargo import and export were previously used by (Bottasso & Conti, 2010), container throughput (Bottasso et al., 2014), transshipment (Boopen, 2006), for economic growth proxy GDP (Song & Mi, 2016), GDP per capita (Park et al., 2019), urban population, and Annual wage income (Li, Liu et al., 2018).
The following are the concepts used in the model: Port infrastructure has four observed variables: port quay length in metres (PI 1), the terminal area in square metres (PI 2), number of port gantries (PI 3), and number of berths (PI 4). International trade has four observed variables: transit cargo import (TRD1), transit cargo export (TRD 2), transshipment (TRD3), and container throughput (TRD4) (ECO4). The authors chose the Structural Equation Model (SEM) as a valuable tool for data analysis because of the latent criteria they used. According to Shah and Goldstein (2006), the appropriate SEM sample size is greater than 100. As a result, this study employed the annual data from 2005 to 2017, yielding 169 observations, sufficient for the SEM analysis. Table 3 shows descriptive statistics identifying constructs, items, and initials.
Descriptive Statistics for Variables.

Note. Tsh. = Tanzania shillings; N = Number of Observations.
Methodology
In this study, we used the Structural Equation Modeling (SEM) method to determine the correlation of variables (Kursunoglu & Onder, 2019). Moreover, confirmatory factor analysis (CFA) is utilized to verify the proposed hypothesis and demonstrate the flattening of the relationship between variables (Kumari & Sharma, 2017). Actually, the power of SEM is the capacity to evaluate a comprehensive model integrating both measurement and structural consideration (Lu et al., 2007). However, Asadi et al. (2019) discussed the following benefits of SEM: One, instantaneously examines numerous variables; two, allows for the integration of various variables; and three, allows for the measurement of errors during exploration. These benefits pique/arouse our interest in employing the SEM approach to investigate the association between variables. Structural equation modeling used to create a structural rapport design based on a hypothesis and assess the model’s success versus the inconsistency of examined data (Su et al., 2016).
Furthermore, the path model was utilized to perform the structural analysis. The path model provides easier more way of modeling mediation, effects (direct and indirect), and other complex link among variables. Path analysis is a type of SEM in which structural relationships between observable (latent) variables are modeled (Lei et al., 2007). The Analysis of the Moment Structures (AMOS23) Program is used to examine the validity and reliability of data and estimate model fitness indices. The choice of acceptable measurement in this study is based on a review by Haier et al. (2014) who suggested that approved indicators of various levels be used.
However, we used goodness–of–fit indices to estimate the consistent model performance of constructs, as proposed by (Deng et al., 2013; Kock, 2019; Sharma et al., 2017). The following are recommended model fit performance indicators: If the value is 0.05, chi-square statistic is best, root mean squared error of approximation (RMSEA) is best if the value is 0.08, and goodness-of-fit index (GFI) is best if the value is 0.90. Also, if the adjusted goodness-of-fit index (AGFI) value is less than 0.90, it is the best (Su et al., 2016). Furthermore, the Tucker-Lewis index (TLI) and comparative fit index (CFI) are best if the value is >0.95, according to Li, Liu et al. (2018) and Ouyang et al. (2017).
Validity and Reliability of Data
Determining the authenticity and trustworthiness of data is critical in SEM analysis. To assess the validity, unidimensionality, and reliability of data, we employed convergent validity, discriminant validity, and composite reliability (CR). The departed gauge can be used to determine the degree of the link between two measures of theoretically related constructs and it can be calculated using the average variance extracted (AVE). The amount of variation sensed by the paradigm compared to the one attributed to measurement error is denoted by the average variance extracted (AVE). To illustrate the robustness of the latent variables utilized in the structural equation model, the AVE values of latent variables/constructs must be >0.5, demonstrating the discriminant validity of the model (Hair et al., 2014). The degree of validity between theoretically unrelated constructs is confirmed through discriminant validity. The square root of the average variance extracted (AVE) is used to calculate discriminant validity. T-values can be used to assess convergent validity by looking at the loadings and their statistical significance. Discriminant validity is calculated by finding the square root of the average variance extracted (√AVE). Convergent validity can be evaluated by examining the loadings, and they are statistically significant through t-values (Bentler & Bonett, 1980). T-values are identified as essential ratios in the AMOS setting (CR). For the estimate to be accepted, critical ratio values given by various writers should be >2 or −2 (Bagozzi & Yi, 1988). However, item reliability (R2), on the other hand, can be used to assess an item’s dependability. R2 values greater than 0.5 are considered dependable (Najaf et al., 2018). We also used Cronbach’s alpha to determine the quality of the data. Cronbach alpha is a statistic that measures the internal data consistency of a set of construct chronic variables. A higher Cronbach alpha value suggests an appropriate internal consistency threshold for observed variables and vice versa. Our findings show that the validity and dependability of our results are promising (Table 4).
Cronbach’s Alpha and AVE of Different Constructs.

Results
Model Fit Measurement
The statistical findings of the prospective SEM are summarized in Table 5. The second column of the table shows the recommended value for model fit performance. The third column of the table indicates the initial model results. The goodness-of-fit indices obtained show that the model did not have the fit cut-off points suggested by different authors. The obtained results indicate that the initial model should be improved to meet the required value level. In improving the model, squared multiple correlations and critical value ratio will be applied as the average base for the validity and reliability of items. Based on (Lu et al., 2007; MacCallum et al., 1996) suggestions, constructs with critical value ratio loadings less than 2 and square multiple correlation loading less than .5 are not recommended in the model. In the first run of the model, items such as domestic freight import (PI 2), transit cargo, import and export (TRD1 and 2), urban population growth (ECO3), and annual average income (ECO4) were loaded below the recommended level (CR → 2 and R2→ 0.5) on the relevant latent variable and hence expelled for further analysis (Bagozzi & Yi, 1988). After removing the low loadings variable, adding modification indices, and repeating the CFA, the model improved positively. The attained results of the revised model are indicated in column 4 of Table 4. These findings illustrate that the goodness – of –fit model indices meet the suggested benchmark whereby χ2/df = 1.573, CFI = 0.994, TLI = 0.978, GFI = 0.898, AGFI = 0.784, RMSEA = 0.058, and Pclose = 0.358. This result shows that the model successfully delivers the rapport between port infrastructure, international trade, and economic development.
The Fit Model Measurements.

Structural Model Validity
The final structural equation modeling, shown in Figure 6, meets the criteria for goodness-of-fit indices. The Tucker-Lewis Index (TLI = 0.978), Comparative Fit Index (CFI = 0.994), Goodness-of-Fit index (GFI = 0.898), Average goodness-of-fit index (AGFI = 0.784), and root mean squared error of approximation (RMSEA = 0.058) were used to describe the model fit indices. These results suggest that no further changes are necessary.

Final structural model.
Table 6 shows the association between port infrastructure, international trade, and economic growth in modernized structural equation modeling. With estimates of 4.349, CR of 4.464, and p-value of 0.001, which is less than the threshold level of 0.05, the results suggest that seaport infrastructure directly correlates with economic growth. Furthermore, with estimates of 4.937, CR → 5.287, and p-values → 0.001, lower than the acceptable value of 0.05, the obtained results reveal a directional correlation between seaport infrastructure and foreign trade. In addition, with estimates of 2.849, CR → 2.035, and a p-value → 0.04, it is less than the proposed benchmark of 0.05 (Hair et al., 2014). The link between international trade and economic growth was found to be significant in this study.
Results of a Modernized Structural Equation Modeling.
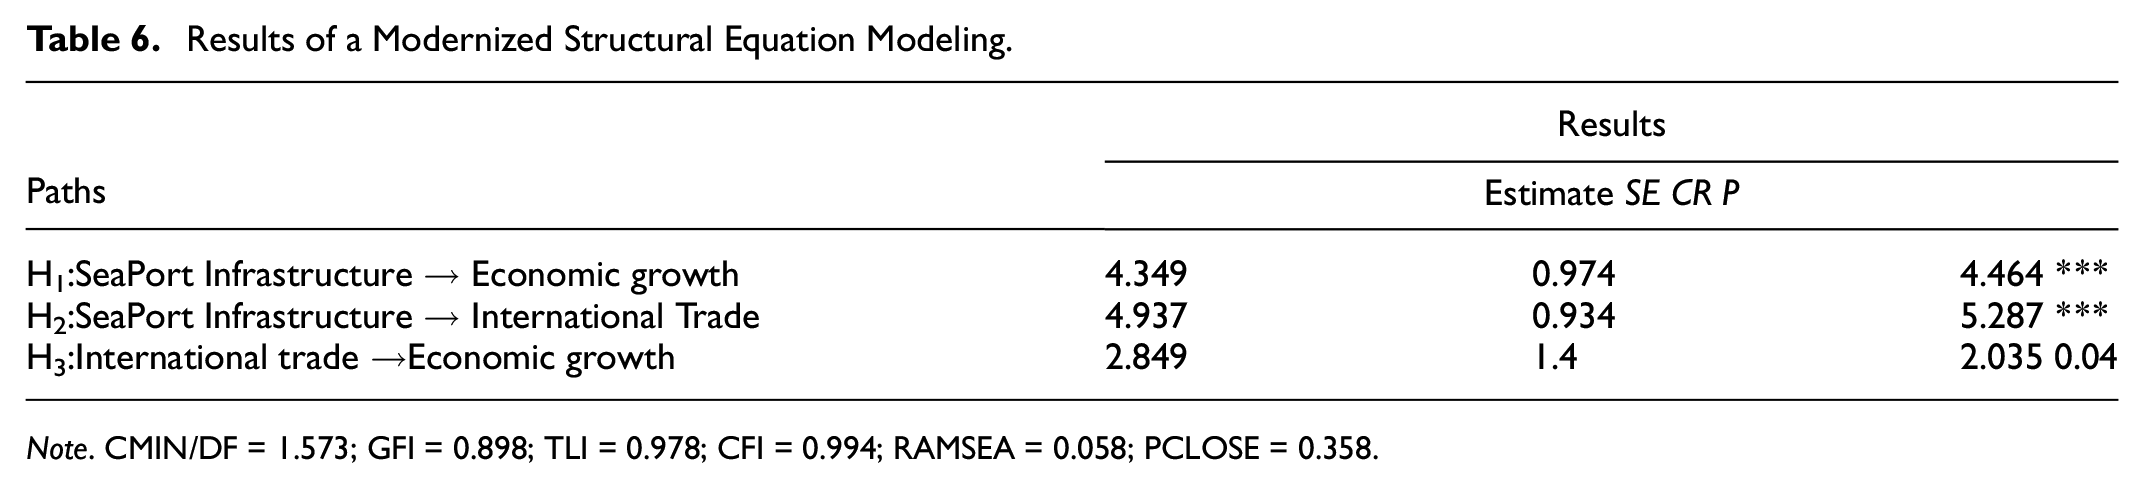
Note. CMIN/DF = 1.573; GFI = 0.898; TLI = 0.978; CFI = 0.994; RAMSEA = 0.058; PCLOSE = 0.358.
Moreover, Table 7 summarizes the regression factors, standard error (SE), critical ratio (CR), and item reliability (R2) of each construct. According to (Hair et al., 2014), the critical ratio (CR) and item reliability (R2) value should be >2 or less than −2 and >0.5, respectively. The findings presented in Table 7 reveals that all individual constructs’ values are higher than the recommended critical ratio of 2, except the container traffic value. The value indicates that all variables are measured in the same constructs and reveals convergent validity in each construct. Moreover, Table 7 shows R2 value is >0.05, as recommended in the study by Deng et al. (2013).
Constructs Regression and Standardized Regression Weights.
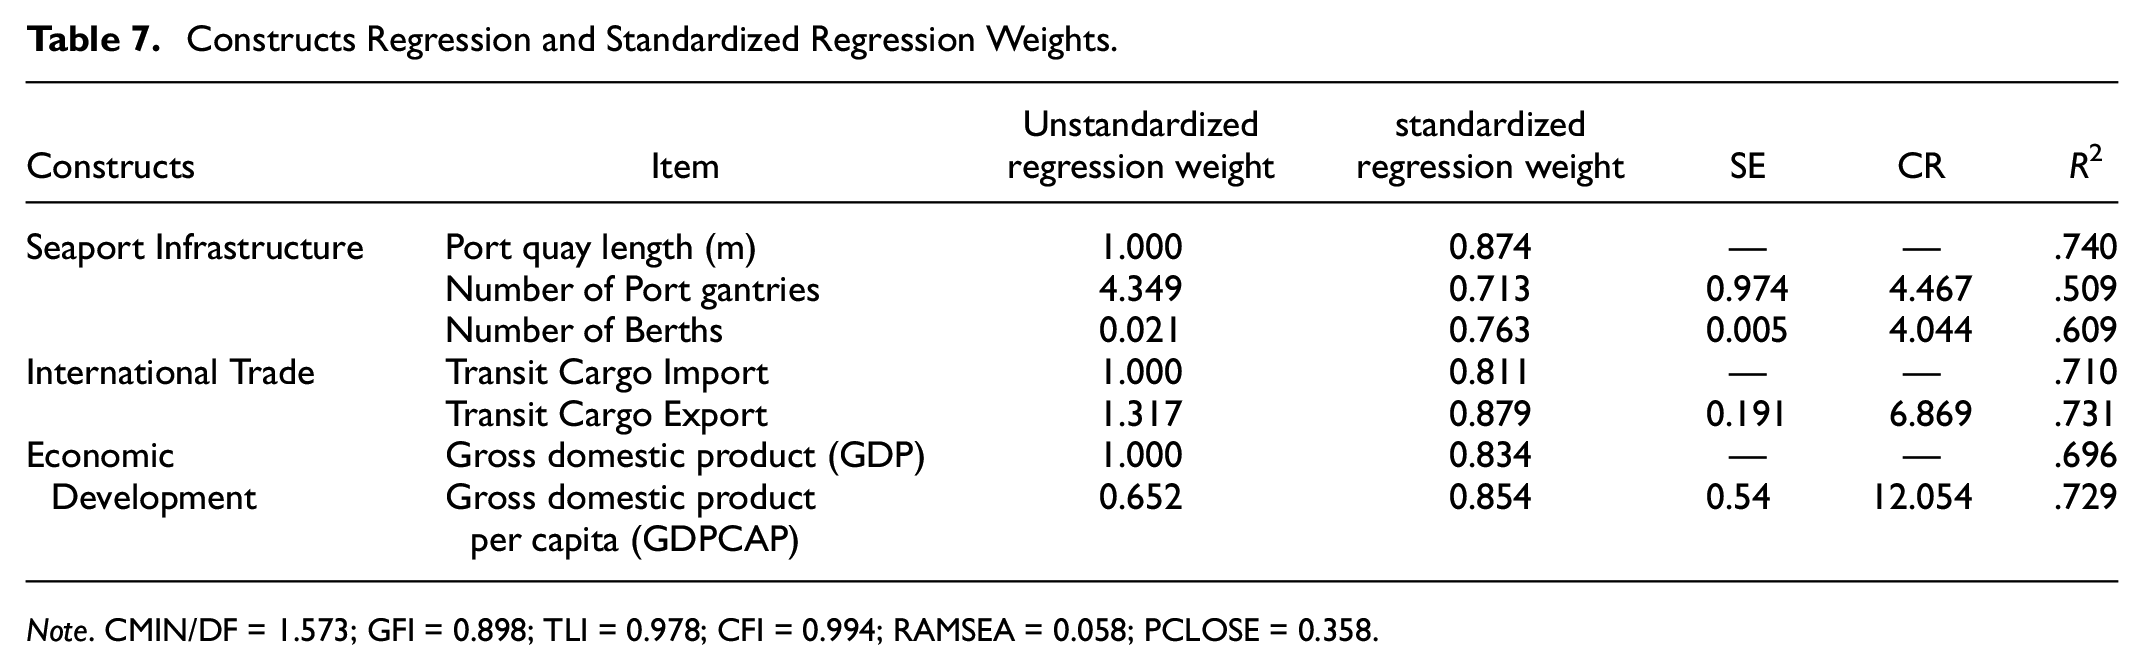
Note. CMIN/DF = 1.573; GFI = 0.898; TLI = 0.978; CFI = 0.994; RAMSEA = 0.058; PCLOSE = 0.358.
Moreover, in assessing the validity and reliability of variables, Bagozzi and Yi (1988) and Hong et al. (2011) recommend that value of composite reliability (CR) should be >.7, and the average variance extracted (AVE) should be >.5. Table 8 shows, the value of the composite reliability and AVE of port infrastructure are (.91, .67), international trade (0.88, .65) and economic growth (.98, .7) jointly. Therefore, these variable values rely on the accepted criteria of >.7 and >.5, respectively.
Scale Statistics, Composite Reliability, and AVE of Each Variable.

Casual Pathway between Seaport Infrastructure and Economic Development
Table 9 summarizes causal pathways between the port infrastructure and economic growth and the mediator obtained by SEM in examining the linkages between variables. In particular, three significant pathways are identified. (i) Port infrastructure → economic growth. (ii) Port infrastructure → International trade. (iii) International trade →economic growth. These results indicate that seaport infrastructure has positive effects on international trade and economic growth. Moreover, the study also determined the significant relation between international trade and economic growth.
Casual Path Estimates.

Note. CMIN/DF = 1.573; GFI = 0.898; TLI = 0.978; CFI = 0.994; RAMSEA = 0.058; PCLOSE = 0.358.
Discussion
Transport infrastructure continues to be the backbone of the economic growth of the regions. The multimodal transport infrastructure, such as road, railway, port, and the airport, perform an essential function in promoting the region’s economy and linking other economic activities. Transport infrastructure has an impact on the area’s economic development through boosting the transportation and industrial sectors (Banister, 2012; Banister & Berechman, 2001), attracting foreign direct investment (Pradhan & Bagchi, 2013), influencing local and international trade (Pereira et al., 2017). Also, transport infrastructure creates employment, improves socio-economic activities, transfer of technology, and labor mobility (Barzin et al., 2018).
Since port infrastructure executes crucial activities in promoting the region’s economy. The Tanzania government should emphasize investing in this industry. In this light, the purpose of this research is to develop a structural equation modeling model to examine the impact of seaport infrastructure and international trade on Tanzania’s economic growth. The findings obtained from this study are presented hereunder.
Seaport infrastructure and economic growth are found to be inextricably linked
Moreover, on the correlation between transport infrastructure and international trade, the study results show a significant correlation between port infrastructure and international trade
In addition, it was discovered that there is a significant correlation between International trade and economic growth
Conclusion and Recommendations
Fundamental Conclusion
As explained by previous authors, port infrastructure is the most prominent factor for economic development (Pettit & Beresford, 2009). Therefore, this study is sought to assess the repercussions of port infrastructure in promoting economic development in Tanzania. The study is based on information from 2005 to 2017, using Structural Equation Modeling (SEM). The following are the results obtained;
A significant linkage exists between port infrastructure and economic growth. The results indicate that port infrastructure devotes to economic growth, which necessitates improvement in port infrastructure. In a variety of ways, the port infrastructure helps economic growth. For instance, port infrastructure is the gateway to the industry’s raw materials and other processed goods. Therefore, improving port infrastructure will increase the number of port throughputs and thus promote economic growth.
A direct relationship exists between port infrastructures and international trade. The findings show that port infrastructure influences international trade within and outside the region, and also the availability of international trade fosters the development of the port. As revealed by different authors, about 80% of international trade depends on marine transportation; which means that most goods and services are transported through port. Moreover, improved port infrastructure will increase the importation and exportation of products and services. Furthermore, increasing international trade within the regions improves the port’s host country economy and the neighboring areas. For example, Tanzania’s ports serves East Africa countries and particularly landlocked countries. Therefore, this increases trade activities between Tanzania and other East Africa countries.
A significant relationship exists between international trade and economic growth. This finding means that international trade contributes to the growth of the economic sector. As a result, international trade is critical to any country’s economic progress, even though other factors can help the region’s economy grow. Therefore, the port administrator should be aware that Tanzania’s economy is dependent on international trade and consequently invest in port infrastructure development.
From the above results, we sum up that port infrastructure has a significant impact on promoting Tanzania and its neighboring countries’ economies.
Study Contribution and Recommendations
This study examines the influence of seaport infrastructure on economic growth in the context of Tanzania’s three regions where significant seaports are located. Although several past studies investigated the impact of Port infrastructure on economic growth, only a few studies have focused on the contribution of seaport infrastructure on economic growth in Africa, specifically in Tanzania. This study fills this intellectual gap. Moreover, based on the study results, seaport cargo throughput is an important proxy for economic growth.
Our study recommends that the Tanzania government improves cargo transportation and port efficiency and intermodal transportation infrastructure systems such as road, railway, and airport, because these modes of transport infrastructure influence each other. In addition, this study faced some limitations, thus other research areas are proposed. First, due to limited data, this study focuses on the significant contribution of seaports and leaves asides other lakes and small harbors. Therefore, other researchers should research on the input of lake ports and small seaports on economic growth. Secondly, another area for further research should examine the effects of port spillover on the economic growth of ports neighbors’ economic growth in the East Africa Central corridor. Third, this study did not include the impact of inland and container ports on economic growth. Thus, further research would focus on the effects of inland and container ports on Tanzania’s economy.
Footnotes
Declaration of Conflicting Interests
The author(s) declared no potential conflicts of interest with respect to the research, authorship, and/or publication of this article.
Funding
The author(s) received no financial support for the research, authorship, and/or publication of this article.
Data Availability
The data supporting this study’s findings can be obtained from the corresponding author upon request.