
Abstract
The main objective of this article is to use the logistic regression model as one of the generalized linear models to determine some factors that influence academic tripping at the University of Tabuk. In this case, student status (tripped, non-tripped) is considered as a binary variable. The data of this article were collected using a survey based on a questionnaire. The results showed that the most important factors affecting student’s academic tripping have focused on the items of educational & academic, and family & economic factors, namely (a) the current speciality does not meet student’s aspiration, (b) it is difficult for the student to understand and accommodate some lectures, (c) it is difficult for the student to reconcile the academic load with the offered courses, (d) participation in extra-curricular activities, (e) difference between university and secondary schools systems, and (f) student does not receive a college bursary regularly.
Introduction
The academic tripping phenomenon is considered a challenge for the University decision-makers, which all times look for solutions. Many factors lead to this phenomenon, some regarding the student himself and the internal environment around, the other concerning the educational environment and academic system, and some related to the external environment. Academic tripping can be defined by those students whose academic achievement is lower than that of their peers or whose level of education is lower than their intelligence proportion or academic performance. Based on the regulations issued by the deanship of Admission and registration at the University of Tabuk, academic tripping is defined in this article as the decrease in the student’s GPA to less than 2 out of 5.
There have been many studies that discussed the factor affecting student performance and the academic tripping phenomenon causes and treatments. Jaggia and Kelly-Hawke (1999) used the 1992 Massachusetts Educational Assessment Program (MEAP) test scores from 4Ih, 81h, and 12Ih grade students to measure student performance, they concluded that family background and the stability of a community were the main factors affecting student performance, while a higher levels of spending have no consistent or systematic relation with student performance. Harb and El-Shaarawi (2007) investigated the socio-economic characteristics of students at the College of Business and Economics-UAEU in relation to these students’ performance and taking into account variables on the UAE Society, they used a sample of 864 CBE student and regression analysis. This study showed that the most significant factor that affects student’s performance was the competence in English, while the most negative factors were missing too many lectures and living in a crowded household.
Karemera et al. (2003) studied the impact of academic climate, background, and social environment on student performance and satisfaction at South Carolina State University’s School of Business, they used a five-point scale to address student preferences and satisfaction with academic programs and various services. The Chi-square and Likelihood ratio test statistics revealed that satisfaction with the educational environment and services as well as the precedent high school achievements were significantly correlated with college performance, while the probability distribution of college majors, the adequacy of library services, and the out-of-class experiences were also significantly associated with positive college outcomes. Ostaz and Sobh (2016) discussed the academic level of tripped students and causes besides the role of media and information technology at Al-aqsa University in Gaza, they sampled 300 students and used analytical descriptive methodology as well a questionnaire, the study showed that the academic level for the tripped students was equal to 80 % as proposed level, whereas the main factor of the academic tripping was the educational plans. Sawalha and Al-Omari (2013) identified the evaluation level of academic underperformance causes from the perspective of tripped students at Al-Ahliyya Amman University (AAU), and the relationship between these causes and other variables: sex, type of faculty, and students’ academic year, they sampled 133 male and female students and utilized descriptive-analytical methodology as well as a questionnaire. The study concluded that the most critical factors behind the academic tripping were the domain concerning educational (academic) difficulties, and difficulties relating to students’ personality and social relationships. Alia (2016) identified and classified the causes of the academic tripping at the University of Dammam, Saudi Arabia, from the students’ viewpoint using factor analysis. The research found four latent factors behind academic tripping included social and economic characteristics of the student, the educational process and the performance measuring, academic advising, and registration. For more articles, see Di Gresia et al. (2007), Mahasneh et al. (2013), Thompson et al. (2004).
The main objective of this article is to use the logistic regression model as one of the generalized linear models to characterize some factors that influence the academic tripping at the University of Tabuk, KSA. The student status (tripped, non-tripped) is considered as a binary variable. The study is based on the questionnaire as a method for data collection as well as gathering supplementary information from the deanship of admission and registration records. The University of Tabuk is located in Tabuk, northwest of Saudi Arabia, established in 2006. The academic level of students enrolled in this university is a bit low compared to other universities in Saudi Arabia, especially the faculty of Science. A high percentage of tripped students has been reported by the faculty of Science’s administration which exceeds 30% in some departments. Therefore, the University of Tabuk was assigned to be the target population for the study while the data were collected from the students of the faculty of Science.
To the best of our knowledge, no similar studies have been carried out, as regards the use of logistic regression to identify the factors that influence academic tripping. Logistic regression is able to identify the rates of influence of each factors on the academic tripping. Therefore, we think this method the most reliable analysis technique to investigate this cloudy subject rather than factor analysis.
This article is organized in the following manner. Next section presents the methodology, followed by the Sections “Data Description,”“Data Coding,”“Results and Discussion.” Final section gives a brief summary and conclusions.
Methodology
Logistic Regression Model
Logistic regression model is the most popular model for binary data originated in the 1940s by Joseph Berkson (Cramer, 2000). Generally, used to study the relationship between a binary response variable and predictor variable(s) (can be either continuous or categorical). The response variable
Suppose we want to model
Let
The simple logistic regression model expresses the logistic function of

where
The odds in favor of success are:

Taking the natural logarithm for each side of equation (2), yields

Function
For multiple predictor variables

Maximum Likelihood Method
Likelihood method is the most appropriate technique used to estimate parameters of the logistic regression model (Hosmer et al., 2013). If

Since

So, the log-likelihood function is

Maximizing the function of equation (6) with respect to

and

Equations (7) and (8) called likelihood equations. Second derivatives of
Relationship Between Odds Ratio and Simple Logistic Regression
The Odds is the ratio of the probability that an event will happen to the probability that will not happen, hence it defined as (Hailpern & Visintainer, 2003):

If predictor variable

The Odds Ratio is defined as

and log of Odds Ratio is

To test of the

Model Description
Student GPA is partitioned into two sets, [0, 2) tripped student and [2, 5] non-tripped student, this new variable presents the dependent variable in this article. So, consider the indicator variable

Therefore, the following simple logistic model is used :
and

where the logit function

Data Description
The data of this article were collected using a survey based on a questionnaire. The questionnaire has been designed to address the study problem and objectives depending on the theoretical framework and previous studies on tripped students. To check the face validity of the survey, questionnaire has been reviewed by a group of experts in the disciplines related to the subject of the study. The experts evaluated whether each of the measuring items matches any given conceptual domain of the concept. A questionnaire consists of three parts: demographic information, five items each rated on 1 = Yes and 2 = No, furthermore 36 items that assess 4 domains. Each item of these domains rated on a 3-point Likert scale from 1 to 3 where 1 = disagree, 2 = to some extent, and 3 = agree. These domains include Educational & academic factors with 16 items, Family & economic factors involve 6 items, Personal & social factors with 8 items, and Academic advising includes 6 items (See Table 6 in Appendix that gives information about the domains and their corresponding items). The study’s population consists of all students in the faculty of Science at the University of Tabuk in KSA, divided into two groups according to the academic situation, including tripped and non-tripped students. Each group was divided into subgroups involve the six departments, while each department was decomposed into other subgroups include male and female students (see Figure 1). The sample was randomly selected from the population. The sample size was determined depending on the size of each group using the stratified sampling with the proportional allocation method. The number of respondents were selected to be in the sample from tripped students was 121, representing 30% of the entire tripped students, while we sampled 139 of non-tripped ones, representing 10% from the non-tripped students. The sample details are shown in Table 1 (Noting that the Statistics department did not contain female students during the period of this study).

Sample structure.
Sample Sizes in Details.

Reliability analysis was used to determine the internal consistency of the scales using Cronbach’s Alpha. Table 2 shows Cronbach’s alpha values for each domains and the entire questionnaire.
Internal Consistency of the Questionnaire.

From Table 2, it is clear that Cronbach’s alpha values for all four domains were greater than .8; furthermore, the alpha value for the overall questionnaire was .90; this means the questionnaire has a high degree of consistency, which will achieve the objectives of the study.
Data Coding
Since the student’s academic situation (AcSit) is transferred into two sets, tripped and non-tripped. Therefore, AcSit is assumed to be influenced by some variables include 36 items that constitute the 4 domains of the questionnaire include the 16 items of the Educational & academic factors (EdAc_1 to EdAc_16), 6 items of Family & economic factors (FaEc_1 to FaEc_6), 8 items of Personal & social factors (PeSo_1 to PeSo_8), and the 6 items of Academic advising (AcAd_1 to AcAd_6). Logistic regression is performed with AcSit as the dependent variable in presence of independent variables include each of these 36 variables EdAc_1 to EdAc_16, FaEc_1 to FaEc_6,PeSo_1 to PeSo_8, and AcAd_1 to AcAd_6. Table 3 gives description of these independent variables.
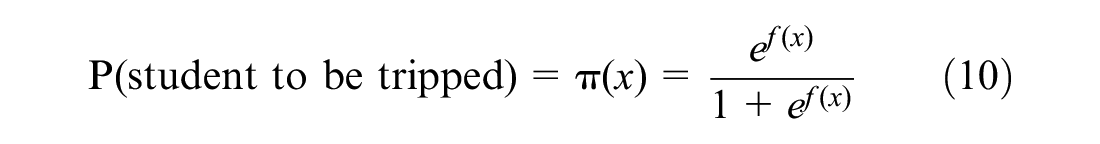
Referring to the Model of equation (10), the following Estimated logistic model is used

with the logit function

where
Description of Independent Variables.

Results and Discussions
Statistical analysis of the data is performed using SPSS (version 22.0.0). A p value of less than .05 is considered to indicate statistical significance. Logistic model of equation (11) is utilized. The maximum likelihood procedure explained in Subsection “Maximum Likelihood Method” is used to estimate the parameters of the model. Moreover, to test the statistical significance of the model coefficients Wald test of equation (9) is applied.
Since the main objective of this article is to use the logistic regression model to determine some factors that are influencing the academic tripping at the University of Tabuk, KSA, where students of the faculty of Science are used as a case study, the results decomposition into three parts involving all students male and female, Male students and female students.
Students’ Pre-Academic Levels
Before conducting data analysis, we perform a t-test for two independent samples to test whether students’ academic level before joint the University of Tabuk different for the tripped and non-tripped students among the three groups of students. To do that, we used the weighted percentage, which used to joint the university. This percentage is computed from three components include high school GPA, and the two pre-university exams where in KSA are GAT and AT Hassan and Al-Razgan (2016). Table 4 shows the t-test results concerning the three groups of students.
Results of Two Independent Samples t Test.
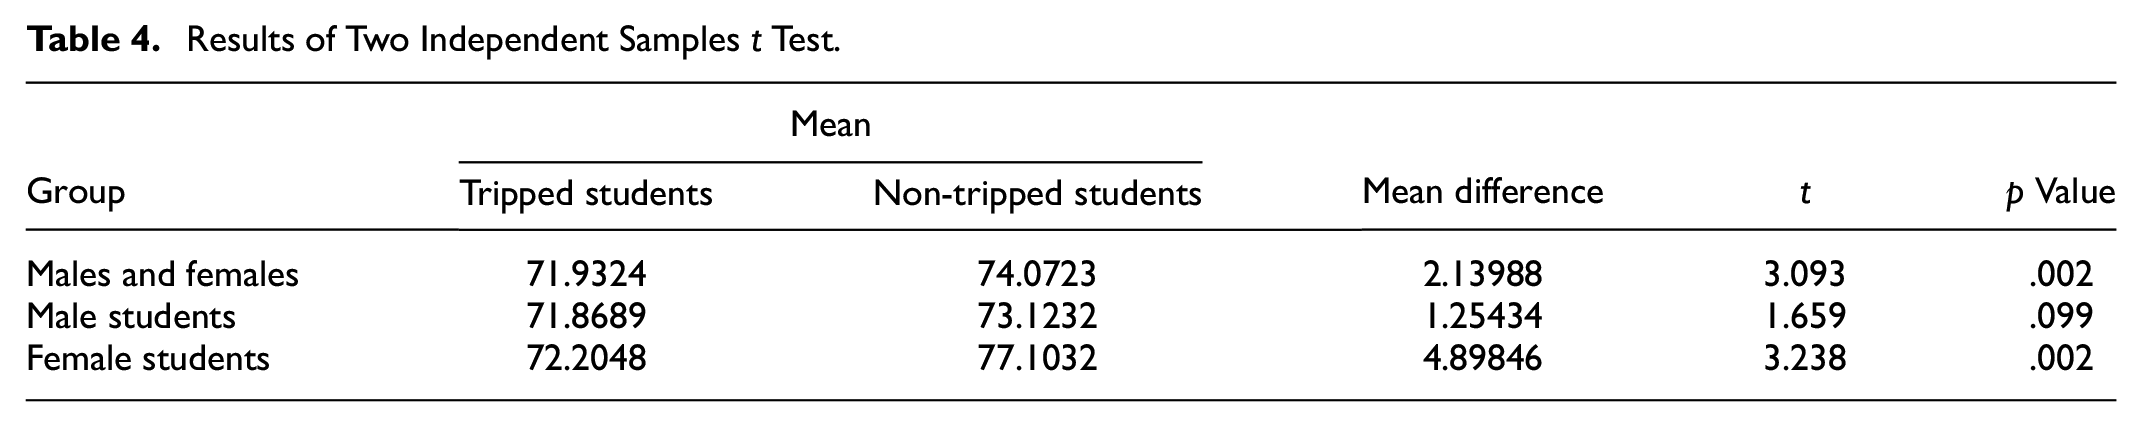
Based on the results in Table 4, it is observed that the p values for all students and female students are less than .05, which indicate that there is a significant difference in pre-academic level between tripped and non-tripped students, which means the tripped student has a problem in his academic level before joint the university. In contrast, the p value for male students is greater than .05, which means that the pre-academic level for tripped and non-tripped students is the same (see Figure 2). Therefore, for male students, any factors affecting their academic tripping will be attributed to the university stage, while the results will be obtained from the rest two groups will be affect by the pre-university stages.

The tripped and non-tripped students’ weighted percentage means among the three groups.
All Students of Faculty of Science Male and Female
In this subsection, the logistic regression technique is performed on the data consist of all students in the faculty of Science male and female. Table 5 explains the results of models when the dependent variable AcSit includes in the model alone.
Dependent Variable in the Model Alone for All Students.

From Table 5, it is observed that: concerning all students in the faculty of Science, exp(β) = 3.055, this means that the student is three times more likely to be tripped than to be non-tripped one.
Table 10 shows the results of the significant logistic regression models that were fitted, where each independent variable of the educational and academic factors added to the model for all students. From Table 6 we see that
Educational and Academic Factors Added to the Model.

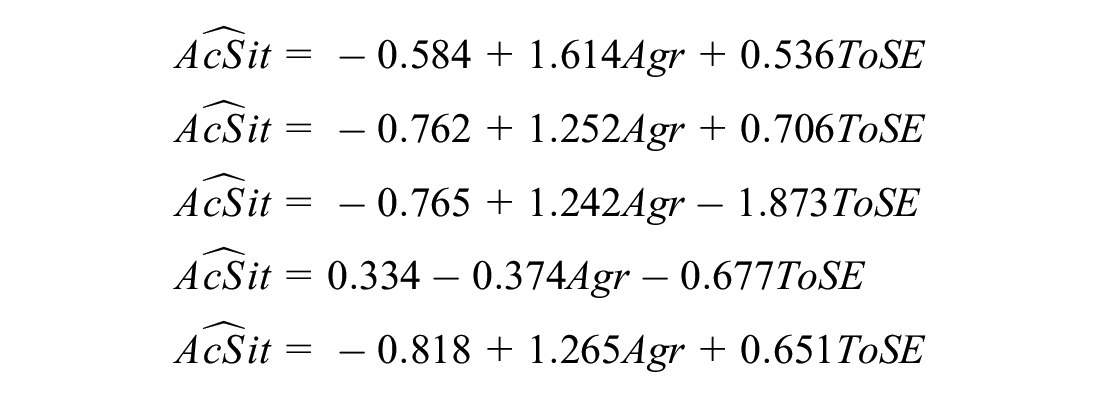
Regarding the 16 items of the educational & academic factors, the only significant logistic regression models are that contain the five categorical variables (items) EdAc_1, EdAc_2, EdAc_4, EdAc_13, and EdAc_14 as independent variables, so the five models, respectively, are as follows

with the logit model


with the logit model


with the logit model


with the logit model

and

with the logit model

Concerning the first model, the Cox and Snell is
Regarding the Second model,
Regarding the third model,
From the results of the four model, it can be observed that
Based on the results of the five models, it is clear that
Table 7 presents the results of the only one significant logistic regression model that was fitted, where the FaEc_6 variable of the Family & Economic factors added to the model for all students in faculty of Science. From Table 7, the logit model is

Family and Economic Factors Added to the Model.

Regarding the other two domains, Personal and Social factors and Academic Advising factors there is no significant logistic regression model fitted.
Male Students
This subsection pertains to discuss the results of logistic regression models performed to the data involves male students in the faculty of Science. Table 8 shows the results of the significant logistic regression models that were fitted, where each independent variable of the educational & academic factors added to the model. Based on the results in Table 8 we see that, regarding the 16 items of the educational & academic factors, the only the significant logistic regression models are EdAc_1, EdAc_2, EdAc_4, EdAc_13, and EdAc_14 as independent variables, so the five logit models respectively are
Educational and Academic Factors Added to the Model.

Concerning the five models, the values of the Cox & Snell, respectively, are
Table 9 presents the results of the only one significant logistic regression model that is fitted, where the FaEc_6 variable of the Family & Economic factors added to the model.
FaEc_6 Variable of the Family and Economic Factors Added to the Model.

From Table 9, the logit model is

Female Students
This subsection explains the logistic regression models’ results on the data, including female students in the faculty of Science.
Table 5 shows the significant logistic regression models’ results, where each independent variable of the educational & academic factors added to the model. From Table 10 we observe that, concerning the educational & academic factors’ items, the only significant logistic regression models are EdAc_1, EdAc_2, EdAc_4, EdAc_14, and EdAc_15 as independent variables. The values of the
Educational and Academic Factors Added to the Model.

FaEc_3 and FaEc_6 Variables of the Family and Economic Factors Added to the Model.

From Table 11, we observe that regarding the Family & Economic factors’ items, the significant logistic regression models are FaEc_3 and FaEc_6. The values of the
Conclusions
This paper examined the factors influencing the academic tripping at the University of Tabuk-KSA taking male and female students of the faculty of Science as the case study using the logistic regression model. The study’s analysis is broken down into three parts that include both males and females, male and female students. The findings reveal that among these three parts of the students, the most important factors affecting students’ academic tripping restricted on the educational & academic, and Family & Economic factors, namely: (a) the current specialty does not meet student’s aspiration, (b) it is difficult for student to understand and accommodate some lectures, (c) it is difficult for student to reconcile the academic load with the offered courses, (d) participation in extra-curricular activities, (e) difference between university and secondary systems, and (f) student does not receive a college bursary regularly. Moreover, for the female student, one more reason added, which is the preoccupied with the requirements of her family. The results also show that the other two factors involve Personal & social factors and Academic advising factors, which have not affected the academic tripping significantly. In the light of findings in this study, we recommend establishing an accurate system to follow up on students’ progress and evaluate the role of the academic advising unit in controlling the students’ dropout rate and also instituting a risk management unit that is responsible for identifying the key factors having a significant influence on the students’ academic performance.
Footnotes
Appendix
Description of the Domains and the Corresponding Items.

| Factors | Item # | Item name |
|---|---|---|
| Educational and academic factors | 1 | The current specialty does not meet my aspiration. |
| 2 | I find it difficult to understand and accommodate some lectures. | |
| 3 | The times for lectures in the timetable are not appropriate. | |
| 4 | I find it difficult to reconcile the academic load with the offered courses. | |
| 5 | The coincidence of the periodic exams and the lectures negatively affects my academic achievement. | |
| 6 | There is mismatch in the grade distribution between the semester exams and the final exam of the course | |
| 7 | I am not interested in taking notes and writing during the lectures | |
| 8 | I use mobile during lectures continually | |
| 9 | The overcrowding of lecture rooms negatively affects my capacity to understand some lectures | |
| 10 | Unavailability of scientific sources and references | |
| 11 | Teaching in English negatively affects my understanding | |
| 12 | I have a weekly schedule for studying my lessons | |
| 13 | Participation in extra-curricular activities negatively affects my academic achievement. | |
| 14 | The difference between university and secondary systems | |
| 15 | The cooperation of some teachers is not satisfactory | |
| 16 | I find it difficult to understand the explanation of some of the teachers | |
| Family and economic | 1 | Academic follow-up by the family is weak |
| 2 | Communication between my guardian and the college is not satisfactory | |
| 3 | My commitment towards the requirements of my family negatively affects my academic achievement | |
| 4 | I find it difficult to get to the university on time for lectures | |
| 5 | The prices of the university stationery are high | |
| 6 | I do not receive a college bursary regularly | |
| Personal and social | 1 | my motivation to study is low |
| 2 | I miss some of the lectures | |
| 3 | The panic I feel while taking tests negatively affects my performance | |
| 4 | I am addicted to using the Internet for other purposes than study | |
| 5 | I would like to get a job more than study | |
| 6 | I have a problem with time management and its optimal use | |
| 7 | The time I spend with friends negatively affects my studies | |
| 8 | The majority of my friends are of average academic performance and below | |
| Academic advising | 1 | |
| 2 | My relationship with my department is weak | |
| 3 | I am not inclined to consult my academic advisor when preparing my course schedule | |
| 4 | The number of academic advising sessions during the semester is insufficient | |
| 5 | I am not familiar with all the requirements for academic advising | |
| 6 | I find it difficult to understand some of the university’s academic rules and regulations |
Declaration of Conflicting Interests
The author(s) declared no potential conflicts of interest with respect to the research, authorship, and/or publication of this article.
Funding
The author(s) disclosed receipt of the following financial support for the research, authorship, and/or publication of this article: This work was supported by funding from the University of Tabuk (Project No. S-0143-1439).