
Abstract
Environmental degradation is one of the most urgent challenges facing governments and communities. Thus, the study aims to explore the influence of tourism development (TO), economic growth (GDP), and globalization (GLOB) on the environment (measured by the ecological footprint index, EF) in the Regional Comprehensive Economic Partnership (RCEP) countries. By adopting a panel non-linear autoregressive distributed lag (panel NARDL) approach, the outcomes reveal that the impact of TO is an asymmetry in the long run but symmetry in the short run. More precisely, this study finds that positive changes in TO have a negative impact, while negative changes positively drive EF in the long run. In addition, the result also indicates that GDP positively influences EF, while GLOB has a significant negative impact on EF. Based on these findings, the work suggests practical policies for RCEP’s administrators to promote tourism and reduce ecological deficit.
Introduction
Many studies (Croes et al., 2021; Sun, 2018; Yang et al., 2020) confirmed that the tourism industry not only promotes economic growth but also contributes to socio-economic stability. Tourism development (TO) has brought many benefits to a country and its resident, such as promoting infrastructure, attracting foreign direct investment, generating new jobs, and stimulating cultural change, thereby boosting economic growth. However, many tourism activities depend on the natural eco-system exploitation, so tourism promotion leads to increased transportation, hunting, and energy consumption, and thus the link between tourism activities and environmental degradation is generated (Adebayo et al., 2022; Akadiri et al., 2018; Khoi et al., 2021; Wang et al., 2021). One urgent challenge that every country or region has been facing is maintaining the balance between TO and its impact on environmental quality (Akadiri et al., 2019; Debbage & Debbage, 2019; Dolnicar, 2020; Sun et al., 2020). All economic policies without harmful influence on the natural eco-system and environment are appreciated. Thus, many scholars emphasize the need to understand the link between TO and environmental problems to alleviate challenges and promote effective policies for sustainable development (Akadiri, Eluwole, et al., 2020; Bramwell et al., 2016; Brauer et al., 2019; Smith & Diekmann, 2017).
Similar to tourism development, economic growth (GDP) and globalization (GLOB) can influence environmental quality through three effects (scale, composition, and technique effect). Ahmed et al. (2021) reported that the technique and composition effects of GDP and GLOB promote the use of environmental-friendly technologies and machine transformations, which in turn reduces harmful influences on the environment. On the contrary, economic expansion increases the production of goods through scale effects, and thus stimulates natural exploitation and loss in biocapacity. In previous studies, environmental degradation is measured by CO2 emissions. Recently, Dogan et al. (2020) argued that a CO2 emissions index is not a complete measure of the damage caused by human activities to nature. They suggested that the ecological footprint (EF) index should be employed because it considers all impacts of economic activities on the environment, such as land, forest, and air quality. Unfortunately, the impacts of TO, GDP, and GLOB on EF are still debated. For example, Mikayilov et al. (2019), and Godil et al. (2020) found that TO positively drives environmental degradation in Azerbaijan and Turkey, respectively, while Kongbuamai et al. (2020), and Khoi et al. (2021) presented an increase in TO leads to an increase in environmental quality in Thailand and Singapore. In addition, Akadiri, Uzuner, et al. (2020) confirmed that international tourism and squared term of GDP have a significant inverse effect, while GLOB and GDP without squared term positively drive carbon emissions in 16 selected tourism island states. As a result, scholars (e.g., Alola et al., 2019) urge the need to investigate such a relationship in specific regions and areas to foster proper policy development. Following the suggestion, the study is conducted to unravel and uncover the impact of TO, GDP, and GLOB on EF in the Regional Comprehensive Economic Partnership (RCEP) countries. RCEP is a free trade agreement that includes fifteen 10-ASEAN countries (Indonesia, Brunei, Cambodia, Laos, Malaysia, Myanmar, the Philippines, Singapore, Thailand, and Vietnam) and five other Pacific nations of Australia and China Japan, New Zealand, and South Korea. It was signed on 15th November 2020 and will take effect 60 days after it has been ratified by at least six ASEAN and three non-ASEAN countries.
This topic is essential for RCEP communities because 15 RCEP economies make up nearly one-third of the world’s population with 2.2 billion people and approximate 30% of global GDP with U.S $26.2 trillion in 2020, making the RCEP is the largest trade deal in history. With RCEP signed, it is expected to eliminate a range of tariffs (about 90%) on imports within 20 years, thus increasing regional activities such as intellectual property, telecommunications, financial services, e-commerce, and professional services as well as facilitating globalization such as international supply chains with low import-export costs among members. Furthermore, it is anticipated that RCEP will help raise the global economy by U.S $186 billion. RCEP is also the biggest tourist destination in the world. Thus, it is utterly important to understand the relationship between such macroeconomic variables to foster unified and effective policies among RCEP members. Until recently, no study has investigated this relationship in RCEP, thus making RCEP an interesting context to foster the understanding of how TO, GDP, and GLOB influence environmental quality. In addition, the seriously ecological deficit status of many RCEP members should be considered. Singapore and mainland China are listed as having the top ecological deficit in the world.
Most studies on environmental degradation or EF have been conducted in a linear framework (Khan & Hou, 2021; Muhammad et al., 2020; Paramati et al., 2017). Nevertheless, Katrakilidis and Trachanas (2012) pointed out that many macro-economic variables have been found in non-linear properties, such as energy consumption (Ha & Ngoc, 2020), financial development (Ha & Ngoc, 2022), and tourism development (Godil et al., 2020). More specifically, Ahmed et al. (2021) applied symmetric and asymmetric ARDL approaches to explore the influence of some macro-economic indicators on EF in Japan. Their results indicated that GLOB has an asymmetric effect on EF. Another study by Khoi et al. (2021) recently also indicated that only positive changes in TO significantly and negatively influence EF in Singapore. These findings possibly imply that the linear models may not be appropriate to explain EF determinants and may provide ambiguous results. Ahmed et al. (2021) emphasize that an uncomprehensive understanding (symmetry or asymmetry) may raise doubt about the effectiveness of suggested policy implications. Hence, the study adopted a panel non-linear autoregressive distributed lag (NARDL) approach to probe a potential asymmetric effect of TO on EF in RCEP nations. That means the study focuses on exploring different effects of the EF’s response to positive and negative changes in TO. If significantly asymmetric effects are found, it provides reliable evidence for tourism development planning. The boosting policies of TO only are encouraged when positive changes in TO lead to a decrease in EF, while negative changes lead to an increase in EF, and vice versa. The work believes that the profound discovery of the association between TO and EF while controlling GDP and GLOB should provide RCEP countries with more insights to develop effective and sustainable tourism development policies. The contributions of this study are summarized:
The RCEP is the largest tourism market globally, so exploring the determinants of EF could provide practical implications for administrators in sustainable development policies. This study may be pioneer research to investigate the impact of TO, GDP, and GLOB on EF in RCEP nations, where several members are listed as having the highest ecological deficit in the world.
The negative and positive changes in TO may lead to effects of different magnitude or directions in EF, which have been ignored in RCEP countries. The study applies the panel NARDL approach to fulfill this gap and draw a more comprehensive picture of how TO is associated with EF in RCEP.
A weakness of previous studies (e.g., Ahmed, Zafar, et al., 2020) is that it has ignored the structural break test in panel data, which might provide biased findings. To overcomes this omitting, the work employs a novel structural test proposed by Karavias and Tzavalis (2014). Finally, the test introduced by Dumitrescu and Hurlin (2012) provided a comprehensive understanding of the Granger causality between EF and related variables. These findings strengthen administrators’ belief in promoting tourism development and sustainable development policies in RCEP countries.
Literature Review
The Relationship Between Tourism Development and Ecological Footprint
Nature provides essential living conditions for humans, so economic activities and consumption of humans must be in harmony with nature. All economic growth policies and industries without harmful influence on environmental quality are appreciated. The tourism industry is usually expected to reduce the negative impact on the environment, and even several tourism behaviors contribute to improving environmental degradation. This expectation is confirmed by many scholars (Croes et al., 2021; Khoi et al., 2021; Muhammad et al., 2020). More specifically, Kongbuamai et al. (2020) employed the Driscoll-Kraay panel regression to explore the link between TO, GDP, energy consumption, natural resources, and EF in the context of ASEAN countries. Their outcomes revealed that TO and natural resources negatively drive EF, while GDP and the square of GDP positively impact EF. Likewise, Muhammad et al. (2020) applied the augmented mean group approach to discover the impact of financial development, non-renewable energy consumption, and TO on EF in the 20 highest emitting economies from 1995 to 2017. Their findings do not verify the environmental Kuznets curve (EKC) hypothesis but indicate that the tourism sector helps decrease EF, and both financial development and energy consumption stimulate environmental problems by increasing EF. More precisely, a 1% increase in tourism arrivals leads to a 0.059% decrease in EF.
Similarly, Khan and Hou (2020) suggested that the governments in 38 IEA countries should diversify their tourism industry when they found the critical role of TO in reducing environmental degradation. The same conclusion was confirmed by the study of Akadiri et al. (2018), who reported that a 1% increase in tourism arrivals led to a 0.144% decrease in carbon dioxide emissions in 15 selected tourism destination states. Recently, by adopting the EKC framework, Liu et al. (2022) inspected the role of TO and the squared term of TO in the pollution level. Their outcomes from the autoregressive distributed lag (ARDL) approach and the Toda-Yamamoto procedure documented an inverted U-shape association between TO and EF. In contrast, energy consumption and trade openness are at the cost of EF in Pakistan.
Some possible explanations are given to explain the beneficial effect of TO on EF. First, most international arrivals are from high-income classes and high education levels, so they are self-aware of the benefits of environmental protection (Brida et al., 2014). Second, travel enterprises and tour guides usually provide full information about polluting behaviors that are not encouraged at destinations. This action helps improve environmental quality by decreasing water contamination, plastic waste, and air pollution (Gössling et al., 2002). Third, a lot of high-technology equipment for bathrooms, kitchens, and transportation (e.g., electricity cars) will be invested to meet the requirements of tourists. The effectiveness of equipment contributes to environmental quality by reducing carbon dioxide emissions, or greenhouse gas emissions (Lenzen et al., 2018). Fourth, tourism growth boosts cultural and social advancement, generates jobs, and fosters socio-economic developments such as environmental awareness (Dogan & Aslan, 2017).
On the contrary, a large number of previous studies also found that TO may harm the environment. Gössling and Peeters (2015) reported that tourism is responsible for 5% of global pollution (mainly carbon dioxide and water emissions). The main reason is that several tourism activities, such as transportation, accommodation, and food product, are based on energy consumption and natural exploitation, thereby stimulating environmental problems. Application to Turkey, Godil et al. (2020) utilized the quantile ARDL approach to inspect how TO is associated with EF during 1986 to 2018. Their results revealed that TO is strongly associated with EF at low and high quantiles, and the more tourism this country develops, the more serious the EF is. In the same vein, Koçak et al. (2020) argued that the tourism sector is a vulnerable industry, so they applied two novel estimators (the continuously updated fully modified [CUP-FM] and the continuously updated bias-corrected [CUP-BC]) to discover the interaction between tourism arrivals, tourism receipts, and environmental quality in 10 most visited countries from 1995 to 2014. Their outcomes showed a possible connectedness and causality relationship between TO and carbon dioxide emissions in the long run. More interestingly, their results also indicated that tourism arrivals positively affect CO2 emissions, while tourism receipts contribute to improving environmental quality.
Similarly, despite the effectiveness of environmental regulations in OECD countries, the result of Dogan et al. (2017) showed that an increase in energy consumption and tourism contributes to increased gas emissions, while an expanded trade openness supports environmental quality improvements in this community. More precisely, an 1% increase in tourism arrivals leads to a 0.03% increase in carbon dioxide emissions. They suggest that policy-makers in OECD nations should encourage the use of cleaner technologies in the tourism sector, and regulate policies to trigger trade activities. Interestingly, Paramati et al. (2017) noted that the impact of TO on environmental quality might be inconsistent in different regions and countries. Accordingly, Paramati et al. (2017) found that TO improves environmental quality in the Eastern regions while negatively driving this issue in the Western European Union. The same conclusion was verified by Azam et al. (2018), who report that TO increases environmental degradation in Malaysia while declining environmental deterioration in Thailand and Singapore.
The Relationship Between Economic Growth, Globalization, and Ecological Footprint
Similar to tourism development, previous studies have failed to provide a consistent answer about the influence of GDP on environmental degradation. A possible explanation is that the impact of GDP on the environment depends on each country or area’s macroeconomic policies (e.g., government effectiveness, the stringer of environmental regulations). A large number of empirical studies and economists agree that GDP positively drives environmental problems (Ahmed, Zafar, et al., 2020; Alola et al., 2019; Birnintsaba et al., 2021; Nathaniel et al., 2020; Nathaniel & Khan, 2020), while a few works find a negative impact (Hassan et al., 2019; Usman et al., 2020) or even insignificant (Baz et al., 2020). More specifically, Ahmed, Zafar, et al. (2020) employed the CUP-FM and the CUP-BC approaches to determine factors of environmental degradation in G7 countries. Their results showed that GDP, energy consumption, and urbanization are key factors in reducing environmental quality, whether environmental degradation is measured by EF or CO2 emissions. Likewise, Munir et al. (2020) adopt the EKC framework to re-visit the interaction between GDP, energy consumption, and CO2 emissions in the presence of cross-sectional dependence in ASEAN-5 countries. Their outcomes support the EKC hypothesis and reveal that GDP contributes to environmental degradation in these countries. Similarly, using EF indicator proxies for environmental quality, Dogan et al. (2020) discovered the link between GDP and environmental degradation in BRICST (Brazil, Russia, India, China, South Africa, and Turkey) countries. Their result does not support the EKC hypothesis but reveals that both squared terms of GDP and energy intensity are important determinants of environmental degradation. Analyzing MENA countries, the study by Nathaniel et al. (2020) and Destek and Sinha (2020) also provide the same conclusion.
However, some studies provide the opposite findings. Accordingly, Usman et al. (2020) re-examine the relationship between GDP and EF in 33 upper-middle-income countries from 1994 to 2017. The results indicated that GDP contributes to reducing EF in Africa and Europe, thereby improving environmental quality. Sharma et al. (2021) found that N-shaped in the linkage between GDP and EF in eight ASEAN countries, which implies that GDP reduces EF in some stages in the development of a country. Likewise, Destek and Sarkodie (2019) believe GDP plays a vital role in climate change and sustainability. Therefore, they applied the augmented mean group estimator to investigate how GDP and financial development are associated with EF in 11 newly industrialized countries. Their empirical results confirmed that GDP has a positive effect on EF in the whole sample. However, this conclusion is not valid in the context of Turkey and South Korea, where an increase in GDP leads to a decrease in EF. Surprisingly, the study of Baz et al. (2020) presented a neutral effect between GDP and EF. With unclear or mixed conclusions from previous studies, it is necessary to re-establish the relationship between GDP and EF in new contexts (e.g., RCEP countries) to provide a comprehensive understanding and promote effective macroeconomic policies.
Regarding the impact of globalization on EF, Sabir and Gorus (2019) investigated the effect of GLOB on environmental degradation during 1975 to 2017 among South Asian countries. The findings confirmed the positive impact of GLOB on EF. Similarly, Destek (2020) observed the impact of globalization among Central and Eastern European Countries (CEECs) from 1995 to 2015. The obtained outcome showed that GLOB increases EF in these countries. In the same vein, Kassouri and Altintas (2020) inspected the link between GLOB and EF in 13 MENA countries from 1990 to 2016. They conclude that GLOB has a positive effect on EF. Likewise, Langnel and Amegavi (2020) examined how GLOB drives human demands on ecological resources. Their results suggest that GLOB promotes EF in Ghana from 1971 to 2016.
The role of GLOB in promoting environmental quality is also confirmed in previous studies. Bilgili et al. (2019) focus on how environmental sustainability reacted to GLOB in Turkey during 1970 to 2014. The Markow switching model is used in their study, and the results show that an increase in GLOB reduces pollution (i.e., EF). Likewise, Ansari et al. (2021) reported that GLOB improves environmental quality and decreases EF in top renewable energy economies. Saud et al. (2020) investigated the link between GLOB on the EF for one-belt-one-road initiative countries from 1990 to 2014. The results from the PMG approach showed that GLOB mitigates the EF and does not hurt the environment.
Notably, Sharif et al. (2019) investigated the critical link between GLOB and EF in 15 globalized countries from 1970 to 2016 and documented that GLOB and EF are not the same among these countries. More specifically, the impact of GLOB on EF is positive in Belgium, the Netherlands, Sweden, Switzerland, Denmark, Norway, Canada, and Portugal, while it is negative in France, Germany, the UK, and Hungary. More interestingly, no relation between TO and EF in Malaysia and Turkey was confirmed by the study of Ahmed et al. (2019) and Gössling and Peeters (2015). Recently, Ahmed et al. (2021) applied the linear and non-linear ARDL model to investigate the impact of GLOB on EF. Their result showed that GLOB positively impacts EF in the short term. However, the long-term results revealed that both positive and negative changes in GLOB negatively affect EF.
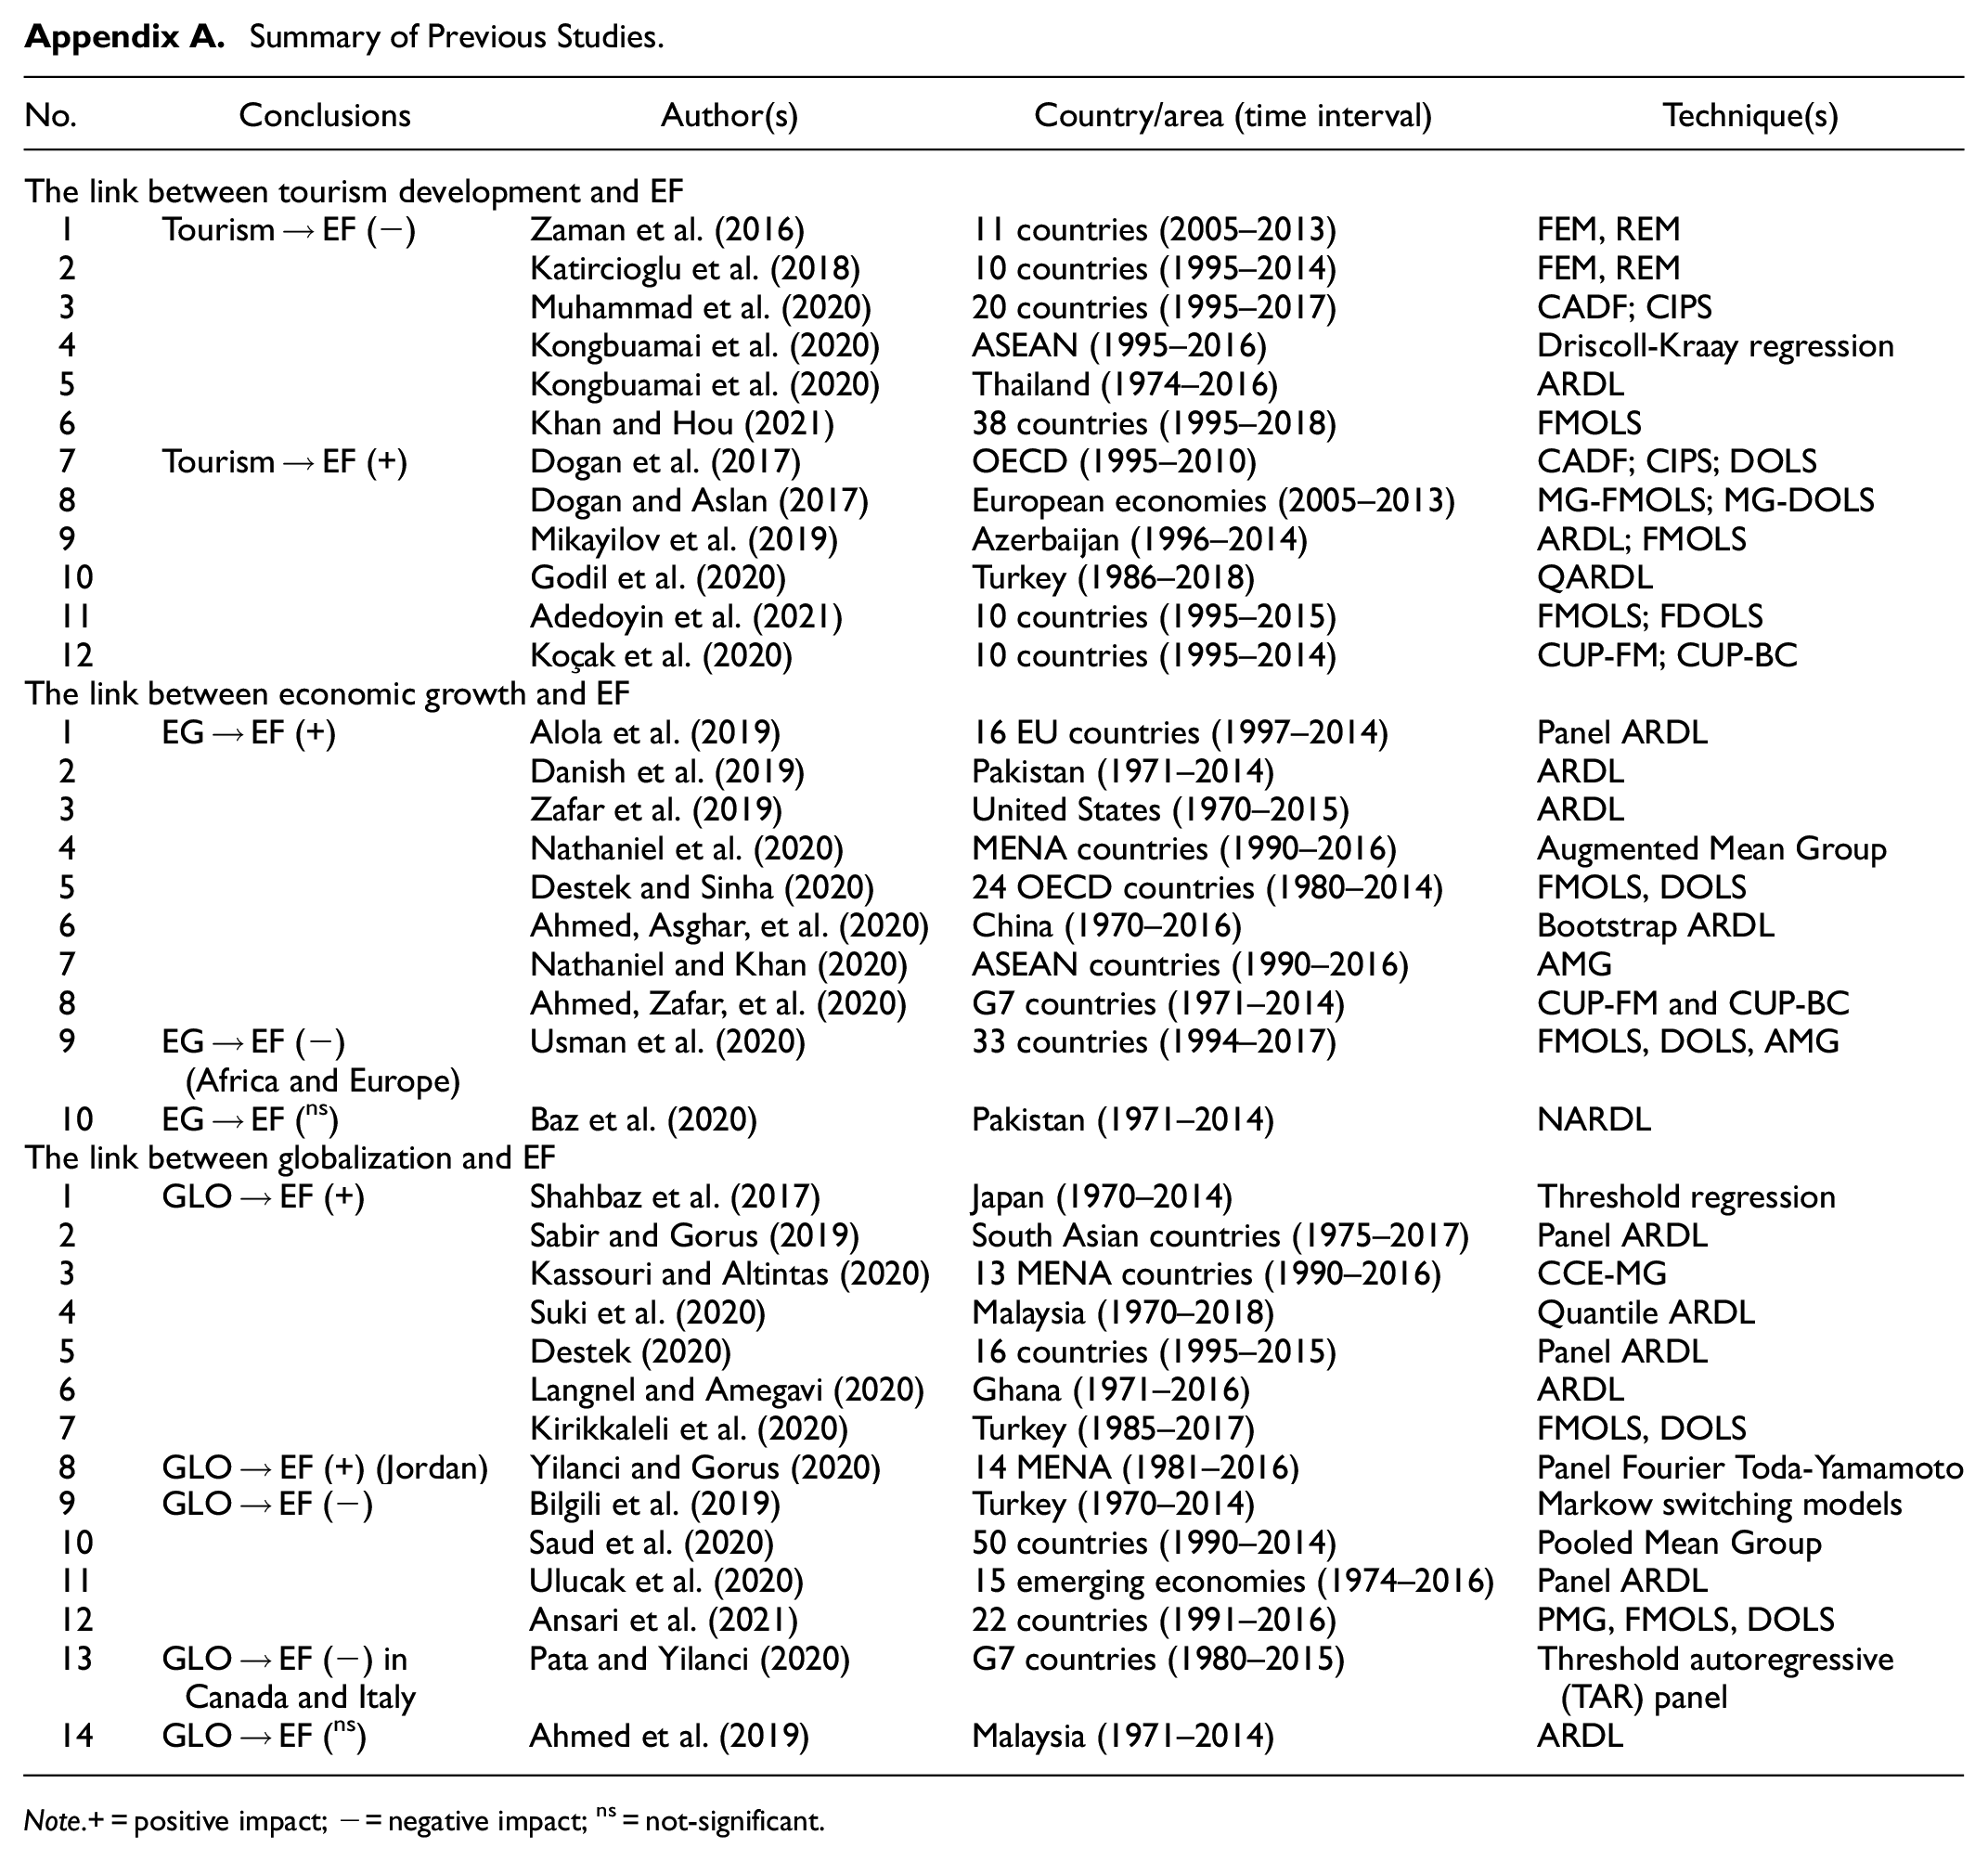
Of course, the above-mentioned review and Appendix could not represent all existing studies. However, this review also shows that TO, GDP, and GLOB mutually influence each other and affect the environment (Danish & Wang, 2019; Sun, 2018; Yu et al., 2019). Thus, this study strongly believes that scholars and policy-makers cannot fully understand how to foster sustainable development from the perspective of EF without considering three variables: TO, GDP, and GLOB. Therefore, we try to answer the following questions: (1) Are EF, TO, GDP, and GLOB indicators directly associated? (2) Is the impact of TO on EF symmetrical or asymmetrical? Is this relationship primarily a long-term or short-term nexus? To accomplish this, the study applies the panel non-linear ARDL approach to evaluate the asymmetric effects of TO on EF, incorporating GDP and GLOB as control variables to foster a more comprehensive picture of the relationship between critical macroeconomic variables and EF in RCEP countries. The study believes that the empirical results provide a more comprehensive picture of the current situation regarding tourism development and environmental quality and could be significant for planning sustainable tourism development policies among RCEP members.
Data and Methodology
Data
We use annual data from the World Tourism Organization, World Bank, and the Swiss Economic Institute from 1995 to 2016. The tourism development database (unit: total international visitor arrivals per year) was taken from the World Tourism Organization. The database of international visitor arrivals of Brunei is missing from 1995 to 2003, and New Zealand is missing from 1995 to 1997. The real GDP per capita (unit: U.S dollar/year) was collected from the database of the World Bank, while the globalization variable (unit: point) was obtained from the Swiss Economic Institute. The globalization index is a composite index that measures globalization along the economic, social, and political dimensions for every country, which uses a scale of 1 to 100, where one is the least globalized economy, and 100 is the most globalized.
The ecological footprint (unit: gha per capita) was collected from the Global Footprint Network. To smooth data, two variables (GDP per capita and tourism development) were transformed into the natural logarithm. The descriptive statistic is shown in Table 1.
Descriptive Statistics

Table 1 shows that the mean EF of 15 RCEP nations is 3.208, which is higher than the global average of 2.8 gha per capita, and the maximum value reaches 9.191 gha per capita. Likewise, the mean of the lnTO variable is 15.188, and the minimum value is 11.00, while the maximum value of the Global variable is 85.51%, and the minimum value is 22.59%.
Research Model and Econometric Strategy
Research model
The study aims to investigate the impacts of TO, GDP, and GLOB on EF in RCEP nations, so the initial model is suggested as:
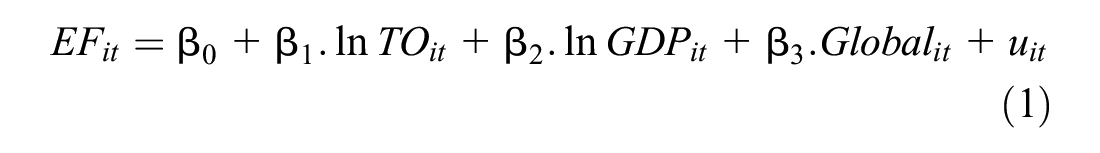
Clearly, Equation 1 is conducted in a linear framework. However, Shin et al. (2014) noted that if the relationship between variables is asymmetric, the implications based on linear models can be unreliable. Thus, the following paragraph presents an econometric strategy to explore the impact of TO, GDP, and GLOB on EF in a non-linear framework.
Econometric strategy
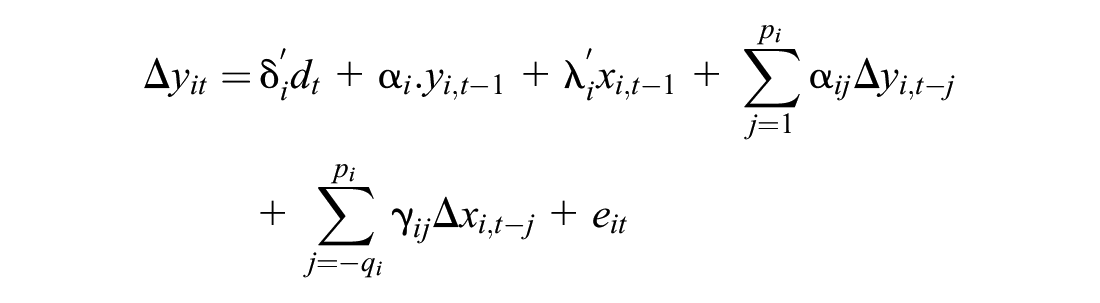
Equation 1 can be rewritten under the panel linear ARDL(p, q) model, as detailed:

where, Yit is the dependent variable, Xit is (k × 1) vector of independent variables, μ i represents the fixed effect, λ ij is the coefficient of the lagged dependent variable, δ ij is (k × 1) coefficient vector of explanatory variables, ε it is the error term, p and q is the lag operator of the dependent variable, and independent variables, respectively. i(1, 2, … 15) is country, including: Brunei, Cambodia, Indonesia, Lao PDR, Malaysia, Myanmar, Philippines, Singapore, South Korea, Thailand, Vietnam, Australia, Japan, New Zealand, and mainland of China, respectively. t is the time (from 1995 to 2016).
However, this work aims to investigate a potential asymmetric impact of TO on EF. Thus, the paper employs the panel NARDL approach developed by Shin et al. (2014). It is a novel technique that uses positive and negative partial sum decomposition to detect asymmetric effects in both the short- and long-run (Shin et al., 2014). To consider the asymmetric effect of an independent variable (e.g., X variable), we separate the X variable into two components: positive and negative changes at the suggestion of Shin et al. (2014). The long-run association between Y and X variables in the asymmetric ARDL approach is defined as:

where,

where X0 is the minimum value of X variable,

We put

where,
The analysis of this study is implemented through four steps. Step one, the study identifies the long-run relationship cointegration between examined variables by three tests introduced by Kao (1999); Pedroni (1999); and Westerlund (2005). Step two determines the long- and short-run coefficients by the AECM model. In step three, the Wald test was used to examine the potential asymmetric effect of X on Y, with the short-run symmetry is tested by the null hypothesis:
The long-run symmetry is tested by the null hypothesis

where, Φ i is the slope-intercept; φ i and γ i are the slope coefficient; ε is the error term, while k is the number of lag lengths. The null hypothesis is stated that the X variable does not Granger-cause on the Y variable. If the null hypothesis is rejected, implying there is a uni-directional causality running from X to Y.
Empirical Results and Discussion
Panel Unit Root Test
The panel non-linear ARDL approach is not valid in the presence of order two I(2) (Pesaran et al., 2001). Hence, the study has used the three commonly panel unit root tests, including the LLC test (Levin et al., 2002), Breitung test (Breitung, 2002), and IPS test (Im et al., 2003), to check the stationarity of all variables. The obtained outcomes in Table 2 show that the EF and lnTO variables are stationary at the first difference I(1), while both the lnGDP and Global variables are stationary at the level I(0). No variables are integrated of second order I(2), which means the condition to apply the panel non-linear ARDL approach is satisfied (Pesaran et al., 2001).
Panel Unit Root Test.
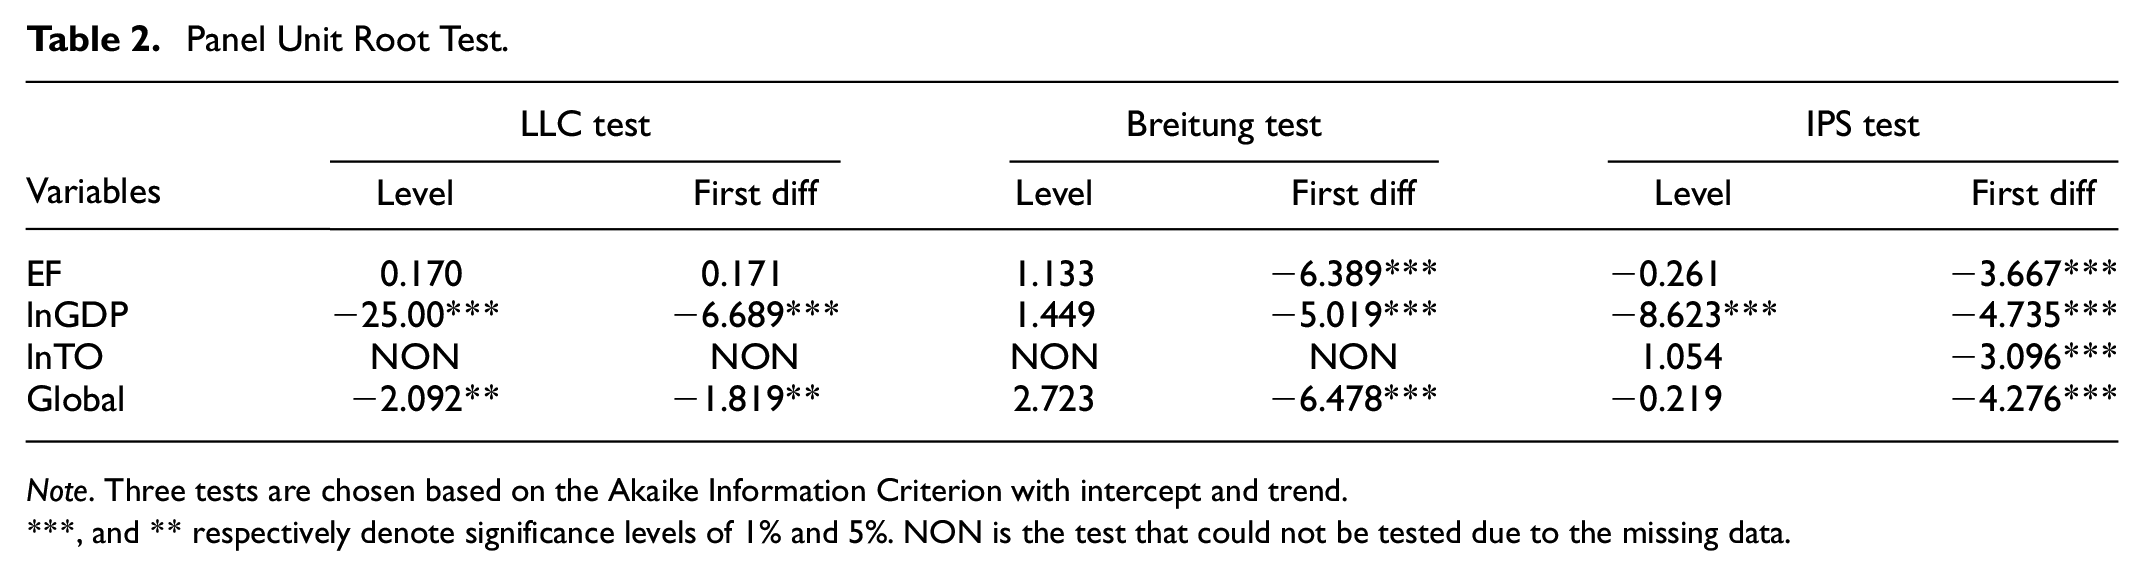
Note. Three tests are chosen based on the Akaike Information Criterion with intercept and trend.
, and ** respectively denote significance levels of 1% and 5%. NON is the test that could not be tested due to the missing data.
According to Pesaran (2020), two severe issues of panel data are the presence of cross-sectional dependence and slope heterogeneity, which could affect the consistency of panel estimators. The cross-sectional dependence test (CD test) and slope heterogeneity test (HS test) were employed to robust the results in Table 2. Accordingly, Table 3 reveals that both the value of Δ and Δadj is significant. It is evident to reject the null hypothesis, which means Equation 1 suffer from the slope heterogeneity problem (Pesaran & Yamagata, 2008). In addition, the value of the CD test also provides that only the lnGDP variable is cross-sectionally dependent. These results confirm that the results in Table 2 are valid.
Slope Heterogeneity and Cross-Sectional Dependence Test Results.

Note. ***Represents the significant level of 1%.
Nevertheless, Zivot and Andrews (2002), Karavias and Tzavalis (2014) noted that ignoring the structural break in panel data might provide unreliable estimates. The novel test proposed by Karavias and Tzavalis (2014) was employed to address this issue, which could differentiate between breaks and unit-roots. Table 4 revealed that all null hypothesis is accepted (p-value >.05). This evidence allows us to conclude that there is no structural break in RCEP’s data.
Results of Structural Break Test.
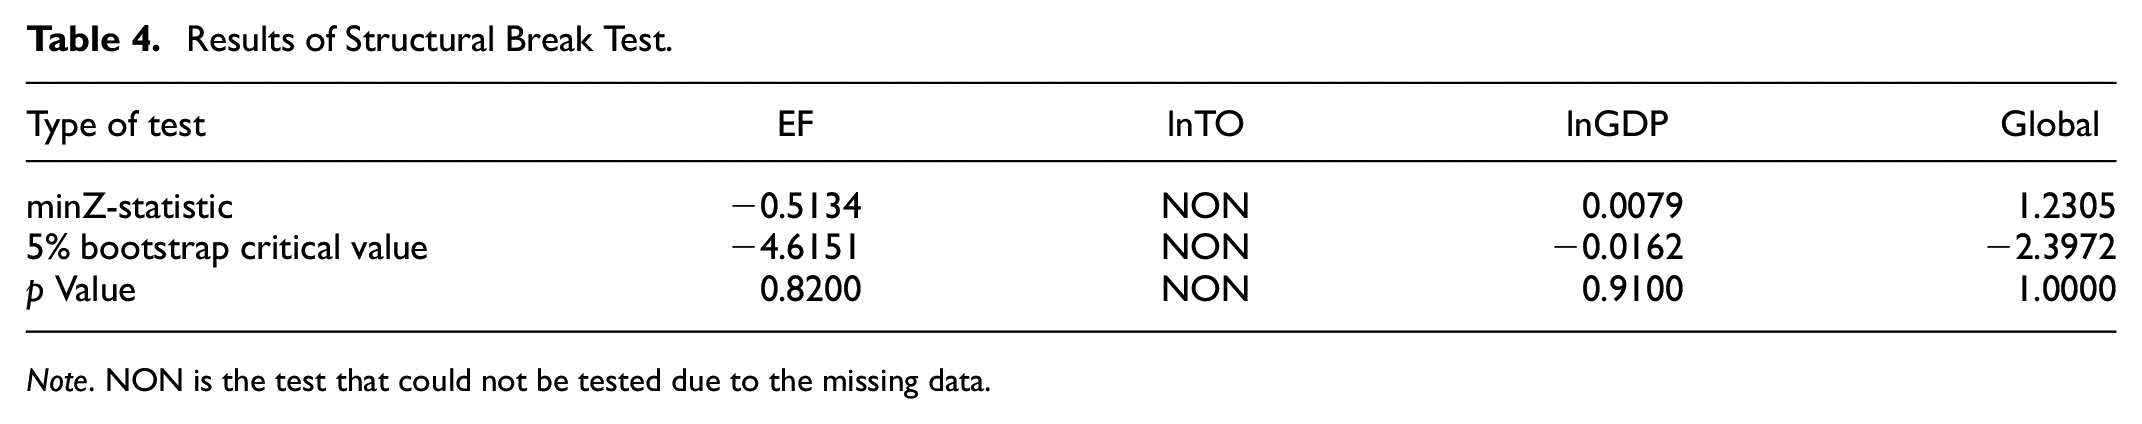
Note. NON is the test that could not be tested due to the missing data.
Panel cointegration test
In the literature, there are several different panel cointegration tests. Hence, the study applies three tests of panel cointegration introduced by Kao (1999) and Pedroni (1999, 2004), and Westerlund (2005). The Westerlund test is based on the following ECM model:
where,
Panel Cointegration Test Results.
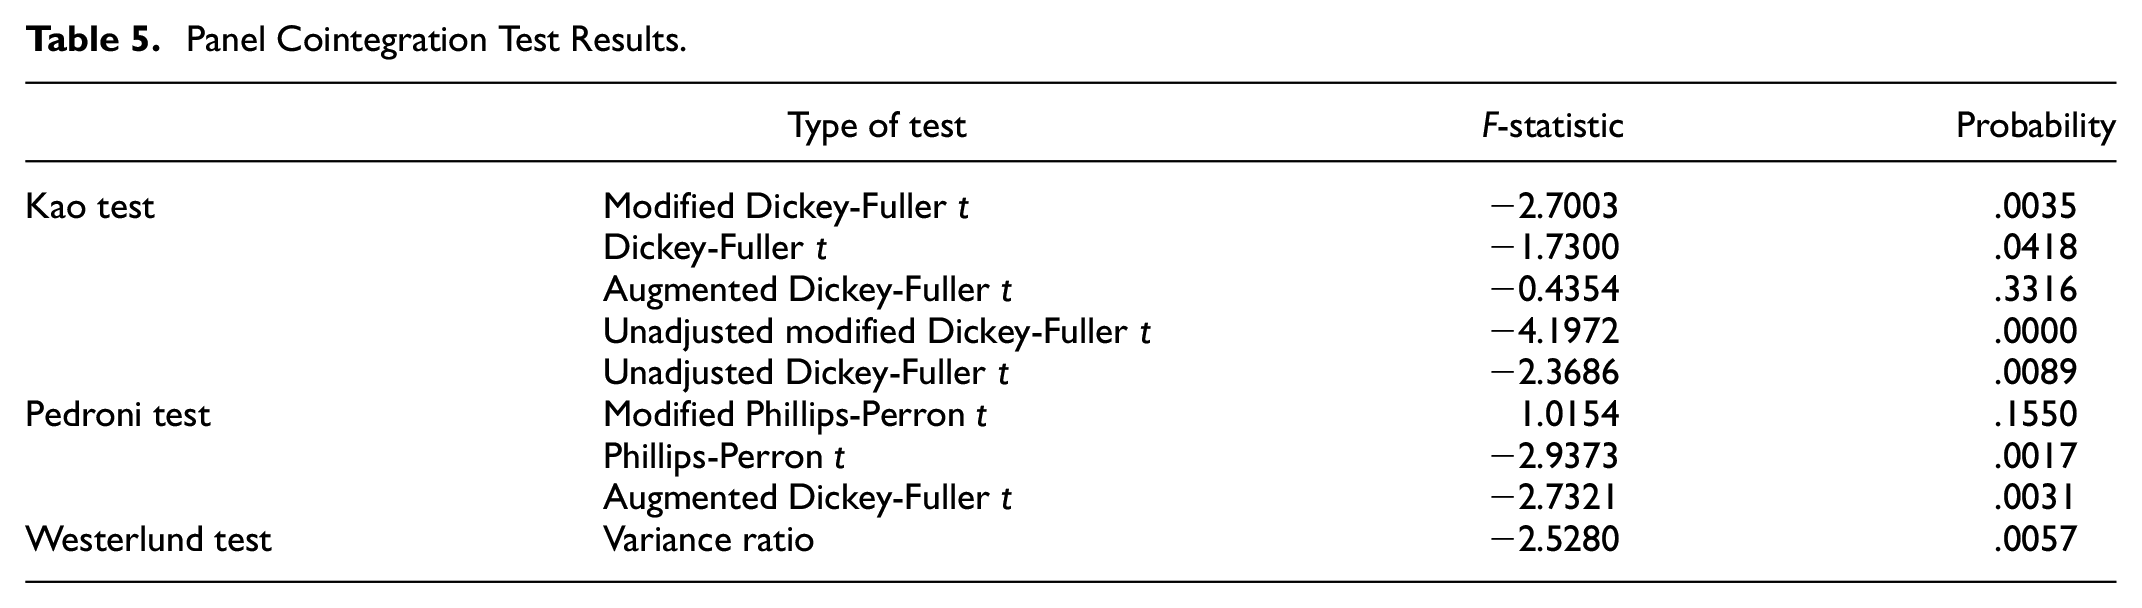
The results in Table 5 reveal that four per five types of Kao test and two per three types of Pedroni test have a p-value of less than .05. So, the study can conclude the existence of a long-run relationship cointegration between all variables in the proposed model. The Westerlund test confirms this conclusion, and thus the work can proceed with the AECM estimation.
Empirical Results by Asymmetric Error Correction Model
This study aims to investigate an asymmetric effect of tourist development on EF in 15 RCEP countries. Besides, the work also incorporates economic growth and globalization as control variables to provide a more comprehensive picture of this impact. So, our proposed model can be specified as the AECM model:

where, p, q, s, z is the lag order of EF, lnTO, lnGDP, Global variables, respectively. The source and unit of variables are presented in Section 3. In order to verify a potential asymmetric effect of TO on EF, the study employed the AECM estimator and the Wald test. The empirical results are presented in Table 6.
The Panel Non-Linear ARDL Estimation Outcomes.

Note. The superscripts “+,” and “−,” presents the cumulative function of positive and negative changes.
The estimated results presented in Table 6 provide an unraveled impact of TO on EF. Accordingly, the ECT(−1) parameter is −0.1601 (p-value = .04), implying that the EF variable can re-adjust to the long-run equilibrium point. The coefficient of lnGDP variable is 1.1708 (p-value = .000), and ΔlnGDP is 1.3311 (p-value = .001), which reveals that the impact of GDP on EF is positive in the short- and long-run. There is a surprising result in the impact of GLOB on EF when the empirical outcome indicates a positive impact in the short run but a negative impact in the long run.
However, the main goal of this study is to investigate the potential asymmetric effect of TO on EF in RCEP. The obtained outcomes show that the partial positive changes sum of TO has a significant and negative effect on the EF (lnTO+ = −0.6210, p-value = .001), while partial negative changes to the sum of TO have a significant and negative impact on the EF (lnTO− = −0.6635, p-value = .000). The Wald test’s long-run symmetric test provides evidence to reject the null hypothesis (WLR = 18.14, p-value = .000). Therefore, the study may conclude that a 1% increase in TO leads to 0.6210 gha per capita decrease in EF. Similarly, a 1% decrease in TO leads to 0.6635 gha per capita increase in EF. In the NARDL approach, the explanation of the effect of negative changes is the opposite of the OLS approach (Shin et al., 2014). Hence, our empirical outcome reveals that the greater effect is sourced from the negative changes.
Likewise, the coefficient of ΔlnTO+ variable is 0.2184, and ΔlnTO− variable is 0.2227. Nevertheless, these coefficients are not significant, while the short-run asymmetric test by Wald test has also provided evidence to accept the null hypothesis, implying the impact of TO on EF in the short run is unclear. Combined with the long-run effect, the study concludes that the impact of tourist development on EF is symmetry in the short run and asymmetry in the long run.
Causality test
Table 3 shows that Equation 1 suffers from the slope heterogeneity problem. Therefore, the study employed the Dumitrescu-Hurlin test to overcome this issue. The causality test result is shown in Table 7 and Figure 1.
Results of the Causality Test.

Is the test without Brunei and New Zealand because the database of tourism development of two countries is missing.

Plots of the causality test.
The results in Table 7 show uni-directional causality running from TO and GLOB to EF, while there is bi-directional causality between EF and GDP; GDP and GLOB; GDP and TO; TO and GLOB. An in-depth discussion of these findings is presented in the next paragraph.
Discussion
The empirical results demonstrate that TO does not exert a significant impact on EF in the short run. However, TO significantly influences EF in the long run. More specifically, this study finds that positive changes in TO have a negative impact, while negative changes positively drive EF in the long run in RCEP countries. The findings suggest that the more developed the tourism industry is in RCEP countries, the better biocapacity provides. The finding is in line with Kongbuamai et al. (2020), who revealed that TO and natural resources negatively drive EF in ASEAN countries. This finding is supported by the study of Khan and Hou (2021), Katircioglu et al. (2018), and Usman et al. (2020). Some possible explanations are that RCEP countries have completed infrastructure for the tourism industry (Nathaniel & Khan, 2020), have strict environmental regulations (Ahmed et al., 2021), and have a high human capital (Khoi et al., 2021). However, the finding is inconsistent with the conclusion of Dogan et al. (2017) on OECD countries, and Adedoyin et al. (2021) on the top 10 earners of international tourism. Despite this difference, the study may enrich the literature because the asymmetric effects of TO on EF have been largely ignored in previous studies, especially in the context of RCEP economic community. More specifically, the asymmetric effect suggests that an increase in tourism activities leads to a decrease in EF while a decrease leads to an increase in EF in the long term. This conclusion is confirmed by causality test, which provided evidence that there is only uni-directional causality running from TO to EF. The proposed policies will be discussed in more detail in the section of policy implications.
The findings reveal that GDP fosters EF both short and long-term. The results are consistent with many previous studies, such as Alola et al. (2019), Nathaniel and Adedoyin (2022), and Ansari et al. (2022). This study also finds it interesting that globalization tends to increase EF in the short run while decreasing EF in the long run. The findings suggest that in the long run, GLOB would bring benefits for every member of RCEP. The results are in line with some recent studies in different contexts such as one-belt-one-road initiative countries (Saud et al., 2020), emerging economies (Ulucak et al., 2020), top renewable energy economies (Ansari et al., 2021) while demonstrating the inconsistency with some studies in other contexts, including South Asian countries (Sabir & Gorus, 2019), 13 MENA countries (Kassouri & Altintas, 2020), Central and Eastern European Countries (Destek, 2020). The results also imply that countries and areas which can utilize benefits from globalization, such as innovation and green technologies, renewable energy, the openness of economic activities, financial development, international collaboration, and human development, can facilitate improved environmental quality (Motoshita et al., 2015; Saud et al., 2020; Tamazian & Bhaskara Rao, 2010; Ulucak et al., 2020).
Conclusion and Policy Implications
Conclusions
In summary, the current study has some significant contributions as follows: Firstly, this study discovers that in the long run, tourism development has a negative influence on EF. In other words, tourism development improves environmental quality in RCEP countries. Furthermore, this impact is asymmetry. More specifically, our empirical outcome reveals that the greater effect results from negative changes. Besides, while globalization increases EF in the short run, it benefits RCEP countries in the long run by decreasing EF. The findings suggest that a deeper and broader level of globalization policies should be adopted among RCEP countries. Finally, we found that economic growth increases EF both short- and long-term. The results imply that RCEP countries should develop more effective policies to promote sustainable economic development from the economic perspective.
Policy Implications
Based on the empirical results, the present study proposes some policy implications which facilitate the tourism development of members of RCEP countries. Regarding the role of TO toward EF, the study found that TO is an effective policy for boosting GDP, alleviating poverty, and reducing environmental degradation. As the number of international visitors measures tourism development, the results are explainable since the development of tourism in RCEP countries creates more income to promote R&D activities, and eventually generates more technological innovations as well as more efficient transportation by utilizing less energy-consuming technology (Gokmenoglu & Eren, 2019; Kongbuamai et al., 2020; Zhang & Gao, 2016). Also, tourism development creates cultural and social advancement, and fosters environmental awareness (Adedoyin et al., 2021; Muhammad et al., 2020). We suggest that RCEP countries should develop policies to increase international tourists while fostering sustainable tourism development (Dogan & Aslan, 2017). This way, RCEP countries can balance the benefits resulting from the tourism industry and improve environmental quality. To achieve this, we propose that these countries should adopt green tourism practices such as green hotels, green restaurants, green transportation, and green destinations (Cotterell et al., 2019; Danish & Wang, 2019; Kongbuamai et al., 2020) among tourism stakeholders, including service providers and tourists. Moreover, alternative tourism, such as eco-tourism or community-based tourism, should be extended, in which tourism activities are integrated with local cultural and natural resources (Collins & Cooper, 2016). Previous studies have stressed that environmental concerns and awareness are important factors in generating a sustainable tourism industry (Cotterell et al., 2019; Danish & Wang, 2019; Kongbuamai et al., 2020). Thus, RCEP countries should invest more in human capital and environmental protection for local people.
To limit the negative impact of GDP on EF, RCEP’s policy-makers should enforce the regulatory standards regarding environmental standards, in which renewable energy technologies such as wind, solar, and geothermal power should be promoted. These policies should include higher environmental taxes on industries with high-level pollution and subsidies for removing non-renewable energy usage for industries and households. Furthermore, the policies that foster the generation of green jobs and cleaner products should also be promoted. To achieve that, the role of the policies that encourage R&D activities to generate innovative technologies is utterly important since cleaner products, green energy, and innovative technologies are considered pillars for sustainable development.
The current policies of RCEP countries regarding GLOB seem to be effective in balancing development (e.g., economic, social, and political) and environmental quality. This is evident by the results that GLOB decreases EF in the long term. Thus, RCEP countries should continue developing and improving current globalization policies to meet the world economy’s rapid changes. Moreover, RCEP countries should develop international agreements and contracts relating to the environment and climate change between them and their partners (Shahbaz et al., 2017). Some key issues such as innovation and green technologies, renewable energy, international collaboration, and human development should be considered carefully (Motoshita et al., 2015; Saud et al., 2020; Tamazian & Bhaskara Rao, 2010; Ulucak et al., 2020).
Finally, even though significant empirical evidence is acknowledged in this study, we agree that it still has some limits. In general, many macroeconomic variables can affect environmental degradation in RCEP countries. In addition, some related economic variables should be further considered, such as foreign direct investment, institutional quality, non-renewable energy consumption, and the effectiveness of environmental regulations. We also suggest that several novel econometric techniques, such as spatial regression, and wavelet analysis, should be applied to support policy-makers with a comprehensive policy guideline.
Footnotes
Appendix
Summary of Previous Studies.
| No. | Conclusions | Author(s) | Country/area (time interval) | Technique(s) |
|---|---|---|---|---|
| The link between tourism development and EF | ||||
| 1 | Tourism → EF (−) | Zaman et al. (2016) | 11 countries (2005–2013) | FEM, REM |
| 2 | Katircioglu et al. (2018) | 10 countries (1995–2014) | FEM, REM | |
| 3 | Muhammad et al. (2020) | 20 countries (1995–2017) | CADF; CIPS | |
| 4 | Kongbuamai et al. (2020) | ASEAN (1995–2016) | Driscoll-Kraay regression | |
| 5 | Kongbuamai et al. (2020) | Thailand (1974–2016) | ARDL | |
| 6 | Khan and Hou (2021) | 38 countries (1995–2018) | FMOLS | |
| 7 | Tourism → EF (+) | Dogan et al. (2017) | OECD (1995–2010) | CADF; CIPS; DOLS |
| 8 | Dogan and Aslan (2017) | European economies (2005–2013) | MG-FMOLS; MG-DOLS | |
| 9 | Mikayilov et al. (2019) | Azerbaijan (1996–2014) | ARDL; FMOLS | |
| 10 | Godil et al. (2020) | Turkey (1986–2018) | QARDL | |
| 11 | Adedoyin et al. (2021) | 10 countries (1995–2015) | FMOLS; FDOLS | |
| 12 | Koçak et al. (2020) | 10 countries (1995–2014) | CUP-FM; CUP-BC | |
| The link between economic growth and EF | ||||
| 1 | EG → EF (+) | Alola et al. (2019) | 16 EU countries (1997–2014) | Panel ARDL |
| 2 | Danish et al. (2019) | Pakistan (1971–2014) | ARDL | |
| 3 | Zafar et al. (2019) | United States (1970–2015) | ARDL | |
| 4 | Nathaniel et al. (2020) | MENA countries (1990–2016) | Augmented Mean Group | |
| 5 | Destek and Sinha (2020) | 24 OECD countries (1980–2014) | FMOLS, DOLS | |
| 6 | Ahmed, Asghar, et al. (2020) | China (1970–2016) | Bootstrap ARDL | |
| 7 | Nathaniel and Khan (2020) | ASEAN countries (1990–2016) | AMG | |
| 8 | Ahmed, Zafar, et al. (2020) | G7 countries (1971–2014) | CUP-FM and CUP-BC | |
| 9 | EG → EF (−) (Africa and Europe) | Usman et al. (2020) | 33 countries (1994–2017) | FMOLS, DOLS, AMG |
| 10 | EG → EF (ns) | Baz et al. (2020) | Pakistan (1971–2014) | NARDL |
| The link between globalization and EF | ||||
| 1 | GLO → EF (+) | Shahbaz et al. (2017) | Japan (1970–2014) | Threshold regression |
| 2 | Sabir and Gorus (2019) | South Asian countries (1975–2017) | Panel ARDL | |
| 3 | Kassouri and Altintas (2020) | 13 MENA countries (1990–2016) | CCE-MG | |
| 4 | Suki et al. (2020) | Malaysia (1970–2018) | Quantile ARDL | |
| 5 | Destek (2020) | 16 countries (1995–2015) | Panel ARDL | |
| 6 | Langnel and Amegavi (2020) | Ghana (1971–2016) | ARDL | |
| 7 | Kirikkaleli et al. (2020) | Turkey (1985–2017) | FMOLS, DOLS | |
| 8 | GLO → EF (+) (Jordan) | Yilanci and Gorus (2020) | 14 MENA (1981–2016) | Panel Fourier Toda-Yamamoto |
| 9 | GLO → EF (−) | Bilgili et al. (2019) | Turkey (1970–2014) | Markow switching models |
| 10 | Saud et al. (2020) | 50 countries (1990–2014) | Pooled Mean Group | |
| 11 | Ulucak et al. (2020) | 15 emerging economies (1974–2016) | Panel ARDL | |
| 12 | Ansari et al. (2021) | 22 countries (1991–2016) | PMG, FMOLS, DOLS | |
| 13 | GLO → EF (−) in Canada and Italy | Pata and Yilanci (2020) | G7 countries (1980–2015) | Threshold autoregressive (TAR) panel |
| 14 | GLO → EF (ns) | Ahmed et al. (2019) | Malaysia (1971–2014) | ARDL |
Note.+ = positive impact; − = negative impact; ns = not-significant.
Acknowledgements
We would like to thank the Editor-in-chief and anonymous reviewers for helpful comments and suggestions.
Availability of Data and Materials
The data presented in this study are openly available at: https://www.unwto.org/tourism-statistics-data; and https://data.worldbank.org/indicator/NY.GDP.PCAP.CD; and ![]()
Declaration of Conflicting Interests
The author declared no potential conflicts of interest with respect to the research, authorship, and/or publication of this article.
Funding
The author received no financial support for the research, authorship, and/or publication of this article.