
Abstract
This comprehensive study investigates the intricate relationships among three pivotal components: green finance, corruption control, and ecological footprint, with the primary objective of revealing the synergies shaping sustainable development. The research examines how environmentally aligned financial practices, effective anti-corruption measures, and responsible resource management collectively influence the ecological footprint within the top 10 developed economies, offering insights into strategies for fostering sustainable growth. Ecological footprint (EFT) data was obtained from the Global Footprint Network, while green finance (GFIN) data was sourced from the Asian Development Bank. The panel data used in the study spanned 18 years from 2000 to 2018 for the 10 selected countries. To address issues of endogeneity and unobserved heterogeneity, the system generalized method of moments (GMM) was employed for hypothesis testing. By employing advanced modeling techniques, particularly the system generalized method of moments, the study verifies the positive impact of green finance in reducing the ecological footprint and carbon emissions, providing actionable insights for policymakers and practitioners in the OECD. Formulating two hypotheses, it assesses the positive relationship between green finance (GFIN) and ecological footprint (EFT) while considering control variables, and the negative relationship between GFIN and carbon emissions (CO2). Furthermore, it underscores the significance of control variables, such as control of corruption, population, GDP, and trade openness, in influencing ecological footprints and carbon emissions. These findings contribute invaluable insights for policymakers and stakeholders, guiding the path toward sustainable practices and a greener future in developed nations.
Keywords
Introduction
This study addresses the pressing need to recognize the often-overlooked significance of environmental sustainability, particularly within the context of Sustainable Development Goal 13 (SDG 13)—climate action. It undertakes a pioneering exploration of the interplay between green finance, control of corruption, and their collective influence on the ecological footprint in the top 10 developed economies, providing essential insights into the policy-level problem of understanding these dynamics. By shedding light on how green finance, GDP, population, trade openness, and control of corruption affect the ecological footprint from 2000 to 2018, this research aims to guide policies and strategies toward greater sustainability within the framework of the United Nations’ SDGs. Focusing on economies where corruption is effectively controlled, the chosen sample complements the problem by offering a unique perspective. The study’s empirical findings are expected to serve as a benchmark for developed countries, particularly within the OECD, guiding their policies and strategies toward more sustainable and environmentally responsible practices and setting a precedent for SDG implementation strategies worldwide.
Environmental degradation and climate change represent critical global challenges, demanding urgent attention from world leaders for the sake of sustainable development (IPCC, 2018; UN, 2015). The concept of green finance has gained substantial traction as an innovative strategy to combat these challenges and pave the way for sustainable recovery (Svendsen et al., 2020; Zhou et al., 2022). Notably, developed countries, particularly those within the Organization for Economic Co-operation and Development (OECD), have proactively embraced measures to address climate change and support less developed nations in achieving their sustainability objectives (OECD, 2020; Roumiani & Mofidi, 2021).
However, despite its intrinsic link to all 17 Sustainable Development Goals (SDGs) and its significance as an indicator for decarbonization and climate vulnerability metrics, the importance of environmental sustainability, particularly SDG 13—climate action, often goes unnoticed (Bojke et al., 2018; United Nations, 2020).
In response to this multifaceted challenge, this study undertakes a pioneering exploration of the top 10 developed economies featured in the Corruption Perception Index (CPI) 2018. The primary objective is to delve into the interplay between green finance, the control of corruption, and their collective influence on the ecological footprint. This investigation seeks to shed light on the dynamics of green finance, GDP, population, trade openness, and the control of corruption concerning their impact on the ecological footprint within these countries during the period spanning 2000 to 2018.
To ensure the robustness of the analysis and account for potential endogeneity and autocorrelation, the study employs the Environmental Kuznets Curve (EKC) framework, as proposed by Stern (2004), and leverages the System Generalized Method of Moments (GMM) approach, building upon the work of Arellano and Bond (1991) and Tamazian et al. (2019). It is the contention of this research that the selected countries, all of which are OECD members, play a pivotal role in shaping strategies, action plans, tools, processes, and accountability systems related to the implementation of SDGs (M. A. Destek et al., 2022; OECD, 2019).
The ecological footprint emerges as an invaluable metric for assessing environmental degradation, encapsulating the extent of human dependence on the ecological system and offering insights into environmental quality (Chan et al., 2021; Wackernagel et al., 2002). The EKC framework, underpinning the analysis, facilitates the examination of the intricate relationship between economic growth and environmental degradation, underscoring the potential negative ramifications of economic expansion on environmental quality, a phenomenon initially explored by Kuznets in 1955 (Bimonte et al., 2019).
Although prior research has delved into the impact of macroeconomic factors on the ecological footprint in both developed and developing nations (Baek et al., 2022; Rafindadi & Usman, 2020; Shahbaz et al., 2023). Yet the unique focus of this study on the top 10 countries identified in the CPI 2018, particularly in the context of SDG 13, represents an uncharted territory within the academic discourse.
This research contributes to the existing body of literature in several crucial ways. Firstly, it offers an in-depth exploration of the role of green finance in assisting sustainable economies to address the ecological footprint, a formidable obstacle on the path to achieving sustainable development goals. Secondly, it pioneers a contemporary analysis of the top 10 economies featured in the CPI 2018, where corruption has been effectively controlled, to discern its impact on the ecological footprint. Thirdly, the study underscores environmental degradation as a substantial impediment to the realization of SDG 13, an aspect frequently overlooked despite its tangible consequences.
The empirical findings of this study hold the potential to serve as a benchmark for developed countries, particularly those within the OECD, guiding their policies and strategies toward more sustainable and environmentally responsible practices (Destek et al., 2023; Wang et al., 2022).
Within the framework of the United Nations Sustainable Development Goals 2030, member countries are not merely encouraged but strongly urged to adopt green finance as a key instrument to address climate and investment risks. Green finance stands as a vital bridge connecting the world of business to environmentally conscious investments, offering a pragmatic and effective approach to mitigating environmental degradation (Z. Khan et al., 2022; Klasen et al., 2019).
Literature Review
The world economy is unwavering in its will to confront the threats that global warming poses to the ecology and the peaceful survival of humankind (Jahanger et al., 2023). Environmental issues are required to be addressed by assessing the quality of the environment, which helps to establish a climate ground effectively to address these issues (Zeraibi et al., 2023). Green finance, which encompasses investment financing for environmentally sustainable development, has garnered increasing attention in the literature (Nawaz et al., 2021). One of the critical components of green finance is climate mitigation finance, aligning with SDG 13 (Climate Action). Previous research suggests that green finance can significantly reduce fossil fuel consumption and CO2 emissions, contributing to economic growth and the preservation of natural resources (Meo & Abd Karim, 2022).
While developing countries grapple with climate change challenges, OECD countries are actively committed to addressing climate change for sustainable development (Ulucak & Ozcan, 2020). Stakeholders seeking environmental benefits are increasingly engaged in green finance, as exemplified by the Paris Agreement and its climate-friendly initiatives (M. A. Khan et al., 2022). Countries such as Sweden and Finland have substantially increased climate finance to support the Paris Agreement and have undertaken measures to control environmental spillover.
Previous studies have primarily focused on the relationship between CO2 emissions and environmental quality using the Environmental Kuznets Curve (EKC) framework (Majeed & Asghar, 2021). However, the connection between climate mitigation finance and the ecological footprint remains relatively unexplored, despite its significance. Some studies have explored the environmental impact of trade openness, energy consumption, GDP per capita, urbanization, and economic growth within the EKC framework (Yasin et al., 2020). Higher trade intensity has been associated with increased pollution emissions and energy consumption (B. Xu et al., 2021).
The relationship between economic growth and CO2 emissions follows an inverted U-shape pattern according to the EKC theory. However, CO2 emissions alone may not provide a comprehensive measure of environmental quality, as it primarily focuses on air pollution (Yasin et al., 2020). Consequently, the ecological footprint has emerged as a more inclusive measure of environmental degradation, encompassing water, soil, and air pollution. The literature has employed various econometric techniques such as error correction models (ECM), DOLS models, Granger causality, bootstrap causality tests, and vector error correction models (VECM) to analyze the determinants of the ecological footprint (Baloch et al., 2019). Nevertheless, these linear methods may fall short in capturing impulsive changes in data series.
A study conducted by M. A. Destek and Sarkodie (2019) utilized heterogeneous panel causality and AMG estimation to investigate the relationship between economic growth and the ecological footprint. Their findings revealed significant positive coefficients for Singapore and negative coefficients for Malaysia and China concerning economic growth and the ecological footprint. Another study explored the spatial correlation effect of carbon emissions in OECD countries (M. A. Destek & Sinha, 2020a). The results indicated a U-shaped association between carbon emissions and environmental regulation, with minimal influence from international trade on carbon transfer. Therefore, our study seeks to contribute by examining the impact of climate finance on curbing environmental spillover in sustainable economies using a system-GMM model.
Corruption can hinder economic efficiency and environmental quality by deterring investors and hindering resource allocation (Y. Yao et al., 2021). Countries with effective control of corruption can establish a secure judicial system, attract foreign investment, and achieve economic growth and environmental sustainability. Conversely, a corrupt environment, political instability, natural resource exploitation, and bribery undermine green financing (Yang & Khan, 2021). Although there is limited literature on corruption, energy efficiency, and the control of corruption in OECD economies and environmental sustainability (Saqib, 2022), recent studies suggest that OECD economies face significant challenges in achieving sustainable development goals and often prioritize economic growth over environmental sustainability (Shobande & Ogbeifun, 2022).
In summary, this literature review underscores the significance of green finance, the potential of climate mitigation finance, the relevance of the Paris Agreement, the necessity to explore the link between climate finance and the ecological footprint, and the influence of corruption on green finance and environmental sustainability. By investigating these critical aspects, our study aims to advance the understanding of sustainable development and provide valuable insights for policymakers and decision-makers in the realm of green finance.
Hypothesis
The study employed two models to explore the relationship between green finance, control of corruption, and their impact on ecological footprints and carbon emissions in 10 developed countries: Canada, Denmark, Finland, Germany, Japan, Netherlands, New Zealand, Norway, Sweden, and Switzerland.
In this research, the formulation of hypotheses played a pivotal role in outlining the investigation into the nexus between green finance, ecological sustainability, and the crucial influence of control of corruption in developed economies.
Hypothesis 1 (H1) posits a significant positive relationship between green finance (GFIN) and ecological footprint (EFT) within developed economies, accounting for the control variables of Gross Domestic Product (GDP), population (POP), trade openness (TO), and control of corruption (CC).
It is anticipated that the analysis will reveal a constructive association between green finance and ecological footprint, reflecting the financial sector’s commitment to ecological sustainability and its potential to enhance environmental well-being while mitigating the challenges posed by corruption.
Hypothesis 2 (H2) introduces the notion of a significant negative relationship between green finance (GFIN) and carbon emissions (CO2) in developed economies, while carefully controlling for GDP, population (POP), trade openness (TO), and control of corruption (CC).
Exploring this hypothesis, aims to uncover an inverse connection, highlighting the role of green finance in contributing to reduced carbon emissions, thereby mitigating the environmental impact. This investigation underscores the importance of adopting environmentally responsible financial practices and affirms the feasibility of using financial instruments to address environmental challenges while addressing issues of corruption control.
Methodology
The methodology involved adapting the model of green finance function from and Z. Khan et al. (2022) by replacing energy consumption with control of corruption as the explanatory variable. The study utilized two models to capture the influence of green finance on environmental quality and used the proxies as ecological footprint and carbon emissions. The first model focused on the ecological footprint as the dependent variable, while the second model served as a robustness check by using carbon emissions as the dependent variable. These models were applied to 10 developed countries: Canada, Denmark, Finland, Germany, Japan, Netherlands, New Zealand, Norway, Sweden, and Switzerland.


In the Model I, the equation analyzed the influence of green finance on ecological footprints. The measurement of green finance (GFIN) was determined by using the mitigation finance of climate in terms of billions of US dollars, with its natural log taken. The ecological footprint (EFT) was measured in global hectares per capita. Control variables such as GDP, population (POP), trade openness (TO), and control of corruption (CC) were included to avoid biases in the results. GDP was measured in US dollars, with the natural log taken. Population (POP) was expressed as the natural log of total population, and trade openness (TO) was measured as the ratio of goods trade to GDP. Control of corruption (CC) was represented by the rank of control of corruption. Data for these variables were obtained from the Worldwide Governance Indicators website and the official website of the World Bank, as discussed in Table 1.
Measurement and Operationalization of Variables.

Similarly, in Model-II, the equation examined the relationship between green finance and carbon emissions. The measurement of carbon emissions (CO2) was obtained as the proxy per capita CO2 emission. The same control variables as in Model I were included. Descriptive statistics and correlation analysis were conducted on the obtained data.
The panel data used in the study spanned 18 years from 2000 to 2018 for the 10 selected countries. Ecological footprint (EFT) data was obtained from the Global Footprint Network, while green finance (GFIN) data was sourced from the Asian Development Bank (ADB, 2020), following Z. Khan et al. (2022). By following, Ullah et al. (2018), the test of Durbin-Wu has been applied, which confirms the issue of endogeneity. To address issues of this endogeneity and unobserved heterogeneity, the system generalized method of moments (GMM) was employed for hypothesis testing (Tzouvanas et al., 2020).
This research study utilized the system generalized method of moments (GMM), a robust econometric technique adept at addressing potential endogeneity and unobserved heterogeneity issues in panel data analysis. Overall, the methodology involved adapting existing models, collecting relevant data from various sources, employing panel data analysis, conducting descriptive statistics and correlation analysis, and using the system GMM for hypothesis testing. By incorporating control of corruption as a unique variable and utilizing robust econometric techniques, the study aimed to provide valuable insights into the interplay between green finance, corruption control, and sustainable development in developed economies.
Results & Discussion
Descriptive Statistics
The descriptive statistics presented in Table 2 provide an overview of the variables used in the study conducted in 10 developed countries. The average ecological footprint (EFT) was 6.4585, indicating that, on average, the ecological footprint per capita is 658 global hectares. The standard deviation of 1.2686 shows the variability in the average ecological footprint value over the studied period and across different countries. This data highlights the unique aspect of the study by quantifying the ecological footprint and capturing its variation across developed countries.
Descriptive Statistics.

Note. EFT = ecological footprint; CO = carbon emission; GFIN = green finance; GDP = gross domestic product; POP = population; TO = trade openness; CC = control of corruption.
Similarly, the average per capita CO2 emission (CO) was 116,880, demonstrating the average carbon emissions in metric tons. The standard deviation of 1.3409 indicates the variability in carbon emissions across the studied countries. This information adds a distinctive aspect to the research by incorporating carbon emissions as an important variable and reflecting its variation within the selected countries.
The descriptive statistics also provide insights into the control variables. The average Gross Domestic Product (GDP) was $45,348, representing the economic output per capita. The average population (POP) was approximately 13,866,688, indicating the average size of the population in the studied countries. Trade openness (TO), measured by the goods trade to GDP ratio, had an average value of 4.0296, showing the degree of international trade integration. The control of corruption (CC) had an average rank of 4.5670, reflecting the level of corruption control in the countries. These control variables contribute to the novelty of the study by considering important factors that may influence the relationship between green finance and ecological footprint.
In Figure 1, the graphical presentation of the ecological footprint across the 10 countries over the 18 years (2000–2018) is shown. The figure highlights the variation in ecological footprints among the countries. Specifically, Canada, New Zealand, and Denmark had comparatively higher ecological footprints throughout the studied period. Notably, the ecological footprint in Canada remained consistently high until 2018. In contrast, the other countries exhibited substantially lower ecological footprints. This visualization of the data adds a unique perspective to the research by illustrating the country-specific patterns and differences in ecological footprints.

Graphical Presentation of Ecological Footprint.
The descriptive statistics provided in Table 2 offer valuable insights into the ecological footprints, carbon emissions, and control variables in the selected developed countries. These statistics quantify and characterize the variables, allowing for a better understanding of their variations over time and across different countries. By presenting the mean, standard deviation, minimum, and maximum values for each variable, the table provides a comprehensive overview of their distribution.
The ecological footprint (EFT) has an average value of 6.4585, with a standard deviation of 1.2686. This indicates that, on average, the ecological footprint per capita is approximately 658 global hectares, with a variation of around 1.27 among the studied countries. The minimum and maximum values of 4.3483 and 9.5081, respectively, reveal the range of ecological footprints observed in the dataset. This information highlights the individuality of the data by providing a quantitative measure of the ecological footprints and showcasing their diversity.
Similarly, the carbon emissions (CO) exhibit an average value of 11.6689, with a standard deviation of 1.3409. This translates to an average per capita CO2 emission of approximately 116,880 metric tons, with a variation of around 1.34 among the countries. The minimum and maximum values of 10.2905 and 14.0488, respectively, illustrate the range of carbon emissions captured in the dataset. Incorporating carbon emissions as a variable in the study adds an important dimension to understanding the environmental impact of the selected countries.
The descriptive statistics for the control variables provide additional context for the analysis. The mean GDP (Gross Domestic Product) is 10.7221, indicating an average GDP of $45,348. The standard deviation of 0.3630 shows the variation in economic output per capita among the countries. The population (POP) has an average value of 16.4450, corresponding to an average population size of approximately 13,866,688. The standard deviation of 1.1703 reveals the differences in population sizes across the studied countries. The trade openness (TO), measured by the goods trade to GDP ratio, has an average value of 4.0296, indicating the degree of international trade integration. The standard deviation of 0.4018 signifies the variation in trade openness among the countries. Finally, the control of corruption (CC) has an average rank of 4.5670, reflecting the level of corruption control in the countries. The standard deviation of 0.0372 suggests a relatively narrow range of corruption control ranks.
Overall, the descriptive statistics presented in Table 2 contribute to the research by providing a comprehensive overview of the ecological footprints, carbon emissions, and control variables in the selected developed countries. These statistics allow for a better understanding of the variables’ characteristics, variations, and ranges. The distinctiveness of this data lies in its quantitative representation, which enhances the analysis and interpretation of the research findings.
Correlation Analysis
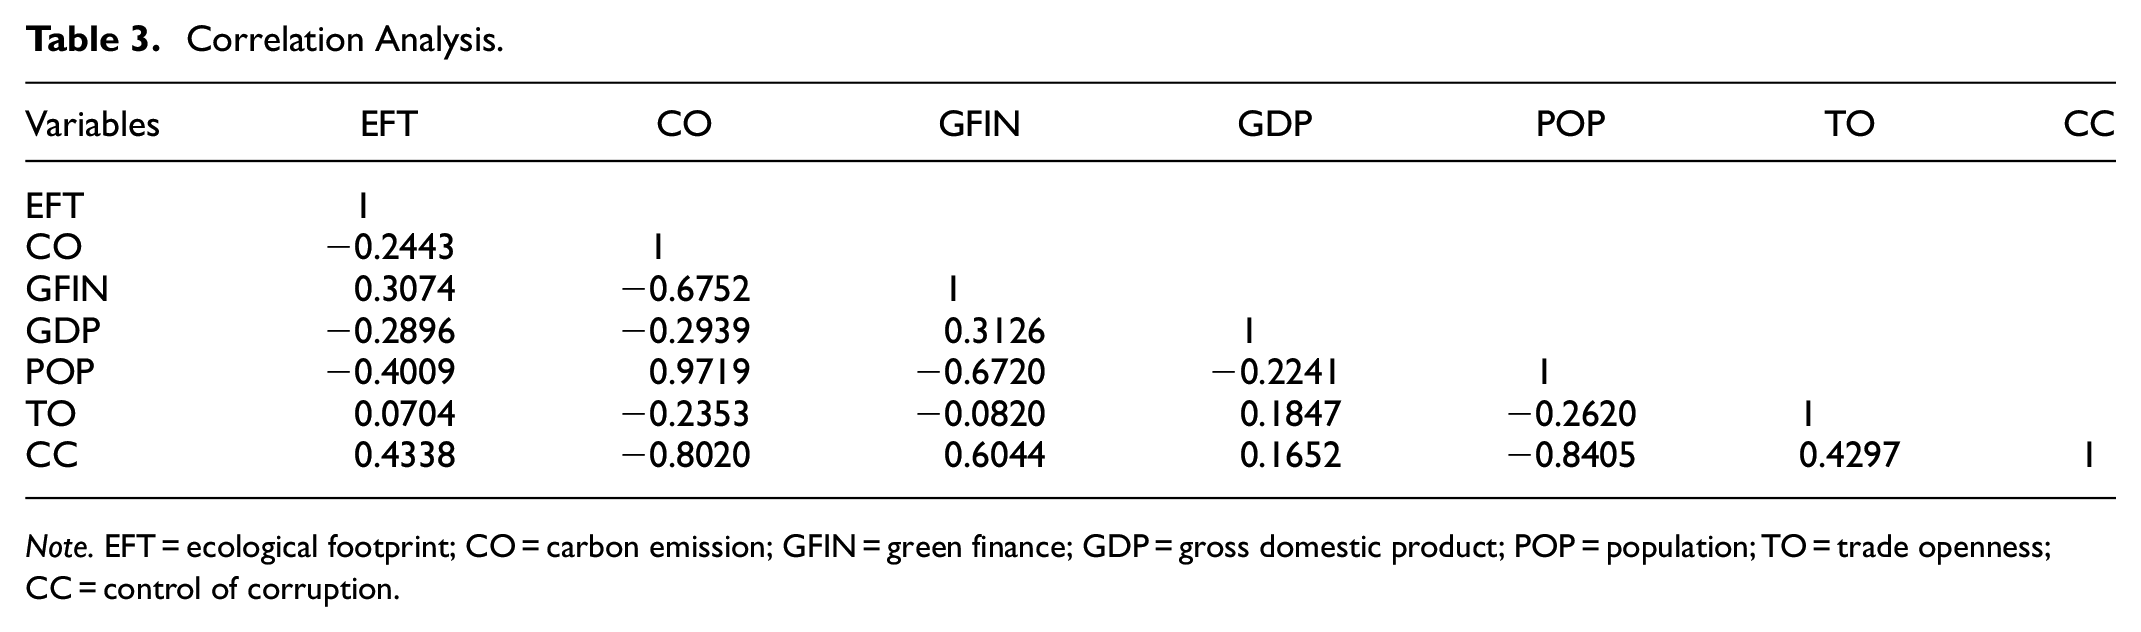
The correlation analysis presented in Table 3 provides insights into the relationships between the variables in the study. The data quantifies the correlations and potential issues of multicollinearity. The table showcases the correlation coefficients between the variables, with values ranging from −1 to 1.
Correlation Analysis.
Note. EFT = ecological footprint; CO = carbon emission; GFIN = green finance; GDP = gross domestic product; POP = population; TO = trade openness; CC = control of corruption.
In Table 3, the ecological footprint (EFT) has a negative correlation (−.2443) with carbon emissions (CO). This suggests that as the ecological footprint increases, carbon emissions tend to decrease, indicating a potential relationship between environmental sustainability and carbon emissions reduction. Similarly, there is a positive correlation (.3074) between the ecological footprint and green finance (GFIN), implying that higher levels of green finance may contribute to a larger ecological footprint.
The control variables also demonstrate correlations with the main variables of interest. For example, a negative correlation (−.2896) exists between GDP (Gross Domestic Product) and the ecological footprint, indicating a potential association between higher GDP levels and lower ecological footprints. This suggests that countries with higher GDP tend to exhibit lower environmental impact. Similarly, there is a negative correlation (−.4009) between population (POP) and the ecological footprint, implying that larger population sizes may be linked to reduced ecological footprints. This pattern can be observed in developed economies where population growth is accompanied by advancements in efficiency, technology, sustainability practices, and effective resource management. Overall, these findings suggest that both economic factors (GDP) and population size (POP) play a role in shaping ecological footprints, and higher levels of GDP and population are associated with lower ecological footprints.
Trade openness (TO) has a weak positive correlation (.0704) with the ecological footprint, implying that higher levels of trade openness may have a slight positive influence on the ecological footprint. This suggests that higher levels of trade openness may have a slight positive influence on the ecological footprint, indicating that increased trade activities could potentially contribute to a larger ecological footprint. Control of corruption (CC) shows a positive correlation (.4338) with the ecological footprint, indicating that countries with better control of corruption may exhibit larger ecological footprints. This indicates that countries with better control of corruption tend to have larger ecological footprints. In other words, there is a tendency for countries with lower corruption levels to exhibit greater environmental impact or ecological footprints.
It is important to note that the correlation coefficients between the explanatory variables are all below .9, which indicates that there is no severe multicollinearity issue (Hair et al., 2010). Multicollinearity refers to a high degree of correlation between two or more independent variables, which can affect the reliability of regression models. Since the correlation coefficients in this study are below the threshold of .9, it suggests that the variables can be included in the regression models without significant multicollinearity concerns.
In summary, the correlation analysis provides insights into the relationships between the variables in the study. The peculiarity of this data lies in quantifying these correlations and identifying potential multicollinearity issues. Understanding these relationships is essential for interpreting the results and assessing the impact of various factors on ecological footprints and carbon emissions in the selected developed countries.
Results of System GMM
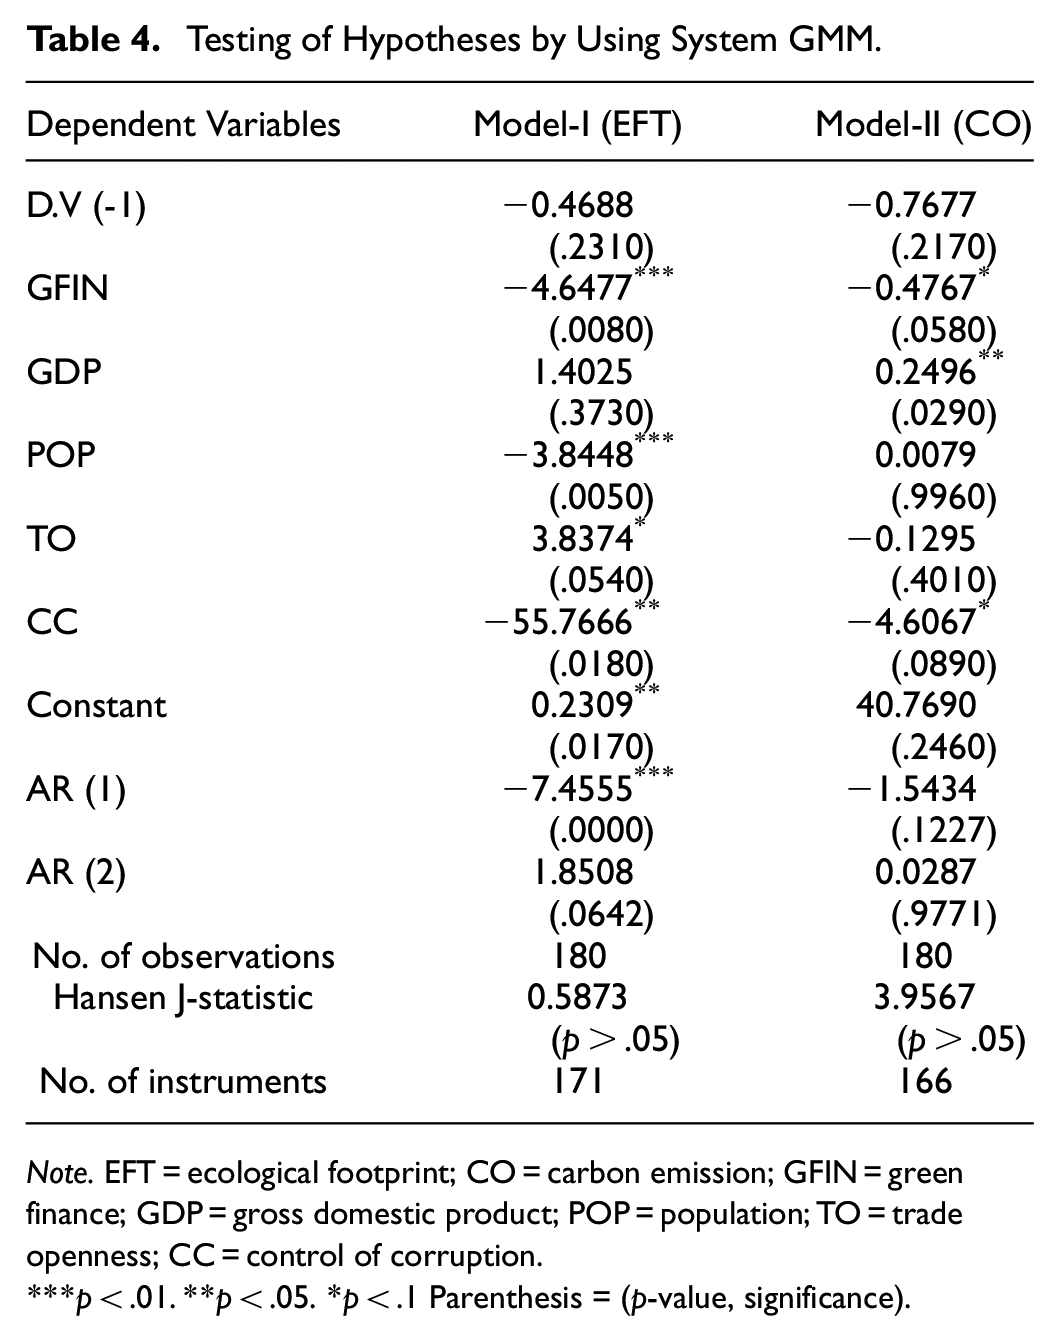
Table 4 presents the findings of the hypotheses tested using the system GMM technique. The results reveal that the overidentifying restrictions of instrumental variables are valid, as indicated by the Hansen J-Statistic probabilities exceeding 0.05 in both Model-I and Model II. A total of 180 observations with 171 instruments are utilized in Model I, while Model II comprises 180 observations with 166 instruments. Moreover, the issue of autocorrelation is effectively addressed, with lag-1 and lag-2 considered for Model-I and Model-II, respectively.
Testing of Hypotheses by Using System GMM.
Note. EFT = ecological footprint; CO = carbon emission; GFIN = green finance; GDP = gross domestic product; POP = population; TO = trade openness; CC = control of corruption.
***p < .01. **p < .05. *p < .1 Parenthesis = (p-value, significance).
The outcomes of both models highlight the significant negative impact of green finance (GFIN) on both the ecological footprint (EFT) and carbon emissions (CO). These results suggest that the implementation of green finance contributes to the reduction of ecological footprints and carbon emissions, underscoring its potential to promote environmental sustainability. Furthermore, Model I reveals that control of corruption and population exhibit a negative influence on the ecological footprint, implying that addressing corruption issues and managing population growth can help mitigate environmental impact. In Model II, it is observed that GDP contributes to carbon emissions, while control of corruption demonstrates a reducing effect on carbon emissions.
These findings accentuate the unique contribution of green finance in fostering sustainable environmental outcomes. By incorporating the control of corruption as an explanatory variable, this study sheds light on the interplay between financial mechanisms, environmental impact, and governance factors. The negative relationship between green finance and both the ecological footprint and carbon emissions suggests that strategic investments in environmentally friendly initiatives can yield tangible environmental benefits. Additionally, the consideration of control variables such as GDP, population, trade openness, and control of corruption enhances the understanding of the complex dynamics influencing ecological footprints and carbon emissions in the context of developed countries.
Overall, these findings provide valuable insights into the potential of green finance as a tool for environmental sustainability. The results highlight the importance of addressing corruption, managing population growth, and promoting sustainable economic practices to achieve significant reductions in ecological footprints and carbon emissions. Such insights can inform policymakers and stakeholders in designing effective strategies to promote green finance and ensure a more sustainable future for the selected developed countries.
Discussion
This study aimed to investigate the relationship between green finance, corruption control, and sustainable development in developed economies, with a specific focus on the correlation between ecological footprint and green finance. The results revealed a negative correlation between green finance and ecological footprint, aligning with the goals set forth by international agreements such as the Kyoto Protocol 2001 and the Paris Accord 2015. These agreements emphasize the use of green finance to reduce ecological footprint through energy efficiency, GHG emission reduction, and addressing cross-cutting issues, thereby contributing to SDG no. 13, climate action (Maizland, 2022).
In line with previous studies, this research considered renewable energy as a proxy for climate mitigation finance. It was found that environmentally responsive financing and investments can substantially reduce the ecological footprint and CO2 emissions (Duchêne, 2020; M. M. Khan et al., 2022). The successful reduction of ecological footprint and CO2 emissions hinges on launching eco-supportive projects in the sample economies. Notably, the persistence of a high ecological footprint in Canada, despite efforts made by various authorities, indicates a need for more effective measures to combat environmental degradation (GC, 2018).
Factors Influencing Ecological Footprint in Developed Economies
To ensure robustness in the examination of ecological footprint, this study included four control variables: GDP, population (PoP), trade openness (TO), and control of corruption (CC). Similar variables have been employed in prior studies, although not collectively as in this article (M. Destek & Sinha, 2020; Herman & Xiang, 2022; M. M. Khan et al., 2022; X. Xu et al., 2021). Therefore, this research contributes to the existing literature by analyzing the nexus between GDP, PoP, TO, CC, and ecological footprint collectively.
The empirical findings indicate that control of corruption (CC) significantly impacts ecological footprint (EFT), which is supported by previous studies (Apergis & Garcia, 2019; X. Yao et al., 2021). Controlled corruption can lead to efficient investments in clean energy and honest administration, which ultimately protect the environment. Countries with higher scores on the Corruption Perception Index (CPI) 2018, such as Denmark, demonstrate effective control of corruption through anti-corruption strategies and government sector involvement (Jeffrey et al., 2018). While previous studies have explored the nexus between control of corruption and ecological footprint in various contexts, this study’s focus on the top ten CPI 2018 economies adds a unique contribution.
The results also reveal a significant impact of trade openness on ecological footprint, consistent with findings from prior studies (M. Destek & Sinha, 2020; Herman & Xiang, 2022; Nasir et al., 2021; Nguyen & Huynh, 2021; Radmehr et al., 2022). The finding suggests that OECD countries can leverage international trade avenues to exchange cleaner technologies and reduce ecological footprint. The implementation of green trade policies, as proposed by M. A. Destek and Sinha (2020b), can serve the dual purpose of reducing ecological footprint and promoting renewable energy solutions.
Population dynamics, particularly urbanization, were found to have a significant impact on ecological footprint. Urbanization brings about economies of scale, robust utility industries, efficient waste management, and the utilization of renewable technology (Chen et al., 2022). These factors contribute to substantial changes in the environment and highlight the need to consider population dynamics in assessing ecological footprint.
Given that ecological footprint (EFIN) is still a nascent measure in environmental economics, this study tested the robustness of the results using CO2 emissions as an alternative measure (M. M. Khan et al., 2022; Zhou et al., 2022). The findings, which show a negative correlation between green finance (GFIN) and CO2 emissions, consequently, strengthen the hypothesis. Moreover, the negative impact of GDP and the significantly positive impact of control of corruption at a 10% confidence level add further support. These robust results can motivate practitioners and policymakers to enhance green finance techniques to combat climate change.
Pioneering Role of Green Finance in Achieving SDG-13
The findings of the study are valuable for OECD policymakers aiming to achieve the Sustainable Development Goals (SDGs). Despite the top positions of Sweden, Denmark, and Finland in the SDG Index, these countries face challenges in achieving SDG 12, 13, and 14 (Jeffrey et al., 2018, 2022). These findings underscore the importance of reevaluating existing green finance techniques used to combat climate change.
Policymakers can adopt regional and international climate change policies and tools to minimize CO2 emissions in imports, address unsustainable supply chains, and regulate trade in hazardous pesticides and plastic waste. Examples include Finland’s incorporation of ecological footprint and international spillover in voluntary national reviews (VNRs) and Sweden’s efforts to reduce CO2 embodied in imports. The European Union’s consideration of the Carbon Border Adjustment Mechanism also aligns with these objectives (Finland, 2022; Paleari, 2022; Schunz, 2022).
By adopting such policies, OECD member countries can fulfill the goal of “leaving no one behind” by not only achieving targets within their own countries but also supporting developing countries in SDG implementation. International financing, as emphasized in the Kyoto Protocol 2001 and Paris Accord 2015, plays a crucial role in supporting mitigation and adaptation action plans in developing countries. Entities like the Global Environment Facility (GEF) and Green Climate Finance (GCF) serve as operational entities of the financial mechanism, mobilizing resources for developing countries (M. M. Khan et al., 2020).
While sustainable development goals were initially designed by OECD countries, deeper strategies are required to involve vulnerable economies in decision-making processes (Jeffrey et al., 2022). OECD member countries must revise government policies and increase the use of climate finance, such as grants, loans, and guarantees, to mobilize resources and achieve the SDGs. Additionally, addressing transboundary movements through the ratification of agreements like the Basel Ban Treaty is crucial to prevent further climate shifts in lower-income countries (Thapa et al., 2022). This study stands apart from existing literature by highlighting the significant exploration of climate mitigation finance to address climate change by OECD countries. The emphasis on green finance (GFE) for targeting SDG 13 demonstrates the pioneering role of developed economies in highlighting the importance of climate finance for sustainable development.
The pursuit of sustainable development goals (SDGs) was primarily driven by OECD countries, but achieving these goals requires more comprehensive strategies that include the participation of vulnerable economies in decision-making processes (Jeffrey et al., 2022). OECD member countries must revise their government policies and increase the utilization of climate finance, such as grants, loans, and guarantees, to mobilize resources and effectively accomplish the SDGs. The study highlights the novel focus on the top 10 countries in the Corruption Perception Index (CPI) 2018, as these countries have been exporting environmental degradation to developing nations (M. Destek & Sinha, 2020).
However, an important challenge lies in the failure to ratify crucial agreements like the Basel Ban Treaty, which would control transboundary movements and prevent further climate shifts in lower-income countries (Thapa et al., 2022). This neglect exacerbates the problem of climate change for these vulnerable nations. The distinctive contribution of this study lies in its exploration of the significant role of climate mitigation finance in addressing climate change by OECD countries. Existing literature has not extensively examined this aspect, making this study unique in its focus (M. Destek & Sinha, 2020).
The pioneering nature of developed economies in using green finance (GFE) to target SDG 13 deserves recognition. By emphasizing the importance of climate finance, these economies demonstrate their commitment to achieving SDG 13 and promoting sustainable development. The study sheds light on this crucial aspect and highlights the significance of climate finance in the efforts of developed nations to attain sustainable development goals (Jeffrey et al., 2022).
In conclusion, OECD member countries must adopt more comprehensive strategies to involve vulnerable economies in decision-making processes and achieve the SDGs. This requires revising government policies and increasing the utilization of climate finance. It is essential to address transboundary movements by ratifying important agreements like the Basel Ban Treaty to prevent further climate shifts in lower-income countries. This study’s contribution lies in its exploration of the significant role of climate mitigation finance in addressing climate change, which has been less extensively studied in existing literature. The emphasis on green finance (GFE) to target SDG 13 showcases the pioneering role of developed economies in highlighting the importance of climate finance for sustainable development (M. Destek & Sinha, 2020; Jeffrey et al., 2022; Thapa et al., 2022).
Conclusion
This study investigated the interplay between green finance, corruption control, and sustainable development in developed economies, specifically focusing on the ecological footprint from 2000 to 2018 in the top 10 countries listed on the Corruption Perception Index (CPI) 2018. By employing the system generalized method of moments (GMM) to address endogeneity and autocorrelation issues, the relationship between ecological footprint (EFT) and green finance (GFE) was analyzed. The study’s key findings reveal a negative impact of green finance on the ecological footprint. To ensure the robustness of the model, CO2 emissions were also considered as an alternative measurement criterion, producing consistent results.
Among the selected developed economies, Canada stands out with persistently high ecological footprint levels from 2000 to 2018. This reinforces the need for government organizations to devise policies that contribute to achieving the Sustainable Development Goals (SDGs) and aid developing countries in addressing climate change. The negative externalities of economic activities pose a global predicament that requires resolution. Proponents of green finance advocate for the implementation of climate mitigation finance policies to address economic externalities without hindering economic growth.
Advocating the adoption of the Enhanced Transparency Framework (ETF) is instrumental in strengthening the effectiveness of green finance policies. The ETF provides a structured platform for the regular assessment and peer review of countries’ progress in achieving their ecological footprint reduction targets. By embracing this framework, developed economies can foster a culture of accountability and transparency, encouraging them to actively engage in environmental conservation. The collaboration of technical specialists in these peer reviews enhances the rigor and accuracy of the evaluation process, ultimately leading to more informed and strategic policymaking.
Furthermore, the success of these proposed policies also hinges on the alignment of financial institutions with the overarching goals of ecological preservation and sustainability. Encouraging financial institutions to incorporate green finance principles into their lending practices and investment decisions is imperative. This entails offering incentives for green initiatives and imposing sanctions for environmentally detrimental activities. By reshaping the financial sector’s focus toward sustainability, developed economies can facilitate the flow of funds into projects that have a positive impact on reducing ecological footprints, further advancing the cause of global environmental conservation and sustainable development.
Practical Implications
The findings of this study offer practical implications that hold the potential to catalyze a transformation in policymaking within developed economies. From the study’s results, it can be deduced that policymakers can employ a range of policy instruments to make substantial reductions in ecological footprints by implementing cutting-edge green finance techniques. These encompass the groundbreaking Enhanced Transparency Framework (ETF), optimal carbon pricing systems, and innovative non-pricing emission control strategies (Abrell & Kosch, 2021; Huang et al., 2022; Naqvi et al., 2022). Furthermore, by integrating the expertise of technical specialists in multilateral peer reviews and the assessment of reported information within the ETF framework, the effectiveness of these policies can be significantly enhanced (Quinn et al., 2022).
While some of these policies have seen partial adoption within the sample countries, policymakers across all OECD nations must take resolute actions by enacting regulations that safeguard the environment and proactively address climate change. This need is particularly apparent in Canada, where the persistence of a high ecological footprint necessitates tailored strategies and specific interventions. Policymakers and practitioners can harness the power of biennial transparency reports (BTRs) to systematically monitor progress in mitigating climate change, document successful adaptation strategies, and closely oversee the support provided or received throughout the process. These comprehensive records can serve as invaluable tools for Canada and other developed countries in effectively supervising progress toward their long-term climate goals.
Despite commendable efforts by the sample countries in implementing carbon pricing systems, such as carbon taxes and the EU emission trading system (ETS), the full potential of these mechanisms remains unrealized due to the partial allocation of the generated revenue toward environmental spending. It is, therefore, paramount for all high-income OECD countries to adopt the optimal carbon pricing model, ensuring efficient implementation, and directing the generated revenue toward environmentally focused initiatives. By aligning theoretical efficiency with concrete actions, these countries can establish a new benchmark for sustainable development and ecological preservation.
Limitations
It is imperative to recognize the inherent limitations of this study. The research focuses primarily on a subset of developed economies, potentially limiting the generalizability of its findings to a broader context. Acknowledging this constraint is essential for fostering a nuanced interpretation of the study’s implications and for informing future research endeavors.
In conclusion, while the article offers a significant contribution to the discourse on sustainable development, its limitations necessitate a cautious interpretation of the findings. To enhance the authenticity and applicability of the research outcomes, it is recommended that future investigations adopt a more ambitious approach. Expanding the scope of inquiry to encompass all OECD countries would provide a more comprehensive understanding of the intricate relationships between green finance, corruption control, and sustainable development. This inclusive strategy holds the potential to generate more robust and universally applicable outcomes, paving the way for a paradigm shift in global environmental governance.
Future Directions
As we look to the future, the research should explore the impact of green finance on specific sectors and industries within developed economies (Jia et al., 2021; Cao et al. (2021)). Investigating how different sectors, such as energy, agriculture, and transportation, respond to green finance initiatives can provide valuable insights into sector-specific challenges and opportunities. This sectoral analysis can guide policymakers in tailoring their green finance strategies to address the unique needs and constraints of various industries, ultimately leading to more effective environmental upgrade efforts.
Furthermore, the role of public-private partnerships in promoting green finance and environmental sustainability should be a focal point of future research (Raghutla et al. (2021); Zhou et al., 2022). Understanding how governments and private enterprises collaborate to fund and support environmentally friendly projects can shed light on the dynamics of green finance implementation. Such research can reveal best practices for harnessing the expertise and resources of both sectors to achieve common environmental goals.
Additionally, the research in this field should expand beyond conventional boundaries and encompass investigations at various levels, incorporating the Sustainable Development Goals (SDGs) of Life on Land (SDG 15) and Life Below Water (SDG 14). By recognizing the intricate relationship between these goals, we can comprehensively address the impact of ecological footprints on both terrestrial and aquatic ecosystems. Overlooking the significant risks posed by ecological footprints to life below water hampers progress toward sustainable development.
The untapped potential of ocean resources can act as a transformative force, providing new pathways for OECD countries to not only fulfill SDG 13 but also make substantial strides toward SDG 14 (United Nations, 2022). The Sustainable Development Report 2022 has highlighted the widespread neglect of SDG 14 by global economies, underscoring the urgent need to conserve and sustainably harness ocean resources to expand renewable energy sectors and unlock the immense potential of alternative resources.
Likewise, a comprehensive and exclusive study focusing on Canada is essential for gaining a clearer understanding of its specific circumstances. By meticulously examining the key findings and utilizing the most recent data, policymakers can gain deeper insights into the ongoing efforts of the Canadian government to combat climate change (Government of Canada, 2018).
A thorough assessment of Canada’s initiatives, considering the distinctive features of its environmental landscape, will contribute to a more nuanced understanding of the critical success factors and policies that can be effectively implemented in both developed and developing nations. Conducting such in-depth research on developed countries is a crucial step toward realizing the shared vision of global environmental sustainability, fostering collaboration, and facilitating the exchange of best practices to achieve a harmonious coexistence between humanity and nature.
Lastly, exploring the potential of emerging technologies, such as blockchain and artificial intelligence, in enhancing the effectiveness of green finance initiatives presents a promising avenue for future research (Barth et al., 2022; Tandelilin et al., 2022). These technologies can improve transparency, traceability, and efficiency in green finance transactions, reducing the risk of environmental degradation. Investigating the integration of cutting-edge technologies with green finance can offer innovative solutions for addressing ecological footprints and advancing environmental upgrade efforts.
In conclusion, the future direction of research in the field of green finance and environmental upgradation is rich with possibilities, ranging from a holistic consideration of SDGs to sector-specific analyses, exploring public-private partnerships, and harnessing the potential of emerging technologies. By embracing these avenues of inquiry, we can pave the way for more effective and comprehensive strategies to address ecological footprints and achieve sustainable environmental goals.
The authors appreciate the constructive comments which helped to improve the manuscript.
Footnotes
Acknowledgements
The authors appreciate the constructive comments which helped to improve the manuscript.
Abbreviations
SDG = Sustainability Development Growth, EFT =Ecological Footprint, CO = Carbon Emission, GFIN = Green Finance, GDP = Gross Domestic Product, POP = Population, TO = Trade Openness, CC = Control of Corruption
Author Contributions
The study was articulated by Rabia Habib, Muhammad Aksar, and Aleena Nadeem; the data was taken from the Global Footprint Network and ADB. It was an original study carried out independently to highlight the impact of green finance on the ecological footprint in sustainable economies.
Declaration of Conflicting Interests
The author(s) declared no potential conflicts of interest with respect to the research, authorship, and/or publication of this article.
Funding
The author(s) received no financial support for the research, authorship, and/or publication of this article.
Data Availability Statement
Data collected from Global FootPrint Network, Worldwide Goverance Indicators, Asian Developement Bank and Corruption Perception Index.