
Abstract
This study was carried out to analyze the impact of ecological footprint (EFP), exchange rate (EXC) and bio-capacity (BC) on foreign direct investment (FDI) in South Africa. The study was based on monthly time series data from 1996 to 2017. Asymmetric dynamic multiplier, Linear and Nonlinear Autoregressive distributed lag models were used to establish the relationship between the selected variables. Linear ARDL reveal significant symmetric relationship between FDI, ecological footprint, biocapacity and exchange rate in the short run. Nonlinear Autoregressive distributed lag (NARDL) bounds test confirmed the existence of cointegration between the variables. The non-linear short-run results reveal that positive shock of EXC affect FDI negatively. While positive shock from EFP has a significant and positive effect on FDI. Interestingly, in the long run the negative shock of EXC on FDI is negative while the positive shock of EXC affects FDI positively. Furthermore, the long-run asymmetric dynamic multiplier showed that the cumulative positive and negative effect of EFP and BC on FDI is positive. Hence, it is important that policies be put in place to ensure environmental sustainability and stable exchange rate while growing the South African economy. Policy regulations on production procedures in South Africa should be established to encourage advanced clean technologies in FDI production sectors
Introduction
Different countries around the world experience huge advantages of foreign direct investment (FDI). Su et al. (2019) FDI has proven to aid economic growth positively. As years go by, foreign direct investment stocks continue to grow worldwide. The total stock of FDI in 2015 stood at 1.8 trillion dollars, which was a 40% increase from 2014 total FDI stock. 1 FDI is critical in ensuring economic globalization through the trade between countries, states, locales and firms. However, the introduction of these investments into the host countries brings about some disadvantages to its economy when carefully analyzed (Brada et al., 2019). Environmental degradation increases mostly in countries that open their borders to foreign investors as compared to countries that do not indulge (Akin, 2014).
Recently, South Africa established policies to increase FDI inflows; the major one was the protection of investors Act 2015. This act was put in place to reinforce transparency with investors while protecting their legal rights. However, UNCTAD World investment report 2 recorded a decline in foreign direct investment in South Africa by 15% in 2019 from 5.4 billion in 2018 to 4.6 billion in 2019. In addition, FDI inflows in South Africa fell by 39% from 4.6 billion in 2019 to 3.1 billion in 2020. 3 Hence it is vital to investigate into the factors responsible for the constant decline in FDI in South Africa.
In a bid to increase FDI inflows, previous studies in this field have indicated significant relationship between FDI inflows and environmental degradation using CO2 emissions as its measure (Hanif et al., 2019; Muhammad et al., 2020). However, CO2 emissions pertain to only a portion of environmental degradation which is air pollution (Solarin & Al-Mulali, 2018; Ulucak & Lin, 2017). Based on this, ecological footprint is better measure of environmental degradation as it indicates the total human consumption in terms of productive areas used (Hassan et al., 2019; Mrabet & Alsamara, 2017; Ulucak & Bilgili, 2018).
Furthermore, environmental degradation in South Africa can be linked to the high amounts of oil spillage, greenhouse gases emissions, burning of fossil fuels and soil erosion (Department of Forestry Fisheries and the Environment [DFFE], 2021). As at 2017, South Africa emitted million metric tonnes of CO2–eq. Of which 84.75% was from carbon dioxide, 9.28% from methane and 4.8% from nitrous oxide. Greenhouse emissions have increased by 10% since 2000 to 2017 (DFFE, 2021). South Africa is rich in natural resources (gold, platinum, diamonds, and coal) 4 which attract foreign direct investments that help to build the economy. However, overutilization of these resources tends to contribute negatively to the environment due to high levels of methane, metal vapor, and sulfur dioxide emissions contributing to greenhouse emissions. Foreign investors in South Africa are majorly from the mainstream renewable energy, mining, manufacturing, transportation and automotive industries. The major investors in South Africa are mostly European countries, United States, China, and Australia. Currently, the global footprint network estimates that South Africa has ecological deficit. 5 South Africa’s ecological footprint exceeds its bio capacity which indicates that the country utilizes more resources and generates wastes than its ecosystem can renew.
The carrying capacity of the ecosystem is accounted for by the ecological footprint (EF) along with bio capacity (Galli et al., 2020; Świąder et al., 2020). EF measures renewable natural resources and bio productive land in relation to high human consumption activities (Lin et al., 2018). While Biocapacity measures the capacity of the ecosystem to renew and regenerate resources demanded. The Global footprint network specifies ecological footprint into 4 areas including the Production EF, Consumption EF, Imports EF, and Exports EF. Production EF reveals biocapacity utilized in relation to production processes. Consumption EF indicates biocapacity embedded in human utilization of goods and services (Chowdhury et al., 2021). Consumption EF is computed as Production EF plus Imports EF less Exports EF. Imports and Exports EF computes the total bio capacity used during the course of imports and exports in the host country.
Developing countries tend to generate high production ecological footprint in relation to FDI production processes (Doytch, 2020). Also, Consumption EF has significant relationship with FDI levels in high income countries (Zafar et al., 2019). Countries with high foreign direct investments tend to have high ecological footprint. 6 While, countries with low levels of foreign direct investments have lower levels of ecological footprint. Furthermore, biocapacity accounts for the capacity of the ecosystem to absorb waste and regenerate despite the high human demand on natural resources (Global Footprint Network, 2020). Ideally, Environmental prosperity occurs where bio capacity exceeds ecological footprint to establish ecological reserve. This implies that a country’s regenerative capacity exceeds consumption and demand on natural resources. However, when ecological footprint exceeds biocapacity in a country this causes an ecological deficit. 5 Ecological deficit occur when a country imports resources that it does not produce or due to transfer of biocapacity from one nation to another (Galli et al., 2020).
According to Solarin et al. (2017) foreign direct investments have a negative relationship with environmental degradation in the sense that countries with strict regulations make it difficult for foreign investors to invest in the host country. Again, the studies of Ahmed et al. (2020), Demena and Afesorgbor (2020), and Zafar et al. (2019) state that foreign direct investments aid in reducing environmental pollution in a country. While, on the opposing side of findings are Muhammad et al. (2020), Hanif et al. (2019), and Baloch et al. (2019). They discovered that increased foreign direct investments in host countries leads to high levels of environmental pollution and degradation.
Previous literatures are limited to investigating the symmetric relationship between ecological footprint and FDI. To contribute to the FDI-environmental degradation nexus: Firstly, this study investigates both the symmetric and asymmetric impact of ecological footprint on foreign direct investment in the short and long run in South Africa. This study will utilize the ARDL and the Nonlinear ARDL estimators developed by Pesaran et al. (2001) and Shin et al. (2014). Asymmetric Cointegration and Dynamic Multipliers in a Nonlinear ARDL Approach is advantageous over other techniques used by prior empirical works because it determines the asymmetric relationship between selected variables. This econometric helped to determine unseen cointegration and asymmetry in the selected variables which previous literature has not addressed.
Secondly, the interaction between economic and environmental activities is combined in this study to determine how the financial development of the South Africa can improve. This is done to contribute to the literature particularly in South Africa, as past literatures are limited in the country. The study helps to bring to the forefront the importance of good environmental policies and regulations to guide societal and business activities. The study also added control variables namely: bio-capacity and exchange rate to help get robust result from the analysis. Moreover, to the best of the authors’ knowledge, this work will fill the gap of FDI-environmental degradation nexus in the literature since the impact of the rate of exhaustion of bio productive land and ecological footprint along with an economic factor on FDI has not been studied. NARDL approach is applied in this study to evaluate the reaction of FDI to positive and negative shocks of economic and environmental variables in South Africa. NARDL methodology was used to take into account all factors outside the specified model to arrive at a reliable result. NARDL model was appropriately used to identify asymmetric and nonlinear relationship between the selected variables which has not been looked into in previous researches. Also, with the aid of asymmetric dynamic multipliers the long run and short run relationship between the variables are presented graphically. Finally, this research will also serve as a reference point to other scholars interested on the subject matter discussed in this study.
The rest of the current study is organized as follows, section 2 briefly summarizes related literature review in relation to foreign direct investment, ecological footprint, exchange rate and bio capacity. Section 3 describes the data, model specification and estimation methodology used in the study. Section 4 discusses the empirical findings. Section 5 gives conclusion and policy implication of the study findings.
Literature Review
This section is made of two segments. The first part is the theoretical framework which includes underlining theories for the relationship between the variables in this study. The second part of this section is the empirical review of past researches done in this field of environmental degradation, FDI inflows and economic uncertainty.
Theoretical Framework
There are many theories surrounding the determinants of FDI (Eskeland & Harrison, 2003; Golub et al., 2011). Also, empirical works have been developed to provide information regarding the relationship between FDI and environmental degradation (Ahmed et al., 2020; Muhammad et al., 2020). Pollutions havens hypothesis explains that investors tend to move their investments to countries with lax regulations (Gyamfi, Bein et al., 2021; Shahbaz et al., 2015). Hence, the environmental setting of a particular place has an effect on the level of foreign direct investment in the given country. The state of the country in terms of being developed or less developed also affects the relationship between environmental degradation and FDI (Demena & Afesorgbor, 2020). Some countries intentionally devalue their environments in order to attract foreign direct investment (Seker et al., 2015; Tang & Tan, 2015). This results in high levels of environmental degradation and pollution.
However, another school of thought supports the pollution halos hypothesis where increase in foreign direct investment leads to increase in environmental quality of a country (Baloch et al., 2019; Hanif et al., 2019; Muhammad et al., 2020). This is evident through the introduction of advanced technology in developing countries by developed countries. According to Bin and Yue (2012) the advantages of technologies brought into the country via foreign direct investment outweigh the negative effects it has on China as a country. Both the pollution havens and halos hypothesis can be existent in developing countries.
Countries with strong environmental regulations regarding environmental degradation tend to have higher inflows of foreign direct investment (Copeland, 2013; Solarin et al., 2017). Conversely, Countries with lax environmental regulations tend to have lower FDI inflows due to low environmental quality. This theory implies that countries with low ecological footprint due to strict environmental regulations tend to have higher inflow levels of foreign direct investments. Another theory of trade pinpoints that countries that are resource abundant tend to over utilize its ecological properties based on being more production inclined (Daniele, 2011; Das, 2004). Ecological inequality has become of great concern as biocapacity is transferred across international borders (Galli et al., 2020).
Ecological footprint as a concept was first introduced in the 1990s in regards to how land and water are used for the production of resources which are alternatively used by human beings (Hassan et al., 2019). According to Galli et al. (2012) ecological footprint is an adequate and precise measuring tool for degradation in the environment. Various studies have been carried out using ecological footprint as standard measure of environmental degradation including Chowdhury et al. (2021), Ahmed et al. (2020), and Zafar et al. (2019). Ecological footprint brings to the forefront the effect of human activities on the environment in using the natural resources available to a particular population. Ulucak and Bilgili (2018) Ecological footprint looks at the intended as well as the accidental impacts of production processes and depletion activities of humans on the environment.
Empirical Review
This section elaborates on previous researches done in relation to the subject matter of this paper. The empirical review section highlights various findings of researchers explaining the direct and indirect relationship between environmental degradation, economic uncertainty and FDI based on different methods of analysis. Empirical works are discussed here to aid in determining the difference in findings due to different countries, variable combination and time range used. The prior researches also provide a good foundation for this study.
Ecological Footprint and Foreign Direct Investment
Over time, there has been a continuous increase in FDI related research (Paul & Feliciano-Cestero, 2021; Wang et al., 2021). FDI inflows have been linked to increased economic growth in different countries (Iqbal et al., 2022; Joo & Shawl, 2021). The vital roles FDI plays in a country’s economic growth and development has motivated many studies carried out on the subject matter (Paul & Feliciano-Cestero, 2021). Le (2021) explained that tax revenue from FDI helps in promoting economic growth and wellbeing in the country. FDI increases economic growth in the host country through the transfer of technology, capital, technical expertise, and provision of employment opportunities (see Note 2).
However, on the opposing side, some scholars have found negative effects of FDI inflows in the host country that diminishes its economic advantages (Demena & Afesorgbor, 2020). FDI inflows have damaging effects to the environment of the host country which in turn depletes its wellbeing (Muhammad et al., 2020; Shahbaz et al., 2019). Nonetheless, Paul and Feliciano-Cestero (2021) indicated that the impact of FDI inflows on economic growth in different countries varies based on the level of its financial development. Furthermore, environmental, governance, institutional and economic factors have been noted to influence FDI and its ability to positively or negatively affect the productivity and development in a country (Chipalkatti et al., 2021; Dornean et al., 2021; Nguyen, 2017).
Many studies have been conducted to determine the variables that influence FDI. These researches have indicated significant relationship between environmental degradation and FDI (Baloch et al., 2019; Hanif et al., 2019; Shahbaz et al., 2019; Ulucak & Bilgili, 2018). These studies found out that environmental degradation has significant relationship with FDI. Though, the direction of the relationship between environmental degradation and foreign direct investment differs based on various research findings. Some researchers record a positive relationship between environmental degradation and FDI; while others record a negative relationship. Previous researchers have applied CO2 to represent environmental degradation (Gyamfi, Bein et al., 2021; Hanif et al., 2019; Shahbaz et al., 2019). However, ecological footprint has been found to be more accurate in representing environmental degradation (Ahmed et al., 2020; Baloch et al., 2019; Chowdhury et al., 2021; Liu & Kim, 2018; Zafar et al., 2019)
In Sub Saharan African Countries, Gyamfi, Bein et al. (2021) found that FDI increases environmental degradation. Panel quantile regression was applied to analyze data collected from 1990 to 2016. Pollution Havens Hypothesis was also found evident in the sub Saharan countries. In the same vein, Baloch et al. (2019) evaluated variables affecting environmental degradation in Belt and road countries using Driscoll-kraay panel regression estimation. The research led to findings that FDI, urbanization and economic growth and energy use has a positive relationship with EF. Liu and Kim (2018) also investigated into the connection between ecological footprint and foreign direct investment. The study focused on Belt and Road Initiative counties including 44 countries from the year 1990 to 2016. Panel Vector auto regression was used as an econometric technique in checking for the relationship between the variables. Findings of the study showed that ecological footprint has impact on foreign direct investment. Pollution Havens Hypothesis proved to be evident for foreign direct investment in the selected countries. Similarly, Chowdhury et al. (2021) found a positive relationship between FDI and ecological footprint. Their research covered 92 countries from 2001 to 2016.
Again, findings of Hanif et al. (2019) showed a positive relationship between FDI and environmental degradation. Autoregressive distributed lag model was used to evaluate the impact of FDI, fossil fuels consumption and economic growth on CO2 emissions. They discovered that fossil fuel consumption and FDI contribute to CO2 emissions degrading the environment in 15 emerging Asian countries. Based on the period 1990 to 2013 their research indicated that FDI aids in increase of environmental deterioration. Also, Shahbaz et al. (2019) used CO2 emissions to represent environmental degradation. They evaluated the effect of FDI, energy consumption and trade openness on CO2 emissions. They found that FDI and energy consumption increases CO2 emissions in the United States of America. Their research findings supported a positive relationship between FDI and environmental degradation.
In the case of Ullah et al. (2020) asymmetric relationship was found between FDI and environmental laws and guidelines in China. They stated that FDI react to changes in environmental regulations regarding pollution. Their findings also support Pollution Haven hypothesis. Also, Gökmenoğlu and Taspinar (2016) investigated into CO2 emissions and its relationship with foreign direct investment. The study was restricted to Turkey from the year 1974 till 2010. The study was conducted based on Causality tests and autoregressive econometric models to determine the relationship between the variables. The research findings explained that there exists a bidirectional relationship CO2 emissions and foreign direct investment.
In contrast to previous researches stated above, Demena and Afesorgbor (2020) found a negative but significant relationship between environmental pollution and FDI in developed countries. This finding supports Copeland (2013) theory that the relationship between the two variables depends on the level of development of the country and its strict environmental laws. Similarly, in G7 countries with higher income than developing economies, Ahmed et al. (2020) evaluated the relationship between ecological footprint and major influencing variables in from 1971 to 2014. Advanced panel data methodologies including panel co integration analysis, the continuously updated fully modified and continuously updated bias corrected technique were used in analyzing the collected data. Their findings indicated a negative relationship between FDI and ecological footprint. Similarly, Zafar et al. (2019) evaluated the influence of FDI on ecological footprint in the United States of America from 1970 to 2015. ARDL model was used to establish the association between the variables. Their research also indicated a negative relationship between FDI and environmental degradation represented by ecological footprint
Based on the Mediterranean area, Gyamfi, Adebayo et al. (2021) findings supported the pollution halo hypothesis. They found a negative relationship between FDI and environmental degradation represented by CO2. Augmented mean group (AMG) was applied to analyze data collected based on the period 1995 to 2016. Similarly, Solarin and Al-Mulali (2018) investigated into the relationship between FDI and environmental quality in developed and developing countries using augmented mean group (AMG) and common correlated effect (CCE). The indicators for environmental degradation involved CO2 emissions, carbon footprint and ecological footprint. Their results also showed that in developed countries, FDI and urbanization reduces environmental degradation. However, in developing countries, FDI and urbanization increases environmental degradation which implies a positive relationship. Along the same line, Liu et al. (2018) evaluated FDI and environmental degradation in China. Their findings also recorded a negative relationship between FDI and environmental degradation.
Economic Uncertainty and FDI
Foreign direct investment is known as a great way to transfer resources across national borders. In theory, there are factors that influence the level of FDI inflows into a particular country (Rjoub et al., 2017). One of those factors is economic uncertainty which comes in the form of volatility in exchange rate levels (Eregha, 2019; Mariadas et al., 2021; Qamruzzaman et al., 2019). Also, economic uncertainty can result due to fiscal policy uncertainty, trade policy uncertainty and fluctuations in interest rate based on different monetary policies (Ghironi & Ozhan, 2020; Istrefi & Mouabbi, 2018; Qamruzzaman et al., 2019). Furthermore, uncertainty in terms of economic policy has proved to have noteworthy influence on foreign direct investments in various countries (Anser et al., 2021).
Domestic economic policy uncertainty has gotten recognition due to the Economic Policy Uncertainty (EPU) index developed by Baker et al. (2016). High levels of EPU at the domestic stage have shown to decrease investments in general (Nguyen, 2017). EPU at the global level tends to increase FDI inflows to host countries (Nguyen, 2017). Sahinoz and Erdogan Cosar (2020) found a significant negative impact of economic uncertainty on FDI in Turkey. They made use of Vector auto regression models and dynamic factor approach in establishing the connection between the variables. However, this paper focuses on changes in exchange rate levels as a measure of economic uncertainty.
Some researchers are of the view that depreciation of exchange rate correlates with the increase in FDI inflows into the host country (Ahmad et al., 2019; Lee & Brahmasrene, 2020; Qamruzzaman et al., 2019; Tan et al., 2021). Ahmad et al. (2019) found a negative relationship between exchange rates and FDI inflows in China. Generalized methods of moments (GMM) and granger casualty tests were used to analyze data collected from 1981 to 2013. Their study supported the theory that countries with devalued currencies tend to have higher inflows of foreign direct investments. Reasons for this occurrence are; as a result of market imperfections at the international level and information asymmetry such that larger corporations have access to financial assistance as compared to small domestic companies (Choi & Jeon, 2007).
Also, Qamruzzaman et al. (2019) investigated the symmetric and asymmetric relationship between exchange rate and FDI in Bangladesh. They found a negative relationship between the variables. Exchange rate appreciation leads to decrease in FDI inflows in Bangladesh. NARDL model determined long run asymmetric relationship between the variables. Similarly, Lee and Brahmasrene (2020) used Vector error correction models and Impulse responses to analyze the association between exchange rate and FDI inflows in China. The analysis was based on based time series data from 2007 to 2009. The research findings indicated negative effect of exchange rate on FDI inflows in the long run. Using cointegration and Granger causality tests, Tan et al. (2021) also found a negative relationship between exchange rate and FDI inflows in the long run. The research was carried out on China based on the period from 1985 to 2019. Tham et al. (2018) study results show that real exchange rate has a negative impact on the different sectors in the economy in relation to foreign direct investment in Malaysia.
However, a positive relationship between exchange rate and FDI inflows has been found in some research work in Nigeria (Ayomitunde et al., 2020; Khatabi et al., 2020; Ogbonna, 2019). Ayomitunde et al. (2020) found a positive relationship between exchange rate levels and FDI inflows in Nigeria. The researchers utilized the symmetric ARDL model in analyzing data from 1990 to 2017. Yi et al. also found a positive effect of exchange rate on FDI in ASEAN countries. Based on the period from 2002 to 2016 Khatabi et al. (2020) found a positive relationship between exchange rate and FDI. Similarly, Ogbonna (2019) used bounds test approach to analyze effects of macroeconomic variables on FDI. The research findings of the study also indicated a positive effect of exchange rate on FDI inflows in Nigeria. Furthermore, Li and Rengifo (2018) carried out a research on institutional quality, exchange rate volatility and natural resources as determinants of outward foreign direct investment in China. An econometric analysis was used to measure the relationship between the selected variables from the year 2003 to 2013 in relation to 49 countries. The findings of the research also indicated that exchange rate volatility has a diminishing effect on the outward foreign domestic investment in China. However, appreciation of the Chinese currency leads to increase in outward foreign direct investment.
On the other hand, some studies indicate no relationship between exchange rate and FDI this includes the likes of Chowdhury and Wheeler (2015) and Polat and Payaslıoğlu (2016). Chowdhury and Wheeler (2015) evaluated the connection between exchange rate and FDI in developed countries including United States of America, Canada, United Kingdom, and Germany using vector autoregressive models. They found in their research that changes in exchange rate had no impact or effect on FDI in the selected countries. Also, Polat and Payaslıoğlu (2016) analyzed real exchange rate levels and its volatility on foreign direct investment in Turkey. The study focused on the period from 2004 to 2014. Markov switching model was used as an econometric method to establish the relationship between the variables. The research results show that there is no significant effect of real exchange rate levels and volatility on foreign direct investment. Based on this, different researchers have arrived at different conclusions as to the relationship that exists between exchange rate and foreign direct investment.
Most of the researches addressed in the literature review, made use of linear and symmetric assumptions and as such all factors affecting the model are not put into perspective. Previous studies have focused majorly on the symmetric relationship between the selected variables. Hence, the aim of this paper is to analyze the symmetric and asymmetric relationship between ecological footprint, economic uncertainty and foreign direct investment. Firstly, to address the gap in the literature, this research goes further and above the traditional linear models. This paper uses non-linear Autoregressive distributed Lag model to check for long and short run asymmetric relationship between ecological footprint, economic uncertainty and foreign direct investment. NARDL model decomposes the regressors into their positive and negative shocks. NARDL estimator determines whether the FDI inflows react to only positive shocks, only negative shocks of the regressors or both. Also, the nonlinear methodology used helps determine the existence of hidden cointegration and asymmetry in the data that are ignored in linear models. While, ARDL model is used to determine the symmetric relationship between the selected variables in the short and long run.
Secondly, previous researches on the subject matter have not considered the combined effect of environmental and economic factors on FDI inflows in South Africa. In the existing literature, some researchers have analyzed the relationship between FDI and only environmental variables (Baloch et al., 2019; Demena & Afesorgbor, 2020; Hanif et al., 2019; Muhammad et al., 2020) or only economic variables (Ahmad et al., 2019; Anser et al., 2021; Lee & Brahmasrene, 2020; Nguyen, 2017; Qamruzzaman et al., 2019). Hence, this research will be focused on investigating into the combined effect of environmental and economic variables on FDI inflows into South Africa. Their individual and collective impact on foreign direct investment in the country would be analyzed.
Thirdly, there are limited researches done relating to the subject matter in South Africa. This paper will be centered on South Africa to find out the association between ecological footprint and economic uncertainty and FDI inflows in the country.
Philosophy of Variables Selection
A number of financial, economic and environmental variables are inculcated into this research to establish the relationship with foreign direct investment in South Africa. Ecological footprint and bio-capacity are used as a measure for environmental degradation. Economic uncertainty is measured with the use of official exchange rate levels taking into account existing volatility. Foreign direct investment as the primary and dependent variable in this study is expressed as per capita. Data on all the variables in this study are collected on a monthly basis. Ecological footprint and Bio-capacity data is withdrawn from the National footprint Accounts enlisted in the Global footprint network (see Note 1). Time series data collected is centered on the period from 1996 to 2017, due to the limited data for Ecological footprint and Bio-capacity.
Foreign direct Investment is measured by net inflows BOP foreign direct investment. FDI is the primary and dependent variable in this study. Its data is extracted from the World Bank Indicators. FDI is used to compare against the environmental pollution and degradation to see its relationship. Also, FDI helps show the condition of one country’s businesses in trading with other countries using an accepted exchange rate (Liu & Kim, 2018). Ecological footprint as an indicator of environmental degradation will be focused on in this study. The concept of ecological footprint as an adequate environmental measure was introduced in 1996 by Wackernagel and Ross. Ecological footprint refers to the area of productive land including aquatic ecosystems requires to yield resources consumed by a specific population (Wang, Kang et al., 2013). Ecological footprint is measured in global hectare per capita which is the sum of bio productive land and water accessible to each person in the globe.
Another independent variable compared evaluated against FDI in this study is Economic uncertainty. It is represented by exchange rate of the country in this study. Official exchange rate is used as a proxy for economic uncertainty in other studies which includes that of Mariadas et al. (2021), Eregha (2019), and Qamruzzaman et al. (2019). Exchange rates are the comparative prices of purchasable to non-purchasable goods. They measure the competitiveness between different countries by taking into account comparative prices, costs and productivity between various countries (Auboin & Ruta, 2011). The fluctuation and volatility of exchange rates results in high economic uncertainty for international investors.
Furthermore, biocapacity is introduced as a controlling variable to ensure robustness of the model. It measures the forest lands, grazing lands, cropland, fishing grounds and built up lands as assets or natural resources of a country and how they are used to provide renewable resources and services (Mancini et al., 2018). Bio capacity weighs the ability of a particular environment to produce resources over a period of time (Borucke et al., 2013). It is measured against FDI to check if and how the two variables interact.
Methodology
The methods of analysis carried out in this research include unit root tests in Table 1, linear and nonlinear autoregressive distributed lag estimators. The unit root tests helped to identify the variables among the selected variables of this study that were integrated at different levels. With time series, a test of stationarity is a vital step that should be carried out on data. The unit root tests involved in this study are Augmented Dickey fuller Kwiatkowski Phillips-Schmidt-Shin (KPSS). In relation to maximum lag applied in the study, optimal lag was conducted with the use of Akaike Information Criterion (AIC). Unit root tests are carried out on all variables in order to avoid integration between two or greater than two (Qamruzzaman et al., 2019).
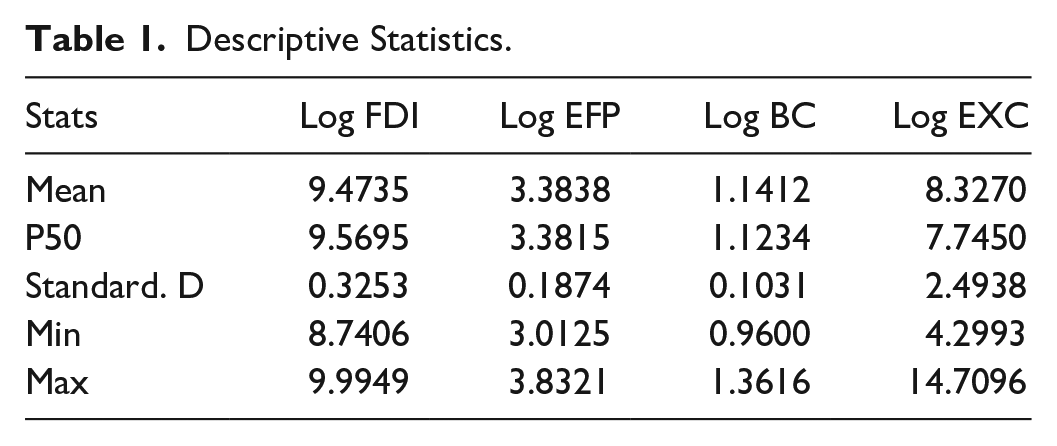
Descriptive Statistics.
Nonlinear Autoregressive distributed lag was used to test for nonlinear relationship in the long and short run among the variables (Shin et al., 2014). The NARDL estimator ensures the disintegration of FDI, ecological footprint, exchange rate and bio capacity into their matching positive and negative shocks. The benefit of the NARDL model over the symmetrical ARDL estimator is the decomposition of both the dependent and influencing variables. NARDL can be used when some variables are stationary at level while some other variables are stationary at first difference. NARDL model supports order I(0) and I(1) series and as such that guides the decision to use the Augmented Dickey fuller (ADF), and Kwiatkowsky-Phillips-Schmidt-Skin (Perron, 1989) to check for stationarity.
The bounds tests were applied in this study to determine the nonlinear cointegration and dependencies between the selected variables. Bounds test also helps to determine whether the time series are independently dispersed or linearly dispersed. The asymmetric dynamic multiplier reveals the long run and short run relationship between the selected variables graphically (Majeed et al., 2020). In this study, the asymmetric dynamic multipliers capture the impact of increase and decrease in the dependent variables on FDI.
However, the symmetric Autoregressive Distributed lag (ARDL) helps in establishing the linear long term relationship between the regressors with different levels or orders of integration. ARDL model was based on the research of Pesaran and Shin (1998) and Pesaran et al. (2001). Also, with this econometric methodology, the estimation is based on a single equation which allows for maximum number of lags (Ghosh & Kanjilal, 2014). It calculates the long run and short run relationship between regressors at the same time (Wen et al., 2019). Nevertheless, due to the nonlinear relationship that exists between the variables, the asymmetric or nonlinear autoregressive distributed lag is used. Linear and nonlinear cointegration relationships were calculated with the use of Bound and F statistics tests. Nonlinear cointegration was indicated in the short run and in the long run.
Model Specification
Based on previous literature reviewed, the model of this study was structured to investigate the impact of economic uncertainty, ecological footprint and bio capacity on foreign direct investment in South Africa. This research model is based on the framework posited by Chipalkatti et al. (2021) which also guided the research of Dornean et al. (2021). Their model includes the impact of environmental, governance, and macroeconomic factors on FDI inflows. However, Chipalkatti et al. (2021) and Dornean et al. (2021) employed CO2 emissions as a measure for environmental sustainability factor. Our model is expanded to include ecological footprint and biocapacity as environmental factors as they have proven to be adequate measure of environmental degradation (Ahmed et al., 2020; Baloch et al., 2019; Chowdhury et al., 2021). While exchange rate is incorporated into the model as an economic factor that indicates economic stability or uncertainty and is vital in determining the amount of returns from investments in the host country. The model helps to determine whether environmental sustainability and economic stability can be used to attract FDI inflows into the host country. The model is developed as follows:

Where, FDI is foreign direct investment, βo is the constant, βEFP equals exchange rate, βEXC indicates exchange rate, βBC refers to bio capacity, and ɛ is the error term.
Equation (1) can be modified under the NARDL thereby extending it to an asymmetric long run equation. Due to nonlinearities in time series the model is expanded to give room for asymmetric relationships. In situations where time series are cointegrated asymmetries and structural breaks may be existent in the data (Granger & Yoon, 2002). The asymmetric NADRL model incorporated in the extended version of ARDL models is stated as follow;

where β+ and β− represent the related long-run parameters. The asymmetric NARDL model applies the decomposition of the exogenous variables into negative and positive partial sums for decreases and increases. The asymmetric effect of the variables by positive changes as
And it is expanded into the following formulas:

Equation (2) can be written in unrestricted error correction form proposed by Pesaran et al. (2001) and Shin et al. (2011)
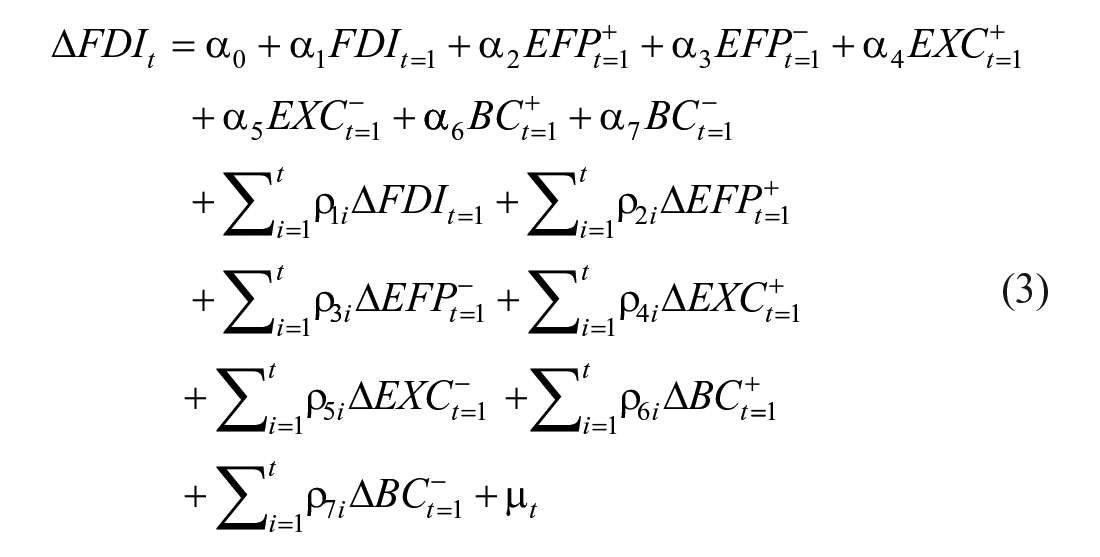
Equation (3) provides for the inclusion of short and long run coefficients in an error correction model. The short run coefficients are represented by ∆ variables. And the long run variables are α variables. This equation is based on the NARDL model and assumes asymmetric relationship between the variables.
Empirical Findings and Discussion
Variables included in this study were tested in line with the null hypothesis of non-stationary with the use of unit root tests. The output of the unit root tests is reported in Table 2 which indicates that the null hypothesis is accepted at first difference. This indicates that the variables are integrated at level. Both the ADF and KPSS test indicate that the variables are stationary after they converted to first difference. Based on the tests being stationary, a cointegration tests to check for linear and nonlinear assumptions existent in the variables is carried out.
Unit Root Tests.

Note. *** and ** denote significant at 1% and 5%, respectively. The constant and time trend are included in level, but time trend is removed in first difference equations. The optimal lag order is selected based on SIC in the ADF test equation.
Table 3 shows the findings of the bounds test for linear and non-linear specifications. It shows that for the linear form there is no cointegration as the F statistics of 3.739 is less than the upper bound figure. This research finding implies that there is no linear relationship between exchange rate and FDI which supports the findings of Lee and Brahmasrene (2020) in the short run. However, co integration exists in the non-linear form with the data used in this study because F statistic of 6.4529 is greater than the upper bound figure at 5 percent critical level. Based on these findings, we can apply linear and Non-linear ARDL model.
Bounds Test for Linear/Nonlinear Cointegration.

Note. The critical values are from Narayan (2005) case III 5% significance level. The optimal lag order based on AIC.
The data is first analyzed with the use of ARDL model which is illustrated in Table 4. The error correction term is negative and significant in the short run linear ARDL Model. This indicates a significant relationship between FDI, ecological footprint, biocapacity and exchange rate in the short run. The results show that there is a positive relationship between FDI and ecological footprint which supports the findings of Baloch et al. (2019), Chowdhury et al. (2021). This findings support the existence of pollution haven hypothesis in South Africa (Doytch, 2020). This finding implies South Africa is not ensuring the inflow of only clean and environmentally friendly investments. However, long run linear ARDL model supports the linear bounds table that shows no cointegration and as such no significant connection among the variables in the long-run.
Short Run Linear ARDL Model.

Note. ***, ** and * denote significant at 1%, 5%, and 10% respectively. The lag order is between (), the standard errors are between [ ].
The short run NARDL results show a significant nonlinear relationship between FDI and the independent variables. The change in ecological footprint and biocapacity is positively influencing FDI. The NARDL model helps to check the reaction of FDI to increase and decrease in ecological footprint, exchange rate and bio capacity. In the short run, the results show that foreign direct investment increases at a significant level when ecological footprint increases which is line with findings of Baloch et al. (2019), Chowdhury et al. (2021), and Hanif et al. (2019). However, as exchange rate increases FDI reduces tis is line with Qamruzzaman et al. (2019). In terms of natural resources used, foreign direct investment responds positively to changes in bio capacity which supports the findings of Doytch (2020). Table 5 showed that FDI significantly reacts to changes in ecological footprint and exchange rate. It showed that a 1% increase in EFP would lead to 0.123% increase in FDI. Also, when Exchange rate increases by 1% FDI fall by −0.0048%.
Short Run Non-linear ARDL Model.

Note. *** and ** denote significant at 1% and 5%, respectively. The lag order is between ( ), the standard errors are between [ ].
Diagnostic tests were run to determine the adequacy of the model. The results show that the model has no serial correlation, autocorrelation and parameter instability in line with the assumptions of Shin et al. (2014). The R square value of .9875 indicates that the independent variables explain majority of the changes in the dependent variables. Heteroskedasticity (

CUSUM test.
Table 6: The results indicate the positive response of foreign direct investment to positive changes in ecological footprint and bio capacity in the long run this findings supports the findings of Baloch et al. (2019), Chowdhury et al. (2021), and Doytch (2020). This implies that increase in ecological footprint and bio capacity results in increases FDI. Also the results indicated that increase in exchange rate leads to increase in FDI this is in line with Khatabi et al. (2020). The findings of the study reveals that 1% increase in ecological footprint will lead to increase in FDI by 4.073% and a decline in EF by 1% would lead to a decline in FDI by 1.45%. The study results show that 1% rise in bio-capacity will lead to a 227.953% increase in FDI. While a reduction in bio capacity by 1% would lead to a decrease in FDI by 211.416%.
Long Run Model.

Note. ***, **, and * denote significant at 1%, 5%, and 10%, respectively. The F-test are between [ ].
However, the results also show that when exchange rate reduces FDI increases in the long-run this findings support the findings of Ahmad et al. (2019), Lee and Brahmasrene (2020), and Qamruzzaman et al. (2019). A decline in exchange rate by 1% would lead to an increase in FDI by 0.14%. The findings also indicate that decrease in ecological footprint and biocapacity leads to decrease in FDI. This shows that foreign direct investments in South Africa have short and long run asymmetry in relation to exchange rate, ecological footprint and bio capacity. Furthermore, the findings reveal a positive association between ecological footprint, biocapacity and FDI in line with the findings of Baloch et al. (2019), Chowdhury et al. (2021), Doytch (2020), Hanif et al. (2019). Table 7 indicates that the significant existence of long run asymmetry of the independent variables toward foreign direct investment. And as such non-linear ARDL is most suitable in capturing the relationship between the variables than traditional linear models.
Asymmetry Statistics.
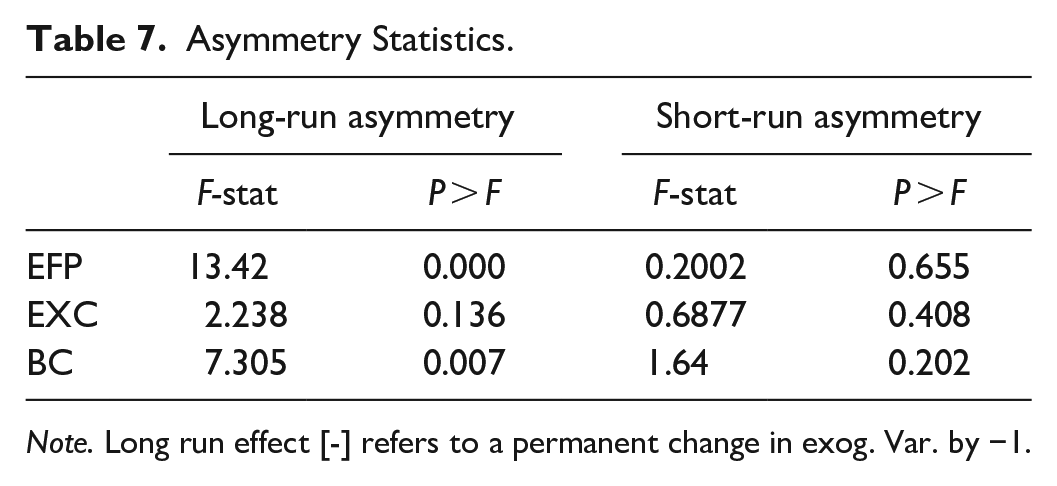
Note. Long run effect [-] refers to a permanent change in exog. Var. by −1.
Asymmetric dynamic multipliers were used to illustrate the reaction of FDI to positive and negative changes in ecological footprint, exchange rate and bio capacity. Figures 2 to 4 indicates the cumulative effects of positive and negative shocks to ecological footprint, exchange rate and bio capacity on FDI. It shows how FDI reacts to long run equilibrium as a result of positive and negative changes in the independent variables. The dotted black line represents the negative shock, the continuous black line represents the positive shock and the dotted red lines represent the asymmetric line. Figure 2 shows that the effect of the cumulative positive and negative shocks to ecological footprint on FDI is positive and significant. This indicates that the effect of a positive shock in ecological footprint outweighs the effect of a negative shock on ecological footprint on FDI.

Multiplier impact of ecological footprint increase.
Also, Figure 3 shows that the effect of the cumulative positive and negative shocks to exchange rate on FDI is positive and significant. The multiplier graph shows that the positive shock in EXC would lead to an increase in FDI but at a different speed. This also occurs when there is negative shock on exchange rate. This suggests that fluctuation in exchange rate helps in improving FDI inflows to South Africa.
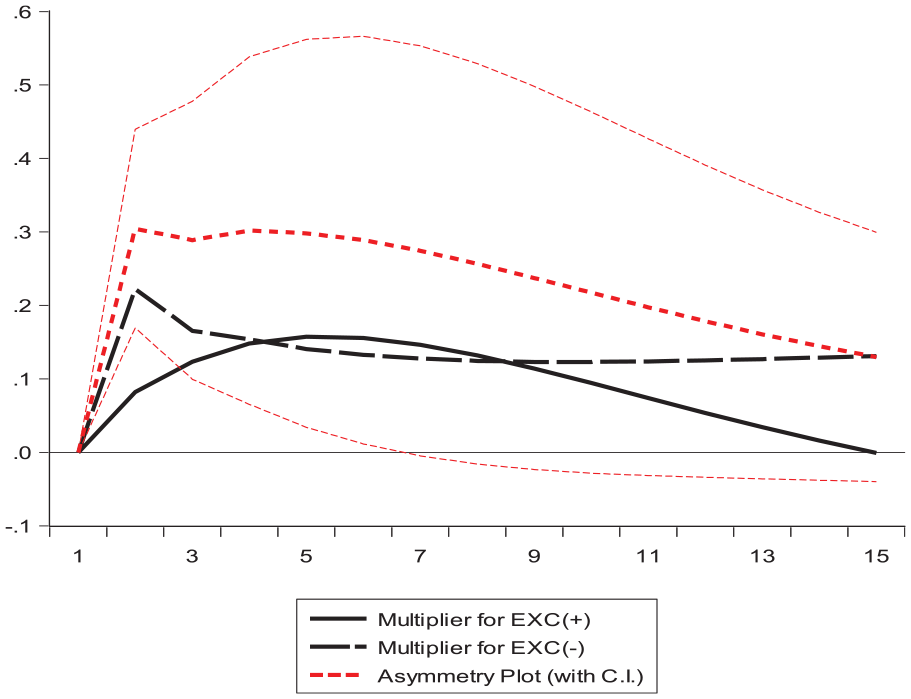
Multiplier impact of exchange increase.
While Figure 4 shows that the effect of the cumulative positive and negative shocks to bio capacity on FDI is negative with an increasing trend. The rising trend in bio capacity indicates significant work of South Africa on its Bio capacity. However, it also indicates a high percentage of ecological deficits where bio capacity is less than the ecological footprint in South Africa. This result also supports the finding in the Table 6 long run table where a decrease in bio capacity by 1% would result in a 211.416 increase in FDI.

Multiplier impact of bio capacity increase.
Conclusion and Policy Implications
This paper attempts to analyze the relationship between foreign direct investment, ecological footprint, exchange rate and biocapacity in South Africa. Monthly observations from 1996M01 to 2017M12 are analyzed using Asymmetric dynamic multiplier, linear and nonlinear ARDL models. This research has some important findings. The research findings indicated that ecological footprint, exchange rate and bio capacity have significant short-run and long-run effects on foreign direct investment in South Africa. Also, we found that exchange rates, ecological footprint and bio capacity movements asymmetrically affect foreign direct investment. Where changes of foreign direct investment are responding significantly to increase and decrease in all independent variables. These asymmetric effects occur between short-run and long-run dynamics within the same NARDL specification.
Findings also show that there exists a positive relationship between FDI and changes in environmental pollution, biocapacity which supports the findings Doytch (2020), Chowdhury et al. (2021), Baloch et al. (2019), and Hanif et al. (2019). Findings of this study using the asymmetric dynamic multiplier indicate that negative and positive shocks on ecological footprint and biocapacity results in positive changes in FDI. This might be due to the ecological deficit in South Africa. In the sense that the demand of goods and services from the country exceeds what its natural resources including land and seas can produce (see Note 6). This implies that South African ecological footprint exceeds its bio capacity.
Based on the research findings, the ecological deficit in South Africa leads to a decrease in FDI inflows. The existent ecological deficit results in high levels of ecological footprint, emission and pollution in the country. Which in turn has a positive relationship with FDI this supports the findings of Doytch (2020). Hence, in order to attract more FDI inflows, the excessive exploitation of natural resources should be regulated and minimized to aid in ensuring a sustainable environment. According to the theory of Eskeland and Harrison (2003) foreign investors are more concerned and protective about the environment they invest in than domestic investors. This theory can help in explaining the decline in FDI inflows in South Africa. FDI inflows that are environmentally conducive are more acceptable and encouraged by countries (Golub et al., 2011). In addition, Countries with sustainable environment and eco-friendly, clean production activities attract more inflows of FDI (Dornean et al., 2021).
In the long run, a negative relationship was found between exchange rate and FDI which supports the findings of Ahmad et al. (2019), Qamruzzaman et al. (2019), Tan et al. (2021), and Lee and Brahmasrene (2020). These finding indicates that as the domestic currency depreciates against foreign currencies, FDI increases in South Africa and also environmental degradation. Furthermore, the flow oriented model can be used to explain the research findings of this study, which implies that exchange rate depreciation in the host country attracts FDI inflows due to high earnings and business profits for foreign investors (Kumar, 2013). One possible reason of the positive effect of exchange rate volatility is that South Africa has witnessed a fall in currency value against the dollar by over 40% from 2001 to 2016 (Fowkes et al., 2016). This could motivate foreign investors’ decision leading to high FDI inflows to South Africa.
However, one of the limitations to this study includes unavailability of ecological footprint and bio capacity data. The data on these environmental variables are calculated and updated in a lagged manner from the data source. As such current year data are not accessible to be analyzed. However, monthly data from 1996 to 2017 are analyzed to get a good picture of the relationship between the variables. Also, ARDL and nonlinear ARDL approaches are limited to estimating four variables and as such other influencing variables are not accounted for. This limitation gives room for further research where other influencing variables are added to the model.
In terms of policy making, the research results help policy makers to understand the impact and pressure of human activities on the environment and its relationship with FDI inflows in South Africa. Therefore, Policies that aid in ensuring increase in waste absorptive and regenerative capacity in South Africa should be put in place to ensure a viable environment for increase in FDI inflows. Policy regulations on production procedures in South Africa should be established to encourage advanced clean technologies in FDI production sectors. Policies that impose high taxes on sectors that are major contributors to environmental degradation should be established while lesser taxes on sectors with cleaner technologies should be encouraged. And policies should be put in place to reinvest FDI generated funds back into the environment to improve environmental quality which will in turn attract more FDI inflows.
Policy makers should put in place strict guidelines and measures that sustain a healthy and standardized environment this will help attract large amounts of environmentally friendly investments into South Africa. To ensure a sustainable ecological footprint while promoting foreign direct investments, authorized FDI inflows to the country should be narrowed down to resourceful technologies and innovative land use. Policies that minimize the emissions, effects of production and mining activities should be established in order to solve the problem of ecological deficit in South Africa.
Also, this research indicates that fluctuations in exchange rate is strongly associated with uncertainty due to its unpredictable nature. As such greater emphasis and research focus should be directed toward the influence of exchange rate on foreign direct investment with the use of different econometric methodology. Hence, policies should be established to stabilize exchange rate in South Africa. Policy makers in South Africa are recommended to be more cautious with Policies in relation to exchange rate or currency rate to promote a stable economy. Such that, policy changes should be implemented gradually so as to avoid structural breaks in the economy.
Future studies in the FDI-environment nexus, can consider the detection of non-linear relationship in this study as a guideline in developing their research path. In analyzing the interaction between FDI inflows, environmental factors and macroeconomic variables, it is recommended to incorporate measures that aid in identifying the existence of non-linear relationship. For better model specifications and broader perspective, prospective studies in this field of study should utilize non-linear as well as traditional linear models in determining significant relationships. The existence of non-linearity in our findings can also explain the differences and contradictions in results by previous researchers. The asymmetric relationship in the long run and short run between the variables might settle the difference in findings.
Footnotes
Declaration of Conflicting Interests
The author(s) declared no potential conflicts of interest with respect to the research, authorship, and/or publication of this article.
Funding
The author(s) received no financial support for the research, authorship, and/or publication of this article.
Data Availability Statement
Data derived from public domain resources: the data that support the findings of this study are available in [International Monetary Fund (IMF) and Global Footprint Network] at [https://www.imf.org/en/Data and ![]() ]. These data were derived from the following resources available in the public domain: [International Monetary Fund (IMF) https://www.imf.org/en/Data and Global Footprint Network https://data.footprintnetwork.org/#/].
]. These data were derived from the following resources available in the public domain: [International Monetary Fund (IMF) https://www.imf.org/en/Data and Global Footprint Network https://data.footprintnetwork.org/#/].