
Abstract
Corruption in the host nation is a key issue influencing foreign direct investment. Most existing studies use the expert-knowledge-based corruption index as a proxy for corruption. However, the validity of these published corruption indexes is often questioned by scholars and experts. By introducing Internet data to evaluate public corruption awareness levels, this paper uses two different corruption proxy variables to investigate the relationship between host country corruption and China’s OFDI. In addition, these relationships are further compared between the Belt and Road (B&R) countries and non-B&R countries. The empirical results show that there are negative correlations between host country corruption and China’s OFDI flow for the whole sample, B&R countries and non-B&R countries. The empirical results of this paper serve as a reference for Chinese enterprises to make overseas investment decisions.
Keywords
Introduction
As the most stable form of foreign investment, outward foreign direct investment (OFDI) has become an essential economic strategy that benefits both the host country and investing country (Qian & Sandoval-Hernandez, 2016). Many factors, including market potential, natural resource, and political risk are considered when multinational enterprises make investment location choices (Qian & Sandoval-Hernandez, 2016; Suo et al., 2019). Among the factors, corruption in host countries has been widely scrutinized since it will indirectly affect a company’s operating profits (Qian & Sandoval-Hernandez, 2016). Corruption is considered a serious social phenomenon that affects economic and political development and leads to the loss of honest competitors, the erosion of social trust, and increased inequality and poverty (Canache & Allison, 2005; Huang, 2016). Studying the effects of host country corruption on OFDI has specific practical significance. This research can not only help multinational companies make scientific investment decisions, but it can also reduce the barriers for enterprises to enter and adapt to a host country market later.
Although there exists abundant literature on corruption and OFDI, the findings are inconclusive. Since the 1990s, numerous studies have explored the effects of corruption on OFDI theoretically and empirically. However, the “grabbing hand” and “helping hand” theories were developed at the same time. With different research objects, time ranges, and research models, empirical studies have also achieved various results (Beck & Maher, 1986; Habib & Zurawicki, 2002; Lui, 1985; Perez et al., 2012; Personal et al., 2011). The defect of measuring corruption is considered one of the reasons why relevant empirical researches fail to reach a consensus (Han & Xue, 2008). The representative corruption measures are the corruption indexes published by international organizations. However, expert knowledge is overrepresented in the evaluation process of these published indexes (Chabova, 2017). The results of these published indexes are always questioned in terms of their explanatory power (Donchev & Ujhelyi, 2014).
To fill in the research gap, a novel corruption index will be constructed based on objective data to explore the relationship between corruption and OFDI. The development of the Internet makes corruption-related information available to the public. As argued by Goel et al. (2012), everyone in the world may search for corruption scandals on the Internet, and the search information indicates the public’s awareness of the corruption level. Given that search results may vary in different search engines, this paper adopts Google Trends as the data source, in view of the worldwide popularity of the Google search engine. Moreover, the Google trends data are normalized by calculating the total search volume over geographic and time horizons to reduce the biases in different countries and time durations.
For the empirical study, this paper focuses on China’s OFDI. Chinese government proposed the Belt and Road Initiative (BRI) in 2013 to strengthen the trade and economic cooperation with countries along the Belt and Road (Liu et al., 2017). Since then, the scale of Chinese enterprises’ investment has been constantly rising in B&R countries (Shao, 2020). However, according to the Transparency International (Puiu, 2021), the average score of corruption perception index (CPI) for B&R countries is lower than the global average score, which may indicate a higher corruption level. While higher corruption risks may exist in B&R countries, these countries can also promise a favorable investment environment by joining the BRI (Shao, 2020). Due to these interactive effects, the impact of corruption on China’s OFDI in B&R countries may possibly be different from that in non-B&R countries.
Based on the above analysis, this paper aims to investigate the impact of host country corruption (based on expert knowledge or public awareness) on China’s OFDI considering the effect of BRI. Its contributions manifest in two aspects. First, we construct the public corruption awareness (CA) index based on web search data and further explore the impact of corruption on China’s OFDI from the perspectives of expert knowledge and public awareness. Second, in the context of the BRI, this paper compares the differences in the effects of corruption on China’s OFDI between B&R countries and non-B&R countries.
The rest of this paper is structured as follows. Following the introduction, section 2 reviews the relevant literature. Section 3 introduces the model construction. Section 4 displays the empirical results and conducts the robustness test. Section 5 discusses the results, and the last section provides conclusions and future work.
Literature Review
Influencing Factors of OFDI
The influencing factors of transnational enterprises’ OFDI decisions are complicated and studied from multiple dimensions. Based on the eclectic theory of international production, Dunning (1998) comprehensively divides the motivation of foreign investment into four types: “market seeking,”“resource seeking,”“strategy seeking,” and “efficiency seeking.” Based on this framework, a collection of papers have identified various factors that determine OFDI, including market size, natural resource endowment, the quality of institution, and other factors (Blonigen, 2005). The representative papers are summarized in Table 1.
Selected Papers Concerning the Influencing Factors of OFDI.

As presented in Table 1, corruption is also considered a key influencing factor of OFDI (Belgibayeva & Plekhanov, 2019). Some articles list corruption as a direct determinant of OFDI (Cezar & Escobar, 2015; Lucke & Eichler, 2016; Wheeler & Mody, 1992), while others take corruption as a component of political condition or political risk (Cleeve et al., 2015; Liu et al., 2017; Uddin et al., 2019; Vivoda, 2011).
The Effect of Corruption on OFDI
The study of corruption in international business has gained prominence as firms engaged in the transnational investment business. These excellent papers have provided a good foundation for our research. For example, Godinez and Liu (2015) study the influence of corruption distance between the host country and investing country. Stevens and Newenham-Kahindi (2021) analyze multinational companies’ strategies for managing corruption, including avoidance, acquiescence, and engagement, when investing in more corrupt countries. Rabbiosi and Santangelo (2019) study the role of subsidiary autonomy in reducing corruption-related costs. They contribute to the research on corruption and OFDI by innovatively focusing on MNEs’ organizational structure. Bahoo et al. (2020) study the research on corruption in international business from 1992 to 2019 and indicate that the effect of corruption on OFDI is an important research stream that is at the stage of fact-finding and evaluation.
With different empirical objects, control variables, data sources, and econometric models, related articles obtain multiple conclusions concerning how corruption influences OFDI. The representative papers are listed in Table 2. Most of the articles choose the corruption indexes published by international institutions as the proxy variable of corruption. A few articles adopt the case-counting method. For example, Zakharov (2019) measures corruption in Russian regions using registered bribery cases and public corruption experiences. In addition, Mudambi et al. (2013), Brada et al. (2019), and Canare (2017) conclude that corruption is negatively connected with OFDI while the empirical results of Bellos and Subasat (2012) show that a high level of corruption in the host country is associated with a high level of OFDI. Besides, Jalil et al. (2016) and Gossel (2018) point out that the connection between corruption and OFDI varies from country to country.
Representative Papers Concerning Corruption and OFDI.

Note. OLS indicates Ordinary Least Squares, RE signifies Random Effects, FE denotes Fixed Effects, 2SLS represents 2-Stage Least Squares, PMG indicates Pooled Mean Group, MG represents Mean Group, DFE represents Dynamic Fixed Effects, GMM is the Generalized Method of Moments, and EFI represents Economic Freedom Index. CPI denotes the corruption perception index.
Corruption Measurement
Measurement has always been a basic research topic in corruption-related studies (Heywood, 1997). Due to information asymmetry, corruption is difficult to accurately measure (Treisman, 2000). In the existing literature, two commonly used methods are subjective investigation and statistical analysis of corruption cases (Svensson, 2005). Among the previous studies, Lisciandra and Millemaci (2017), Glaeser and Saks (2004), and Dong and Torgler (2013) take the number of reported corruption cases as a proxy variable for actual corruption level. However, the number of cases mainly demonstrates the effectiveness of anti-corruption work, which cannot directly reflect the actual levels of corruption (Svensson, 2005).
Compared with the case-counting method, the corruption indexes published by organizations are more popular for measuring the level of corruption. The two most widely used indexes are the corruption perception index (CPI) from Transparency International and the control of corruption (CC) from the World Bank. The two indexes both use questionnaires or interviews to understand people’s evaluations of corruption, and thus these indexes can be called “subjective indicators” (Svensson, 2005). However, investigators usually evaluate the corruption level in a country based on their prior knowledge, and such subjective bias may reduce the internal validity (Donchev & Ujhelyi, 2014). Besides, experts evaluate the level of corruption using previous records or data, which may induce a time lag between the evaluation results and real corruption situations (Chabova, 2017; Treisman, 2000). In recent years, scholars have sought more objective and public perception-based data sources to measure corruption. Chabova (2017) summarizes Europe’s public opinion surveys published by institutions to collect people’s direct corruption experience or their views on the prevalence of corruption. However, these investigations are conducted in limited countries and regions due to their high costs.
This paper explores corruption from a new perspective, namely, public corruption awareness, which can be measured based on Google Trends data. As Internet usage continues to grow, recorded data on web search behavior is considered a good information source for public search interests investigation. For example, Rousseau and Deschacht (2020) use Google Trends data to measure public awareness of nature and the environment. Nghiem et al. (2016) measure the public interest in conservation with Google search volume data. Elshendy et al. (2018) argue that Google Trends data has wide tracking and real-time surveillance abilities and is a signal of public economic awareness.
In the case of corruption, there have been attempts to study public corruption awareness using online search information. Goel et al. (2012) argue that the Internet provides evidence specific to corruption, and the popularity of searching corruption on the Internet reflects the public corruption perception. Bologna (2014) also proves the correlation between the corruption search interest on the Internet and the actual level of corruption. Corruption awareness can be understood in terms of demand and supply: the public has a search demand for corruption information; and corruption information can be supplied by websites including personal homepages, news reports, government and court documents, etc. (Andersen et al., 2008). People’s Internet search interests may be an effective way to represent the public corruption awareness in a certain region.
Compared with corruption indexes from rating agencies, public corruption awareness derived from Internet data has certain characteristics. First, the data is generated from the statistics for all Internet searches, reflecting public corruption awareness rather than expert knowledge (Park & Kim, 2018). Second, the public corruption awareness index is based on a record of public search behavior without any political bias or personal preferences. Third, Internet search data can be obtained and updated in real-time for countries and cities. Therefore, this paper constructs the public corruption awareness (CA) index based on online search data and analyzes the impact of corruption on China’s OFDI using the corruption proxy indexes.
There have been some debates in previous studies on the relationship between public corruption awareness and actual levels of corruption. A high public corruption awareness may demonstrate the public’s high understanding of their rights and willingness to report corruption events (Goel et al., 2012), whereas it may also indicate a high corruption level that has aroused the public’s attention (Graycar, 2014). This paper agrees with the latter opinion, which considers the amount of Internet searches as an indicator of the actual corruption level, that is, a higher level of public corruption awareness means more people have experienced or perceived corruption in one country. In addition, in the subsequent empirical analysis, we also verify this argument by finding a positive correlation between public corruption awareness and the expert-judged corruption level.
Hypotheses Formulation
In this paper, we further develop the “grabbing hand” and “helping hand” hypotheses and examine the effects of corruption on China’s OFDI using expert judgment of corruption levels and public corruption awareness. This paper argues that the expert judgment of corruption levels reflects experts’ views on the degree of corruption in a region. The “grabbing hand” theory thinks of corruption as a tax (Shleifer & Vishny, 1993; Wei, 1997). For multinational companies, managing bribery requires both human and financial resources which might increase profits if they were invested in other uses (Cuervo-Cazurra, 2008; Kaufmann, 1997). Thus, if a country is judged by experts to be highly corrupt, it may be unattractive to multinational investors because of the high sunk costs and uncertain returns due to corruption (Habib & Zurawicki, 2002; Qian & Sandoval-Hernandez, 2016). The hypothesis is therefore as follows:
Hypothesis 1a: Expert judgment of a higher level of corruption in the host country is associated with a lower level of China’s OFDI.
However, the “helping hand” theory argues that foreign investors may face administrative controls or complex approval processes when entering a foreign market. Under this situation, bribery can help to reduce the time and effort taken to enter the host country’s market and increase investment efficiency (Egger & Winner, 2005). Therefore, an expert judgment of high levels of corruption in host countries may be attractive to foreign investors who believe that bribery may help improve investment efficiency. We, therefore, propose the following:
Hypothesis 1b: Expert judgment of a higher level of corruption in the host country is associated with a higher level of China’s OFDI.
Besides, the relationship between corruption and OFDI can be more complicated. On the one hand, moderate corruption is conducive to the inflow of OFDI as foreign firms may consider paying bribes to circumvent red tape and inefficient regulations. On the other hand, in host countries where corruption is particularly severe, the costs and operational risk of bribery greatly increase, which reduces the willingness of foreign investors to enter the host country. This results in the following hypothesis:
Hypothesis 1c: There is a non-linear relationship between the experts’ judgment on the level of corruption in the host country and the level of China’s OFDI.
Similarly, the impact of public corruption awareness on China’s OFDI can also be analyzed under this framework. High public corruption awareness in host countries may indicate that corruption is a common phenomenon. International investors are discouraged by the extra costs caused by bribery. The hypothesis is stated as follows:
Hypothesis 2a: Higher public corruption awareness in the host country is associated with a lower level of China’s OFDI.
Besides, a high public corruption awareness means widespread corruption in host countries, which allows transnational enterprises to improve investment by bribing officials. The hypothesis is stated as follows:
Hypothesis 2b: Higher public corruption awareness in the host country will be related to a higher level of China’s OFDI in the host country.
Besides, due to the superposition of the above functions, there may be a nonlinear relationship between public corruption awareness and OFDI. The hypothesis is as follows:
Hypothesis 2c: There is a nonlinear relationship between public corruption awareness in the host country and the level of China’s OFDI.
Besides, the proposal of BRI has promoted economic cooperation between China and B&R countries, which may cause changes in the determinants of China’s OFDI. On the one hand, host countries may refrain from solicitation of bribes to maintain long-term cooperation. On the other hand, both the host countries and the Chinese government will make efforts to promote bilateral investment, and preferential policies such as tax breaks and exemptions can make up for the negative effects of corruption (Shao, 2020). Driven by BRI, the relationship between the corruption level (expert judged or public awareness) and China’s OFDI may also be different. The hypothesis is as follows:
Hypothesis 3: The correlation between host-country corruption (expert judged or public awareness) and the level of China’s OFDI is different between B&R countries and non-B&R countries.
Model Construction
Empirical Specification
Based on a sample linear model, regression analysis captures the significance and degree of the influence of independent variables on the dependent variable. The regression analysis has some disadvantages, including overly strict assumptions, the possibility of spurious regressions, and sensitivity to outliers. Nonetheless, it is still an important method in economic research, and many excellent papers have explored interesting topics using regression methods. For example, Becker et al. (2013) conduct a regress to explore the impact of transfer payments on investment and economic growth. Asher and Novosad (2017) adopt regression analysis to measure the influence of political representatives on the local economy. The regression analysis has also been widely used to explore the influence of corruption on OFDI (Bellos & Subasat, 2012; Gossel, 2018; Jalil et al., 2016; Mudambi et al., 2013; Zakharov, 2019).
Therefore, this paper adopts panel regressions to check the impact of corruption on China’s OFDI, as displayed in equation (1):
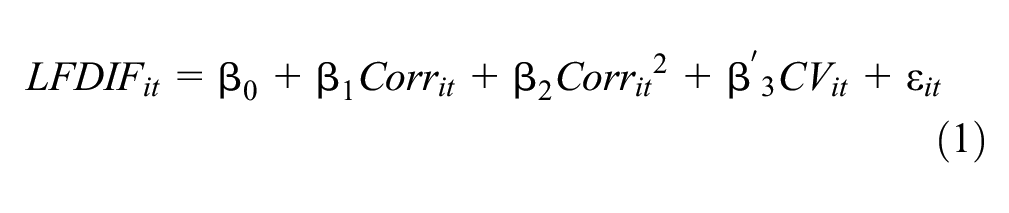
where the LFDIF from China to the host country
Corruption Proxy Variables
Expert knowledge-based corruption index
As for the corruption indexes based on expert knowledge, CPI and CC are the two most popular indexes used to study corruption and its effects on OFDI. Transparency International changed the calculation method in 2012, which makes the CPI scores for the years after 2012 incomparable with those of previous years.
The Worldwide Government Indicators measure the institutional quality of countries with six dimensions (Lucke & Eichler, 2016). Wherein CC reflects the extent of abuse of public power for personal gain. This paper selects CC as the representative expert-knowledge-based corruption index. The original CC score ranges from −2.5 to 2.5, with a higher score corresponding to a lower corruption level in the country. To make the subsequent analysis more intuitive, we adjusted the value of CC by multiplying it by −1, and a higher score of CC means a higher corruption level.
Public corruption awareness index
In this paper, the CA index is constructed based on Google Trends data. The two main functions on the Google Trends homepage are displayed in Figure 1. The “interest over time” module shows the search interest over time. The “interest by region” module demonstrates the search interest by location during the specified time frame.

Search interest in Google Trends: (a) Interest over time and (b) Interest by region.
The impacts of the total search volume and search language have been well handled by Google Trends. Regions with the same search interest for content do not always have the same search volume. Thus, the value of search data is adjusted by dividing the total number of searches for a certain geographic area and time range. Besides, Google Trends provides “Topics,” which addresses the question of the local language search. The topic indicates a group of terms that share the same concept. For example, the “London” topic includes the “capital of the United Kingdom” and London in any language. Therefore, this paper chooses three corruption-related “Topics” to obtain the search popularity. To obtain comparable panel data in time and region dimensions, this paper designs a query strategy in Google Trends as follows (presented in Figure 2).
Step 1: Choosing corruption-related topics. The corruption-related topics “corruption,”“political corruption,” and “bribery” are selected as components of the CA index (Bologna, 2014; Goel et al., 2012).
Step 2: Collecting data comparable between countries. For each topic, we select the cope as worldwide and the period as 1 year and export the data in the “Interest by region” module to obtain the search interest of each topic in each country every year.
Step 3: Adjusting the data to make it comparable from year to year. To ensure the data are comparable among different years, we modified the period setting to 1/1/2005 to 12/31/2017. With 2005 as the base year, the annual adjustment factor is the ratio of the annual search interest to that of the base year. Therefore, the annual search interest value is modified using adjustment factors.
Step 4: Combining results. The Google Trends scores of the three topics are combined using the same weight to construct the CA index.

Query strategy for public corruption awareness.
Variables and Descriptive Statistics
Based on data availability, we identified 80 sample countries. We first distinguished between countries along the Belt and Road and countries that have signed Belt and Road cooperation documents with China. Lists of these two types of countries are available on the Belt and Road official website, which are www.yidaiyilu.gov.cn/jcsjpc.htm and www.yidaiyilu.gov.cn/xwzx/roll/77298.htm.
Of the sample countries, 36 countries are located along the Belt and Road, but India, Israel, and Jordan have not signed Belt and Road cooperation agreements with China, thus we exclude them from B&R countries. We classified the remaining sample countries as non-B&R countries, excluding countries like Mexico due to their remoteness from the Belt and Road. Despite the fact that some of them signed the agreements after 2017, due to the data duration constraints, we still identify them as non-B&R countries. Table 3 lists 82 sample countries including 33 B&R countries and 48 non-B&R countries.
List of Sample Countries.

We use LFDIF, a variable demonstrating China’s OFDI flow in the Statistics Bulletin of China’s Outward Foreign Direct Investment, as the dependent variable (Liu et al., 2017).
As for the control variables, we summarize the influencing factors based on the previous literature. The gross domestic product (GDP) of host countries is used to reflect the market size (Belgibayeva & Plekhanov, 2019). Total natural resources (NR) represent the abundance of natural resources (Cleeve et al., 2015). GDP per capita (PGDP) is treated as a proxy for real wages (Liu et al., 2017). The exchange rate stability (EXR) of the ICRG is chosen to represent economic stability (Liu et al., 2017). In addition, some China-related indicators need to be included in the control variables. The bilateral trade volume (exports and imports, EI) is a reflection of economic closeness.
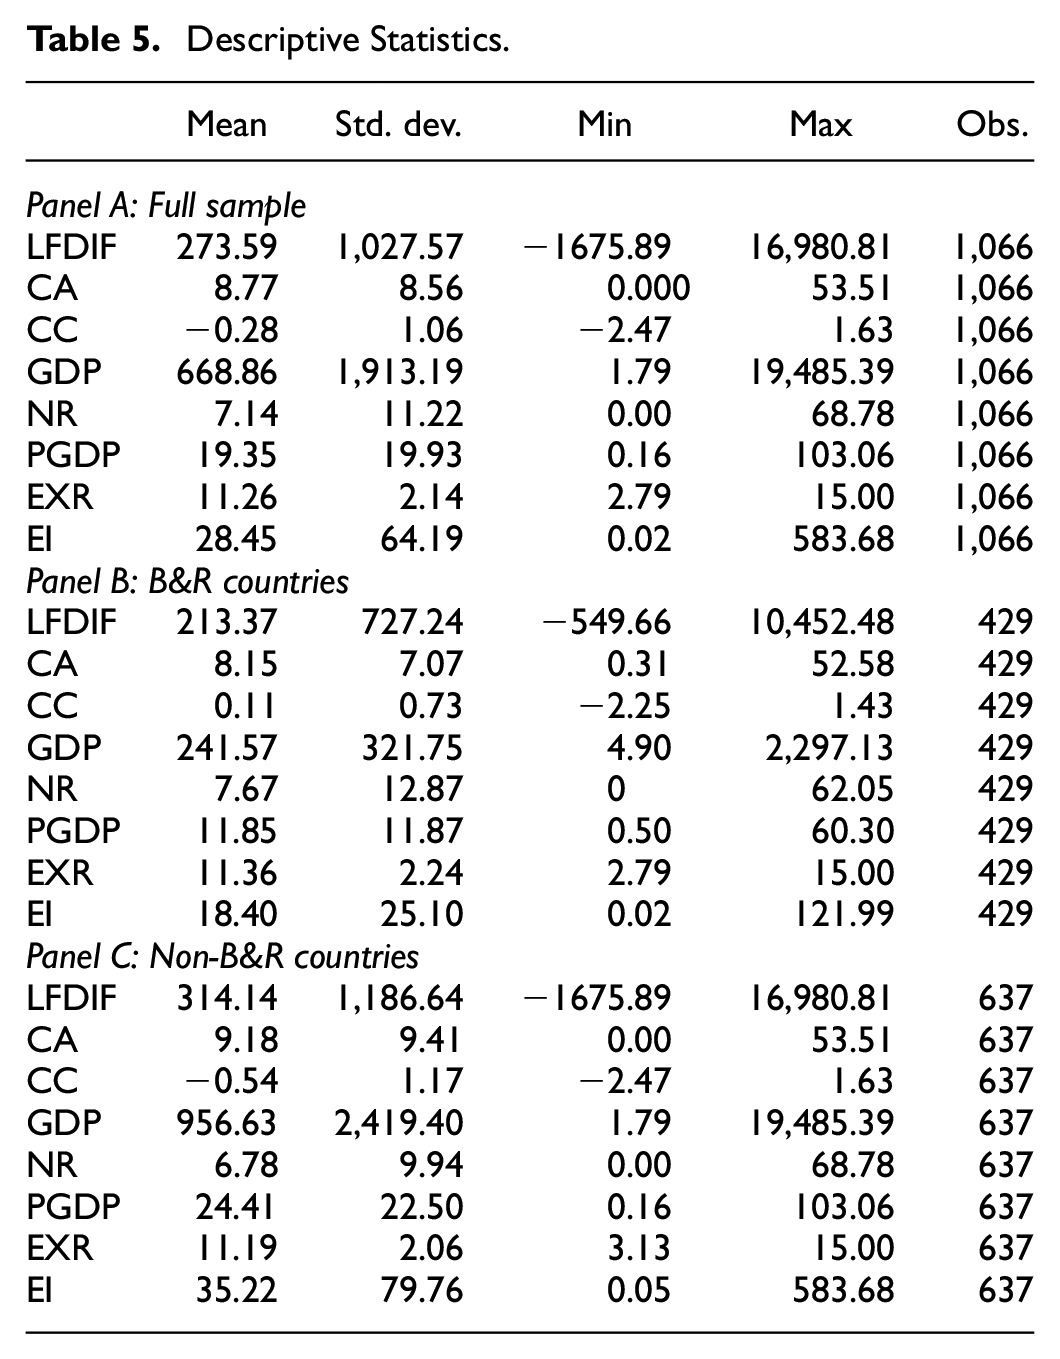
Table 4 summarizes the variables and specifies expected signs of the relationships between control variables and OFDI. In the table, OFDI flow is subjected to a log transformation, represented as LFDIF. Given that many variables contain negative values; no log transform is conducted on the independent variables or control variables. Table 5 shows descriptive statistics of variables.
Summary of Variables.

Descriptive Statistics.
The Pearson correlation coefficient between CC and CA is calculated to preliminarily explore the correlation between public corruption awareness and expert knowledge-based corruption. The results are displayed in Table 6, which demonstrates positive correlations. That is, higher public corruption awareness tends to be associated with a higher expert-judged level of corruption. However, due to the differences in sample countries and periods, the calculation result is inconsistent with the research results of Bologna (2014). This paper only emphasizes the correlation between public corruption awareness and the level of corruption judged by experts, which has been proven to be significant in both this paper and Bologna (2014).
Pearson Correlation Coefficients Between CC and CA.

Empirical Analysis
Empirical Results
The results of the Hausman test reject the null hypothesis for all models, indicating that the fixed-effects model is applicable. To solve the heteroscedasticity problem in the estimation process, we adopt robust standard errors. Table 7 presents the estimation results.
Effects of the Corruption Proxy on LFDIF for the Full Sample, FE GLS.

Note. The t statistics are in parentheses. CC2 and CA2 indicate the squared CC and squared CA, respectively.
p < .1. **p < .05. ***p < .01.
In Model (1), China’s OFDI is regressed on the expert knowledge-based corruption index. The regression coefficient of CC is not significant (
In Model (3), China’s OFDI is regressed on the public corruption awareness. The regression result of CA is significantly negative (
Furthermore, the regression results of control variables in Model (2) and Model (4) are consistent. Wherein, the proxy variables of the market size (GDP) and abundance of natural resource (NR) are positively correlated with China’s OFDI; the regression coefficients of the real wages proxy variable (PGDP) and exchange rate stability (EXR) are not significant, and the coefficient of bilateral trade (EI) is significantly negative.
Table 8 displays the regression results of CC and CA for B&R and non-B&R countries. In Model (1), the regression coefficient of CC and CC2 are both significantly negative. And in model (2), the regression coefficient of CA is significantly negative. These results also reveal that there is a nonlinear relationship between CC and FDI, while the correlation between CA and FDI is negative. The regression results of Model (3) and Model (4) for non-B&R countries are likewise comparable with those of the whole dataset. These results reject hypothesis 3.
Effects of the Corruption Proxy on LFDIF for B&R and Non-B&R Country Samples, FE GLS.

Note. The t statistics are in parentheses. CC2 and CA2 indicate the squared CC and squared CA, respectively.
p < .1. **p < .05. ***p < .01.
Robustness
To test the robustness of the experimental results, we perform the following robustness tests: (1) replacing the explained variable; (2) changing the time range of the sample; (3) selecting alternative control variables.
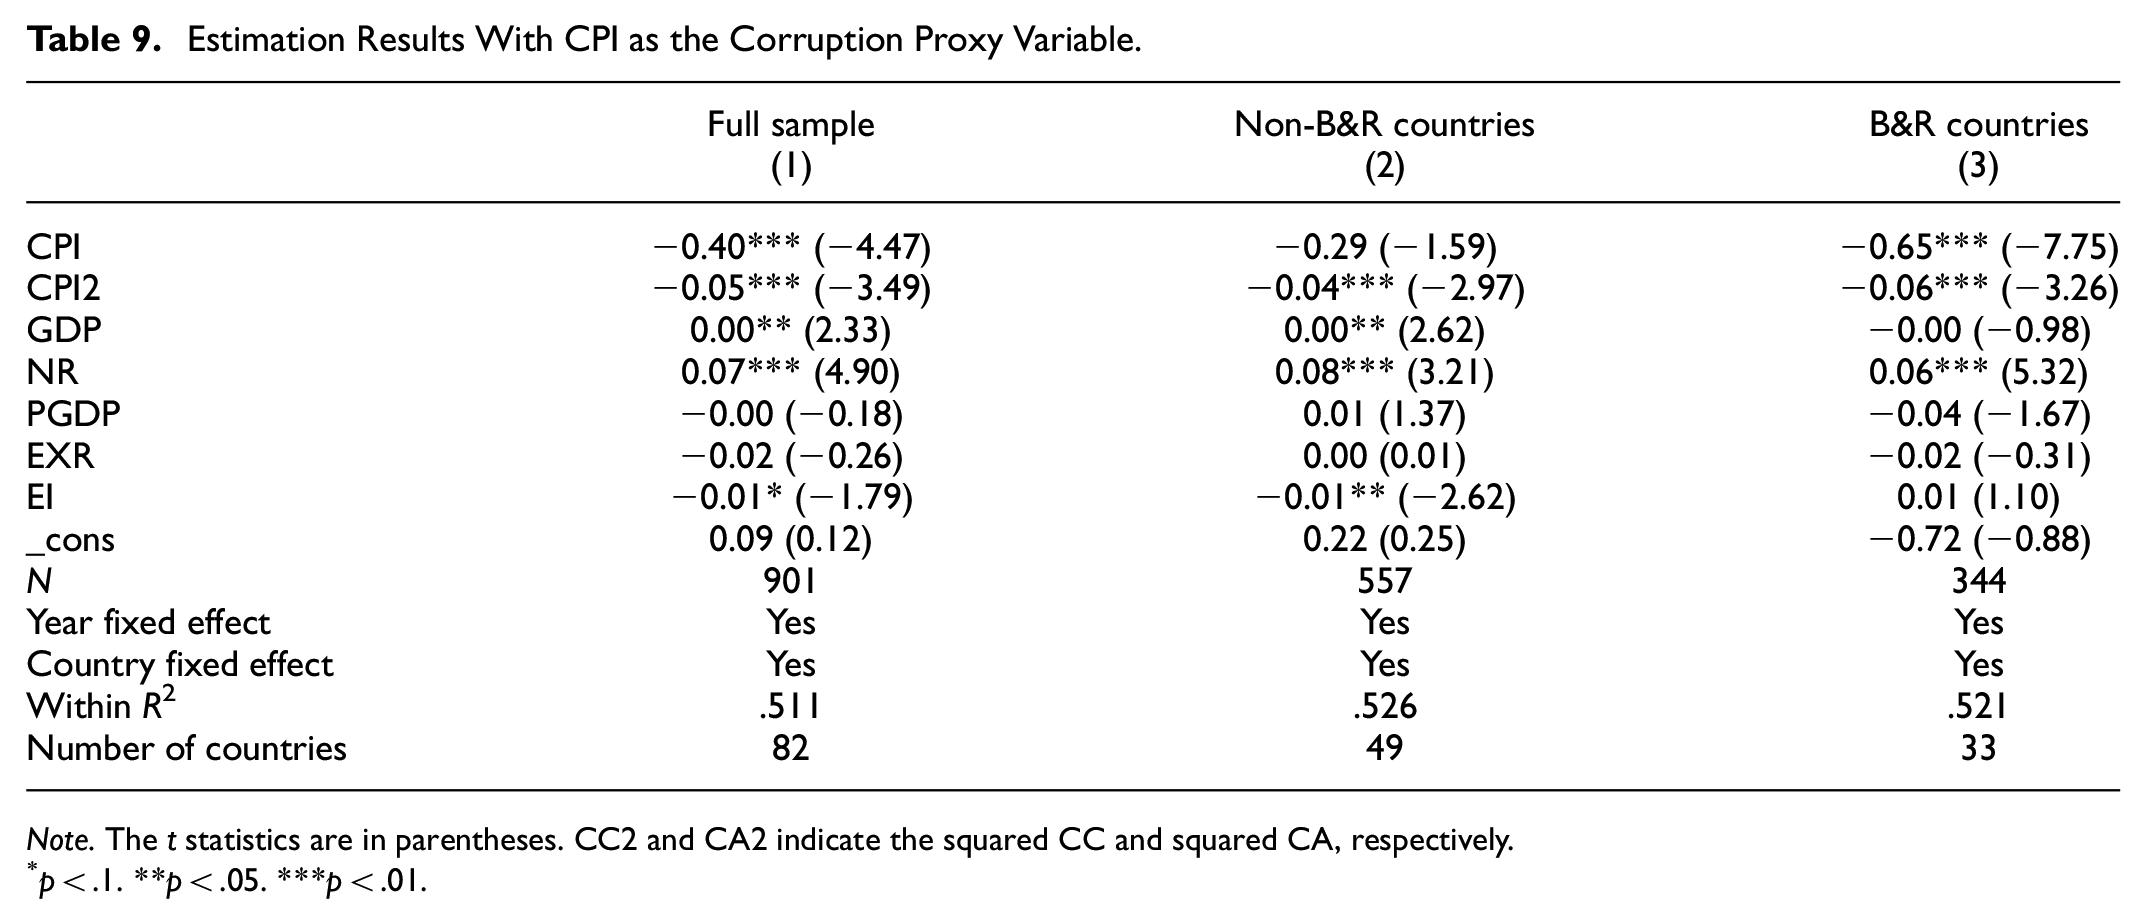
First, we use the CPI, which is also known to be based on expert knowledge, as another proxy variable for corruption. In this paper, the CPIs released after 2012 are divided by 10 to ensure that the magnitude of the data is consistent. Besides, the CPI indicator is also reversed, and a high CPI value indicates a high expert-judged corruption level. The regression results with CPI as the corruption proxy variables are shown in Table 9. The CPI2 (the square of CPI) results are both negatively correlated with China’s OFDI. for the full sample, non-B&R countries and B&R countries.
Estimation Results With CPI as the Corruption Proxy Variable.
Note. The t statistics are in parentheses. CC2 and CA2 indicate the squared CC and squared CA, respectively.
p < .1. **p < .05. ***p < .01.
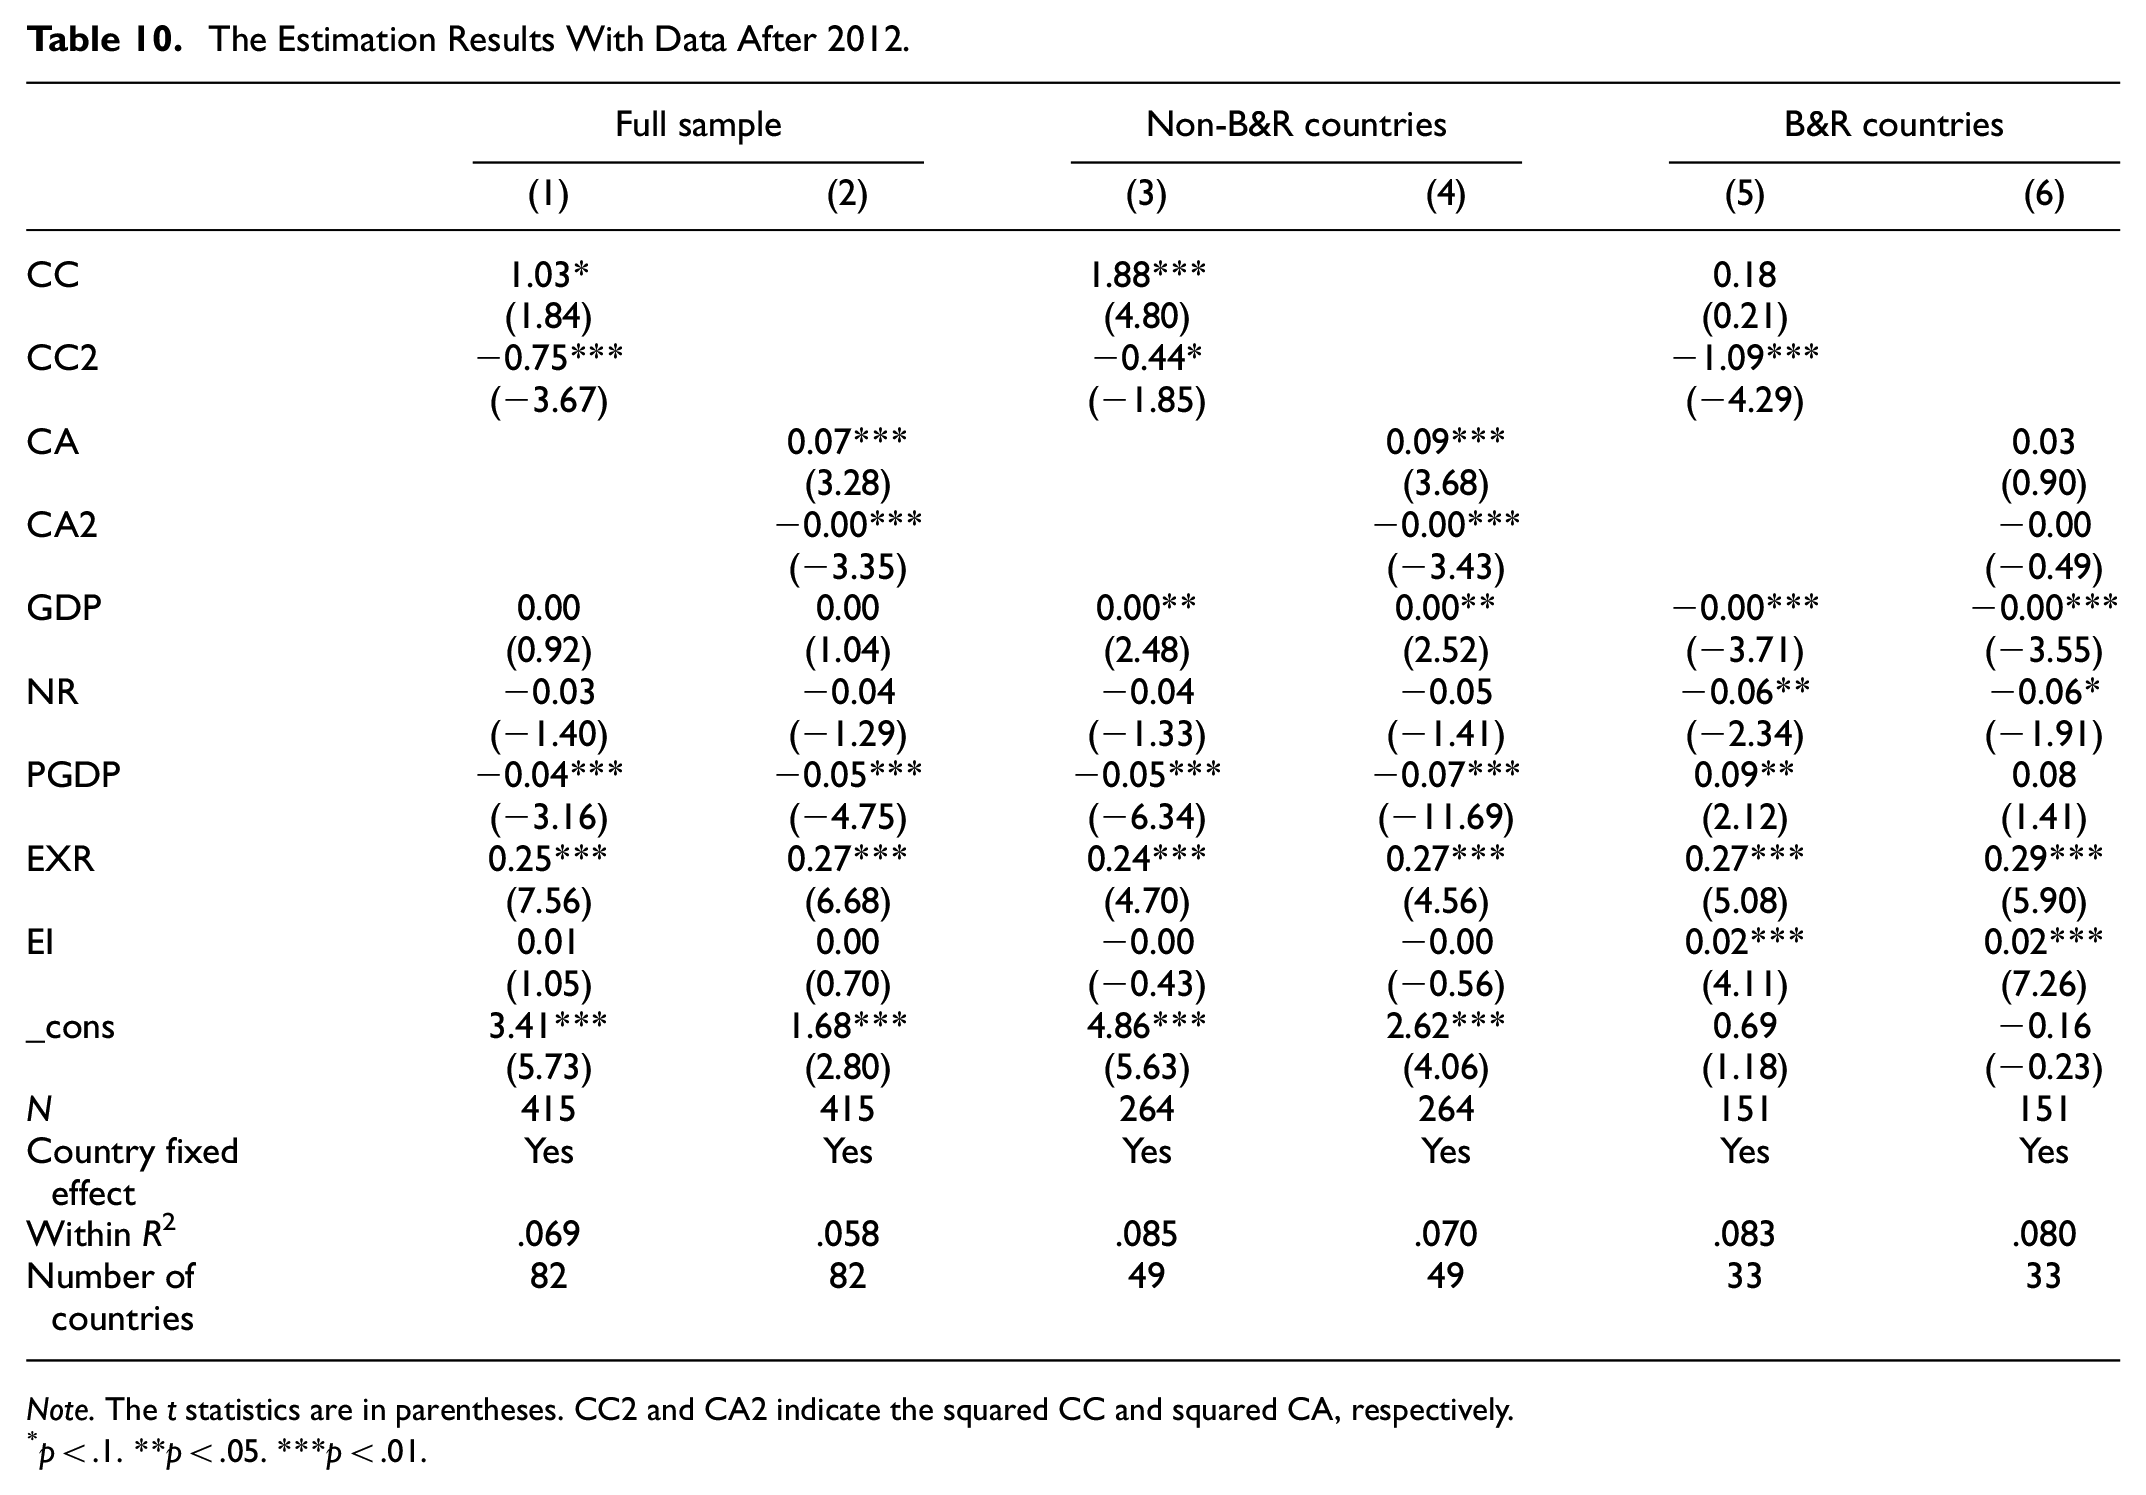
Second, a robustness test is conducted by changing the time range of the sample. The reliability of the results requires a sufficient amount of data, so we select the data from 2012 to 2017 for the robustness test. As shown in Table 10, for the full sample and non-B&R countries, there are nonlinear relationships between the corruption proxy variables and China’s OFDI. The coefficients of CC and CA are significantly positive, while CC2 and CA2 are significantly negative. However, for B&R countries, the coefficient of CC2 is significantly negative, while that of CA and CA2 is not significant.
The Estimation Results With Data After 2012.
Note. The t statistics are in parentheses. CC2 and CA2 indicate the squared CC and squared CA, respectively.
p < .1. **p < .05. ***p < .01.
Third, we added additional control variables for robustness tests. The business environment in host countries may influence China’s OFDI (Rousseau & Deschacht, 2020). Since 2015, the World Bank releases the composite ease of doing business (DOB) index every year. Considering the time duration, this paper selects Starting a Business index as a proxy variable, which is one of the most important dimensions of DOB. Besides, the EXR is removed because the exchange rate stability is included in business convenience. As shown in Table 11, the regression results for corruption proxy variables are robust.
The Estimation Results With Alternative Control Variables.

Note. The t statistics are in parentheses. CC2 and CA2 indicate the squared CC and squared CA, respectively.
p < 0.1. **p < .05. ***p < .01.
Endogeneity
This paper also considered the possibility of heterogeneity problems, which could be caused by the omission of control variables or reverse causality. Therefore, a dynamic GMM model, which is considered to be a favorable tool for solving potential endogeneity problems, is employed to estimate the impact of corruption on China’s OFDI (Jha, 2019; Kahouli & Maktouf, 2015). The basic idea of GMM estimation is to eliminate the fixed effects with differential regression equations and select appropriate instrumental variables to solve the endogeneity. To avoid weak instrumental variables, we set the one-period lag of the dependent variable as the predetermined variable, and the instrumental variables of the dependent variable are set as the two- and three-period lag. GDP, PGDP, and EI are identified as endogenous variables, and their two-period lags are selected as the instrumental variables.
The results of the GMM estimation are shown in Table 12. For the full sample, CC is negatively associated with China’s OFDI. And for non-B&R countries, the coefficient of CA is significantly negative. The regression coefficients of CA2 is significantly negative for B&R countries.
Effects of the Corruption Proxy on LFDIF, GMM.

Note. The t statistics are in parentheses. CC2 and CA2 indicate the squared CC and squared CA, respectively.
p < .1. **p < .05. ***p < .01.
Discussion
This paper explores the relationship between corruption and OFDI using expert knowledge-based corruption measures and public corruption awareness. The research results show that, for full sample countries, there is a nonlinear relationship between the expert’s judgment of the host country’s corruption level and China’s OFDI. This is consistent with the results of Hu and Zhang (2013), which also emphasized a quadratic relationship between corruption in host countries and China’s OFDI. A possible explanation is that if the host country is moderately corrupt, bribery can help transnational enterprises to improve investment efficiency, yet if the host country is highly corrupt, the cost of bribery becomes too high to attract foreign investment. Regarding public corruption awareness (CA), the regression results of the full sample show a negative correlation with China’s OFDI. In this paper, high public awareness of corruption reflects the prevalence of corruption among the public, where even bribery does not ensure access to government services and improve efficiency, and such widespread and arbitrary corruption is detrimental to foreign direct investment (Zhu & Shi, 2019).
The results of this paper differ from Kolstad and Wiig (2012) and Yang et al. (2015), which suggest that high levels of corruption (high political risk) in host countries are associated with high levels of China’s OFDI. This difference may due to the selection of corruption measurement index and sample time range. On the one hand, Kolstad and Wiig (2012) and Yang et al. (2015) adopt the expert-judged corruption levels rather than the actual corruption as an explanatory variable. Considering that the actual corruption level is difficult to measure, Zhu and Shi (2019) investigate the attitudes of Chinese enterprises toward corruption through the experimental method and point out that corruption in the host country would reduce the probability of Chinese enterprises entering the market. On the other hand, the Chinese government has launched well-publicized anti-corruption campaigns since 2012. As anti-corruption regulations are strengthened and Chinese enterprises become more transparent, corruption in host countries may be more detrimental to China’s OFDI (Zhu & Shi, 2019).
When it comes to the control variables, the estimated results of most variables are robust in different regression models. For full sample and non-B&R countries, the market size and natural resource abundance in the host county are positively correlated with China’s OFDI. However, for B&R countries, only the abundance of natural resources is positively correlated with China’s OFDI. It may be because most B&R countries are rich in natural resources, yet the efficiency of resource development and utilization is low due to the backward technology. Therefore, the market demand of B&R countries for foreign investment is mainly on resource development and construction, and Chinese investment focuses on industries like infrastructure, electricity, minerals, and telecommunications (Liu et al., 2017).
Conclusions and Future Work
This paper explores the relationship between corruption and OFDI. On the basis that most of the relevant literature takes the expert knowledge-based corruption index as the proxy for the level of corruption, this paper proposed a new corruption measurement from the perspective of public corruption awareness. The public corruption awareness index is constructed based on Internet search data, and the index is more objective, easier to obtain, and more real-time than the published indexes.
Based on expert knowledge and public awareness, this paper investigates and discusses the impact of host countries’ corruption on China’s OFDI. The panel data of the empirical study includes the data of 86 host countries (36 B&R countries and 50 non-B&R countries) and covers the time range from 2005 to 2017. According to the findings of the fixed effect regression model, corruption has a negative impact on foreign direct investment by raising the cost of doing business in the host nation. The findings of this paper are in line with previous research such as those of Hu and Zhang (2013). Meanwhile, public corruption awareness reflects the prevalence of corruption among the public. Our conclusion is supported by the negative correlation between public corruption awareness and China’s OFDI.
For future research, the paper can be extended in the following ways. First, while we just took “corruption,”“political corruption,” and “bribe” as the core related topics, it is important to investigate and identify more invisible corruption-related topics and diverse compounding techniques in order to develop a more accurate public corruption awareness measure. Second, the correlation between public corruption awareness and the actual level of corruption is worthy of a systematic and detailed analysis from theoretical and empirical perspectives. Third, China’s investment in countries along the Belt and Road is also affected by other factors and events. For example, affected by the local conflict between Russia and Ukraine, economic and financial crises occurred in Sri Lanka and other South Asian countries. Therefore, future research can analyze the impact of such events on China’s foreign investment.
Footnotes
Declaration of Conflicting Interests
The author(s) declared no potential conflicts of interest with respect to the research, authorship, and/or publication of this article.
Funding
The author(s) disclosed receipt of the following financial support for the research, authorship, and/or publication of this article: This work was supported by research project “Risk Analysis and Prediction for Countries along the Belt and Road” (No. E1E90804), MOE (Ministry of Education in China) Project of Humanities and Social Sciences (No.22YJC630137) and Shanghai Yangfan Program (No.22YF1401600).