
Abstract
Although tourism expenditure has long been a pertinent topic in studies dealing with cultural tourism, its importance in recent years has become even more marked due to the consequences of low-cost tourism that many destinations are suffering. This need has been further aggravated by the impact of the ongoing Coronavirus pandemic. Now, the only sustainable means of increasing destination revenue is to generate greater financial profitability of tourism-related activities, as opposed to increasing tourist volumes. The present study analyzes the determinants of the likelihood of tourist spending in an urban-cultural destination whose economic sustainability is being threatened by low-cost tourism. To this end, all the tourism activities of the sample (672 in total) were recorded in real time during the stay via a purpose-designed mobile application. Given the nested structure of the sample, multilevel modeling was used: the characteristics of the different tourism activities were used as predictor variables, while characteristics of the tourist were used as control variables. Regarding the former, the results suggest that spending is more likely at the beginning of the stay and in relation to non-cultural tourism activities (restaurants, shopping, transport, etc.). An interaction effect between activity location and timing (beginning vs. end of stay) was also demonstrated: at the beginning of the stay, the greater likelihood of spending was related to services or attractions outside the city center; and, toward the end, spending patterns become more static, based close to the city center. The aim is to explain the probability of tourist expenditure at each spending opportunity, thus contributing to the current knowledge of total tourist spending. Knowledge of tourist expenditure patterns is a prerequisite for raising profitability-per-tourist when increasing visitor volumes is not an option.
Keywords
Introduction
Although tourism sustainability has been traditionally associated with environmental or heritage conservation (Richards, 2018; Wang, Wang et al., 2021), according to the classification proposed by the UNWTO (2004), destination sustainability can be social, environmental, or economic. Regarding the economic factor, these authors underlined the relevance of tourist GDP for public investment and employment. More recently, Blancas, Caballero et al. (2010), Blancas, González et al. (2010) developed a synthetic sustainability indicator based on these three dimensions, where the economic aspect refers to economic tourism benefits for host communities and destinations, including indicators such as tourist demand, seasonality of the activity, employment, public investment, or tourism expenditure. Thus, economic sustainability is now recognized as an essential condition of sustainable tourism (Blancas et al., 2015, 2016; Qiu et al., 2019), while the COVID-19 pandemic has accentuated this need even further (Zenker & Kock, 2020).
One problem that has become critical in recent years, related to the economic sustainability of destinations, is low-cost tourism (Eugenio-Martin & Inchausti-Sintes, 2016; Wu et al., 2021). This is a broader concept than simply low-cost travel and transport because it includes low spending at the destination. The low-cost tourism problem has been further aggravated by the current global situation generated by the pandemic, which, as well as leading to severe travel restrictions, has led tourists to lose interest in destinations’ attractions and, instead, to go in search of services that are currently prohibited in their home countries (primarily, leisure services) (seen at: https://www.france24.com/en/europe/20210130-it-s-liberating-to-be-in-a-restaurant-french-tourists-escape-to-madrid). The negative impact of this problem is higher in micro-destinations—small geographical regions that depend heavily on tourism, with a high concentration of tourist attractions and a high degree of homogeneity in the provision of tourism services (Hernández-Martín et al., 2016). In such destinations, vacationers and residents must coexist (Castañeda et al., 2019; Liang & Hui, 2016).
However, the problem of low-cost tourism receives little scholarly attention. Recent studies have shown that this phenomenon is associated with the length of tourists’ stays (Martínez-Garcia & Raya, 2008), which are growing increasingly short (Jacobsen et al., 2018), particularly in urban-cultural tourism (Guedes & Jiménez, 2015). Other authors have analyzed the expenditure transfer between tourism activities (Eugenio-Martin & Inchausti-Sintes, 2016), referring to the phenomenon whereby a tourist may (or may not) opt to transfer what they save on one low-cost option (on flights, for instance) to spend on a higher-cost option (a higher-category hotel, for example, while yet others have developed strategies to attract vacationers that typically have little interest in cultural attractions (Graham & Dennis, 2010). These studies define low-cost tourists as individuals who travel on low-cost airlines. However, given that a significant part of tourism travel is terrestrial (e.g., domestic tourism) and travelers on a tight budget frequently use other means of transportation—even ones that cost nothing, such as hitch-hiking—it seems appropriate to review this definition. Given that analyzing spending determinants in low-cost tourism is critical (Martínez-Garcia & Raya, 2008), in the present study, low-cost tourism is characterized by a low likelihood of spending at the destination.
The aim of this research is to explain the probability of tourism expenditure at each spending opportunity or event. While most of the literature has attempted to explain total individual tourism expenditure based on the characteristics of the tourists (Brida & Scuderi, 2013), this study attempts to determine the probability of spending according to tourists’ activity in urban-cultural destinations. To this end, we use predictor variables directly related to the tourists’ activity (type and timing of the tourism activity, distance between each activity point and the city center, and the interaction effect of timing and distance), while traveler characteristics were used as control variables (visitor’s age, motive for visit, and number of previous visits to the destination).
Unlike previous studies on tourist spending, this study’s focus on real-time spend-behavior analysis at the destination contributes to the literature by enabling estimation biases to be reduced. Furthermore, by analyzing the determinants of the likelihood of spending in terms of tourism-activity type, location of the activity relative to the city center, and timing of the activity, destinations will be able to develop effective strategies for increasing traveler spend. The results may help improve the planning and development of high-quality tourism, resulting in higher expenditure that helps promote regional economic development (Moeller et al., 2011; Nickerson et al., 2016) and more economically sustainable urban-cultural tourism (UNWTO, 2020).
Literature Review
Low-cost tourism is becoming a cause for concern in many destinations that receive a high number of vacationers. Low-budget travelers spend little in the destinations, despite receiving many of the same benefits and services as visitors with medium to high budgets, who spend more (Ferrer-Rosell et al., 2016).). Therefore, low-cost tourism reduces short-term profitability and medium- and long-term sustainability. The relative impact of spending is also higher on micro-destinations than on macro-destinations (Viu et al., 2008). Given the relevance of micro-destinations, it is essential to examine the determinants of the likelihood of spending and identify those activities that generate greater profitability per tourist (higher-quality tourism) to combat low-cost tourism.
Tourism expenditure is the amount paid for the acquisition of goods, services, or valuables—for personal use or as gifts—related to tourism trips (United Nations, 2010). The characteristics of the tourism activities that tourists choose to undertake at the destination are therefore crucial to explaining their propensity to spend money there, taking into account that some activities are more costly than others, while many attractions cost very little or are entirely free. The majority of previous studies have analyzed characteristics on a more general level, such as tourist-related characteristics (sociodemographic or psychographic), while trip-related or destination-related variables are less commonly found in the literature (Brida & Scuderi, 2013; Wang & Davidson, 2010). In this paper, tourist-related characteristics are used as control variables and the less-common trip-related characteristics (specifically, relating to the different tourism activities undertaken at the destination) are used as predictor variables of tourist propensity to spend.
Determinants of the Likelihood of Tourist Spending: Tourism Activity Characteristics
We took three elements to characterize each instance of a tourism activity that the research participants recorded during their stay: activity type (eating out, traveling, shopping, visiting attractions, sightseeing, and so on) (Wu et al., 2014), the timing of the activity (closer to the beginning or the end of the stay) (Pettersson & Zillinger, 2011), and the location where the activity took place, relative to the city center (Abbruzzo et al., 2014b).
Previous studies have shown that expenditure levels are determined by the nature of the attractions on offer. While a destination’s cultural attractions are important in drawing visitors to a destination (Wu et al., 2014), in the case of urban-cultural tourists, their expenditure on other (non-cultural) activities, including transportation, food, and shopping, increases when they are located at or near cultural attractions (Donaire et al., 2015; Dredge, 1999). According to Castañeda et al. (2019), expenditure differences among tourists mainly result from spending on non-cultural tourism services (restaurants, shops, hotels, etc.), but not much on cultural attractions. Given that many cultural attractions are free of charge (Abbruzzo et al., 2014a) and travelers are likely to spend more money on non-cultural tourism services than on cultural activities (Pulido-Fernández et al., 2016), we propose that:
H1: Visitors will spend more money on non-cultural tourism services than on cultural attractions.
Tourists tend to visit cultural attractions and explore destinations during the first few days of their stay (Lee et al., 2015; Seifolddini-Faranak et al., 2009), which will also lead to non-cultural expenditure (Dredge, 1999). At the beginning of the visit, tourists are less sensitive to price (Hennessey et al., 2014). Furthermore, as the trip progresses, the number of stops and the distance traveled both decrease (Zhu et al., 2006), thereby reducing expenditure per person per day (van Loon & Rouwendal, 2017), even on non-cultural attractions (Alegre & Cladera, 2010). Based on these data, we propose that:
H2: The propensity to spend money at an urban-cultural destination decreases toward the end of the trip.
The distance from the city center of the shop where the tourist makes a purchase, on the one hand, and their propensity to spend money at the destination, on the other, are both linked to the effort they are prepared to make to travel to the particular attraction they want to visit or to undertake a given tourism activity (Reif, 2019). Tourists will visit the most important attractions in the city because it is these that motivated them to make the visit. However, time is a scarce commodity for tourists and must be maximized (Lew & McKercher, 2006; Thrane & Farstad, 2011; Vena-Oya et al., 2021). Hence, tourists often start their visit close to an iconic part of the city (usually located in the historic quarter, which is typically close to the center) and then explore nearby zones (Reif, 2019). This leads them to visit the main attractions—no matter where they are relative to the center—and to seek to optimize their time budget by first visiting the main parts of the city where they start their spending. This pattern is then repeated, regardless of where their hotel is located (Han et al., 2014), meaning that they start off another sequence with a visit to another iconic site or area, spreading their expenditure throughout these central zones. Therefore, it is anticipated that visitors will be more likely to spend money in the historic quarter of urban-cultural destinations (Reif, 2019).
H3: The further from the city center a service or tourist attraction is, the lower the likelihood of tourist spending.
Finally, an interaction effect between the timing of the instance of tourism activity (that is, early in the stay or toward the end) and the distance traveled from the city center is expected. Knowledge of tourist spatio-temporal behavior is a key issue for destination managers when deciding where to locate the service offer and organizing visitor routes (Zhong et al., 2019). Tourist movement patterns form a dynamic process that must be studied jointly alongside the effect of time (Zhong et al., 2019).
Although these behaviors do form a pattern, they typically differ depending on the tourist’s motive for visiting the destination—specifically, the degree to which they are drawn to its cultural highlights or other (non-cultural) features (Masiero & Zoltan, 2013).This means that tourists who are culturally motivated will be likely to visit the main cultural attractions of a destination in the first few days of their stay and will be prepared to make a greater effort to reach them if necessary (Donaire et al., 2015; Lee et al., 2015). This phenomenon occurs even in the case of repeat visitors who want to visit those attractions they previously missed or revisit others in greater depth (Oppermann, 1997). Tourists also usually organize their sequence of visits around one of the city’s iconic sites. Zillinger (2007) and Reif (2019) show that, in the early stage of the stay, tourists present a more exploratory pattern, whereas they remain in the city center or close to their hotels toward the end of their stay. In a micro-destination, a high percentage of hotels are located in the city center, which is an important aspect to take into account when planning a visit (Zhong et al., 2019). The following hypothesis is therefore proposed:
H4: There is an interaction effect between time and distance, such that the likelihood of tourist spending in the city center is lower in the early stages of the stay and higher toward the end.
Determinants of the Likelihood of Tourist Spending: Traveler-Related Characteristics
Traveler-related characteristics are the most widely-studied variables in the literature to explain tourist spending (Brida & Scuderi, 2013; Oh et al., 2004). While some studies have highlighted their generally poor predictive capacity to explain spending (Tkaczynski et al., 2009), some of them, such as age (Li et al., 2013), psychographic variables (Chang, 2013; Imler, 2011), and previous visits (Lee et al., 2015) have demonstrated their predictive capability regarding this behavior. Given that the effects of age, motive for visit, and previous destination experience are well established in the literature, in the present study, we used these as control variables, bearing in mind the nested structure of the data.
Materials and Methods
Study Sample and Data Collection
Given that the study focused on urban-cultural tourism, the city of Granada in Spain was chosen as the destination for analysis. Granada is the most-visited city in Andalusia, receiving over 3 million vacationers in 2019, mainly culturally motivated (IEA, 2020). Furthermore, Spain is the world’s second-most-popular tourist destination location, after France (UNWTO, 2019). Granada is a small city (88 km2) with several cultural attractions, fulfilling two essential criteria for being considered a micro-destination: low variability and high concentration of tourist offerings (Hernández-Martín et al., 2016). Regarding low-cost tourism, the level of tourist spending in Granada is below the average in comparison to other similar destinations nearby (IEA, 2018).
Table 1 shows a comparison between Granada and other micro-destinations similarly affected (low daily expenditure, low number of overnight stays, and high tourist throughput). The figures for average daily tourist expenditure and overnight stays are quite similar, while the daily expenditure varies between €63 and €100 and the number of overnight stays ranges from 1.2 to 3 nights. Granada presents an average daily tourist expenditure of €70.40 and 2.1 overnight stays.
Comparison of Average Tourism Data for Popular European Destinations.
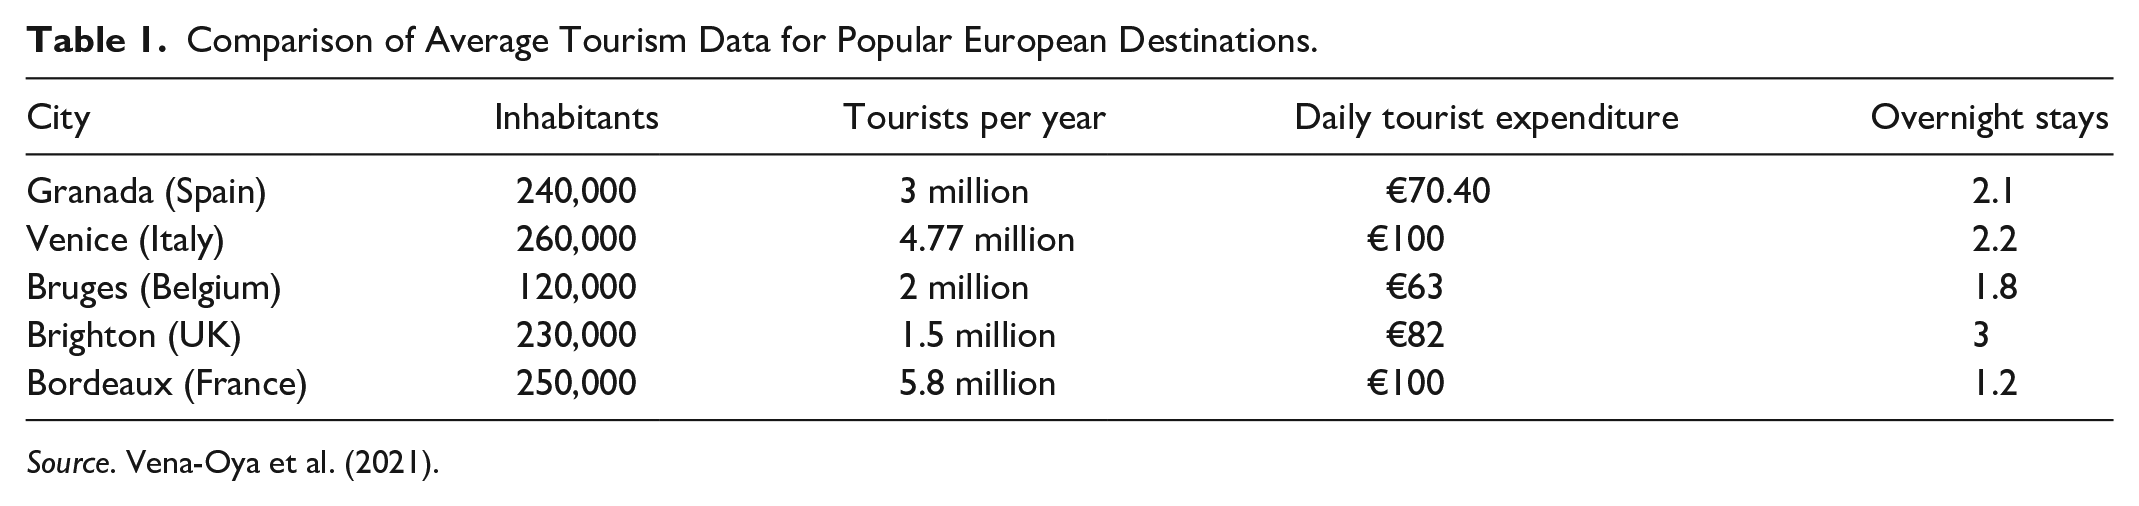
Source. Vena-Oya et al. (2021).
The target population for our study comprised domestic visitors, who account for two-thirds of Andalusian tourism (Andalusian Ministry for Tourism and Sport, 2015). We focused exclusively on domestic tourists because international travelers usually incur mobile roaming fees and tend not to use their data plans when abroad—an essential factor in our study, as we discuss later.
Participants were recruited using convenience sampling by conducting interviews at the city’s main tourism locations. In order to take part, the individuals had to fulfill four criteria: to have arrived on the same day that the sampling took place; to be of legal age; not to be visiting as part of an organized group; and to intend to stay at the destination for at least a further 24 hours. This latter requirement was imposed to ensure sufficient data with which to measure tourist activities during the stay.
The interviewees completed a questionnaire containing variables such as age, gender, education level, number of travel companions, number of previous visits to the destination, and motive for visit, following Brida and Scuderi (2013). Age, number of previous visits to the destination, and motive for the visit were included as control variables (Castañeda et al., 2019), while others, such as gender or education level, were omitted since we interviewed groups. The interviewees were then asked to install the “Granada Apps” Android application on their phones—a platform developed by the researchers to track the location of all tourism-related businesses, including hotels, restaurants, bars, shops, monuments, tourist attractions, event venues, and historic buildings (This application is not commercially available but can be obtained on request from the corresponding author). This application recorded GPS locations and, by means of a clustering algorithm, identified areas where travelers remained for periods longer than 30 minutes—a timeframe that indicated the possibility of an instance of tourism activity that might involve expenditure (Quero et al., 2017). The operating scheme of the app is shown in Appendix 1. When a tourist left the area close to a tourism-related business, as detected by the GPS tracker, the app sent a notification, and the traveler was required to answer questions related to the tourism-activity type (shopping, restaurant, transportation, etc.), if any, and the amount spent, if any (see Appendix 2). Although those who remained at a given location for less than 30 minutes were not sent the automated notification, all participants were asked to provide information, via the app, about any tourism activity they had carried out at any point. All the participants were previously informed about the application’s functions and voluntarily provided their expenditure data. To incentivize participation (while preventing unrealistic or artificially increased expenses), reimbursement of travel costs was raffled for one participant, chosen at random, who had provided all the receipts for the purchases they had recorded via the app. Participants were asked to submit details of at least five activities undertaken during their stay and to keep the GPS switched on for the duration of their visit. To be considered valid, the participants were also asked to indicate their expenditure for more than 1 day of their stay, which yielded a 20% acceptance rate of the tourists recruited.
GPS has previously been used to describe tourists’ movement patterns (Shoval et al., 2011) and analyze their decision-making (Tchetchik et al., 2009). However, the possibility of using GPS applications to facilitate effective data-collection regarding traveler expenditure has received little attention in the literature. There are two main advantages of a GPS-based approach. First, it enables real-time analysis of spending behavior, including expenditure transfers between tourist services (Eugenio-Martin & Inchausti-Sintes, 2016). Second, it provides predictor variables related to visitors and the tourism activities they undertook during their stay. To the best of our knowledge, no similar studies have analyzed tourism spending activity-by-activity.
The study analyzed 672 tourism activities reported by 90 participants, corresponding to an average of 7.5 activities reported per traveler for an average stay of 36 hours. Data were collected over 2 years prior to the COVID-19 pandemic. However, mobility restrictions subsequently prevented this type of study from being carried out. A comparison of characteristics of the present study population and a population analyzed by the Tourism Observatory of Granada (OTG, 2019) indicated similarities between the two (Table 2). The most notable difference was age (younger in the present sample), which was partly because of the requirement to use the mobile app in the study.
Profile of the Tourist Population Visiting Granada Versus the Sample Population.

Theoretical model
Figure 1 shows the proposed theoretical model, where the variables related to expenditure mainly capture the propensity to spend and the control variables capture the sociodemographic and psychographic characteristics commonly used in the literature such as age, motive for the visit, and number of previous visits (Brida & Scuderi, 2013).

Theoretical model.
Data Analysis
Given the nested structure of the data (activities per tourist), the assumption of observational independence was violated and, therefore, techniques such as conventional or binomial regression were deemed inadequate because they underestimate standard errors and can thus make incorrect inferences about the parameters. In this context, it was more appropriate to use mixed-effects regression models, in which multiple random effects could be specified (Hedeker, 2003). Multilevel (mixed) models allow for the use of predictive (explanatory) variables from different levels (tourists and tourism activities) and interactions between levels to explain the likelihood of spending relating to each activity. Moreover, these models allow generalizing higher-level characteristics across the lower level, which improves the accuracy of predictors for groups with less data (Buxton, 2008), while being more flexible with respect to the model assumptions (Starkweather & Moske, 2011). As the aim of this study was to analyze tourists’ propensity to spend, the dependent variable was dichotomous, based on the categories “spend reported” versus “no spend reported” (the latter accounting for 13% of the total sample).
Regarding our choice of data-analysis model, binomial logistic regression models have gained prominence in applied empirical research (Agresti et al., 2000). A generalized linear model such as binomial logistic regression helps address the problem of categorical dependent variables (Grilli & Rampichini, 2007) and can be applied to nested data with two levels (Grilli & Rampichini, 2013). Hence, we opted to analyze our data using a multilevel binomial logistic regression model, as specified by Heck et al. (2013).
Regarding the sample size necessary for this type of analysis, the literature highlights the need to include sufficient higher-level units (tourists, in this study). A size of 50 to 70 units is acceptable (Maas & Hox, 2005) because no significant improvements are achieved in samples larger than 70 units (Paccagnella, 2011). Similarly, the number of observations per individual was considered sufficient, given that the literature recommends at least five observations for a sample of 50 individuals (Moineddin et al., 2007).
Models for predicting expenditure have been widely used in the recent literature (Hu et al., 2020) and in the specific case of the tourism sector (Chen, Wang et al., 2021).
Measurement of Predictor Variables
In line with the proposed hypotheses, the independent variables were time and tourism-activity type, and distance between the city center and the location of the activity. We also included some control variables (tourist characteristics): age, motive for visit, and number of previous visits.
Tourism-activity type was determined using a binary variable, where “1” represented cultural activities and “0” indicated non-cultural activities (Pulido-Fernández et al., 2017).
“Timing of activity” was measured based on the difference between the time at which a tourism activity took place (hours/minutes/seconds) and the time of the first activity reported by each participant (Vassiliadis et al., 2013). “Distance” was determined by the distance between a tourism activity reported by the participant and the city center (Reimers & Clulow, 2004). To measure this, the latitude and longitude coordinates of each tourism activity were used, and the Euclidean distance between them was calculated. The Euclidean distance was converted into meters by multiplying it by 111.100 to obtain a variable that facilitated interpretation of the results (One degree of latitude corresponded to approximately 111.1 km. The assumption for longitude is only valid for the Equator but is usually adopted for simplicity for the other parallels).
The interaction effect was the product of “distance” and “time” of the activity. To avoid potential problems of multicollinearity between these variables and the interaction effect, the principal variables were mean-centered, as proposed by Little et al. (2006).
Turning to the control variables, “motive for visit” (i.e., the degree to which their visit was culturally motivated or otherwise) was assessed by asking tourists, at the beginning of their stay, to distribute 10 points between different cultural activities (monuments, museums, cultural events, etc.) and non-cultural elements (hotels, restaurants, shops, public transport, etc.), based on their relevance to their trip to Granada. By subtracting the total number of points the tourist awarded to the non-cultural elements from the total they awarded to the cultural elements, we arrived at the measure of “motive for visit” (Istoc, 2012). The results were scored using a scale from −10 (motive was entirely non-cultural) to +10 (motive was exclusively cultural). Finally, for families, the age of the family head was considered (Boo et al., 2007; Hung et al., 2012) and the number of previous visits was based on past visits to the destination by the family head (Petrick, 2004). For other groups that do not include the family, age and number of previous visits correspond to the interviewee’s values.
Results
Confirming the Model Assumptions
The advantage of binomial and multinomial multilevel models is the non-assumption of normality, linearity, and homoscedasticity, in contrast to classical regression models (Starkweather & Moske, 2011). The main limitation of this type of model is multicollinearity among predictor variables.
The mean, standard deviation, and correlation between the predictors for each instance of tourism activity recorded by participants are shown in Table 3. The correlation was small, ruling out the possible existence of multicollinearity in the model.
Descriptive Statistics and Correlations for Likelihood of Tourist Spending Predictors.

Intraclass correlation (ICC) is a measure used in multilevel models with nested data to identify whether it is necessary to include higher-level predictors (our control variables). This is the proportion of variance of the dependent variable explained by high-level units (tourists, in this study). Considering a null model, the ICC exceeded the minimum value (0.10) recommended by the literature (Hox et al., 2010). The model presented an ICC of 0.6, hence multilevel analysis was necessary and control variables needed to be retained in the model.
Alternative Models
The literature recommends that multilevel analyses be performed using alternative models—that is, with random constant and fixed slopes for predictors; random constant and random slopes; and with and without predictors for random parameters (Heck et al., 2013).
Table 4 shows the comparison between alternative models. The information criteria (IC) and log-likelihood (LL) criteria suggest that the model with both tourist- and tourism-activity-predictors (the selected model) is more appropriate than either the null model or the model based solely on tourism-activity predictors. Furthermore, random slopes were included, but no gains were observed either in the IC or in LL. Finally, the predictive ability of the empirical model was significant (98.3% for the selected model compared to 88% of the null model), with a major improvement in the case of tourism activities on which there was no expenditure (65.9% compared to 14.1%) and the classification of activities in which the tourist spent money being close to 99% predictive ability.
Information Criteria of the Proposed Models.

Analyzing the Effect of the Characteristics of the Tourism Activity on Likelihood of Spending
The estimated coefficients for the “no expenditure” category, as well as the significance level and odds ratio, are shown in Table 5. Regarding the predictor variables “activity type” and “time,” these presented a negative and significant coefficient with expenditure, while the interaction effect (Time × Distance) presented a positive and significant effect on the expenditure variable. Regarding the control variables, only age was significant, with a positive effect. In addition, to solve the overfitting problem of the sample used for model construction, the result of the estimation for the proposed model was validated by bootstrapping using 500 samples (Wilson et al., 2019). The confidence intervals contain all the estimated coefficients of the selected model (Table 5).
Estimated coefficients and odds ratios (one-tailed significance).

The relationship between predictors and propensity to spend must be interpreted using the odds ratio—Exp (coefficient)—as the relative probability of expenditure occurring, depending on the independent variable (type, time, or distance). Values higher than “1” represent a likelihood of spending, and values below “1” represent a likelihood of not spending (reference category) (Szumilas, 2010).
Regarding H1, which centers on the type of activity, the positive value of the coefficient indicated that tourists were more likely to spend on non-cultural tourism services. This may be because—even in urban-cultural tourism—expenditure on non-cultural services (hotel, restaurants, shops, etc.) is generally much higher than expenditure on cultural attractions (Castañeda et al., 2019), which supports this hypothesis. Many cultural attractions are free of charge or cost very little.
The second hypothesis proposed a negative relationship between spend and timing of the activity. As expected, the coefficient was negative and significant, which supports this hypothesis (Table 5). In this case, the propensity to spend was higher at the beginning of the stay and lower at the end.
H3 proposed a negative relationship between the likelihood of spending and the distance of the tourism activity from the city center, but the coefficient was non-significant (Table 5). However, the interaction effect between time and distance was significant and positive. Figure 2 shows this effect. Tourists are more likely to spend in the early stage of their stay if the activity concerned is located some distance from the city center, whereas, toward the end of their stay, they are more likely to spend in areas located closer to the city center. This interaction effect between time and distance provides empirical support for H4.

Interaction effect.
Discussion
A wide range of so-called micro-destinations, including Granada, have found certain aspects of tourism to be problematic, such as overexploitation and low-cost tourism, which negatively impact their economic sustainability. The present study addressed low-cost tourism by identifying the characteristics of those activities offered by the destination that increase tourists’ propensity to spend, to enable the tailoring of destination strategies (Park et al., 2008).
In what follows, the main theoretical implications of the study are discussed. First, tourist expenditure was analyzed using a series of variables other than the traditional sociodemographic variables, whose predictive validity has been questioned (Tkaczynski et al., 2009). Of these, only age was selected because of the influence it may have on other variables such as distance traveled due to age-related mobility restrictions (Miravet et al., 2021). Furthermore, our study has not examined spending from the traditional perspective of the tourist (Brida & Scuderi, 2013), but included variables related to spending itself. Thus, not only have new variables that can affect tourist spending been incorporated in the analysis, but also the novel use of multilevel methodologies for studying tourist spending. As regards the variables related to level of spending, although other studies on tourism activities have focused on the place of spending (Abbruzzo et al., 2014b), type of activity (Wu et al., 2014), or time at which the activity occurs (Pettersson & Zillinger, 2011), little attention has been given to the relationship between these variables and spending. Finally, one of the main theoretical contributions of this work is the joint influence on spending of distance traveled and time, thus confirming the importance of using these two variables simultaneously as Zhong et al. (2019) have argued.
Regarding the characteristics of the tourism activity, the results have shown a higher probability of spending on non-cultural activities. While it is logical that high-spending tourists will visit cultural attractions regardless of the cost (Imler, 2011), many of these attractions are free of charge. However, they do stimulate spending on nearby non-cultural services (Dredge, 1999).
On the issue of timing, participants were less likely to spend money at the end of the stay. Travelers first visit the most appealing attractions (Seifolddini-Faranak et al., 2009) but their expenditure decreases as the trip progresses (van Loon & Rouwendal, 2017).
Turning to the issue of distance between the location of the tourism activity and the city center, while this effect was found to be non-significant, the interaction effect between this variable and the timing of the tourism activity was significant, in line with other authors (Zhong et al., 2019). At the beginning of their stay, tourists present more exploratory behavioral patterns (Lew & McKercher, 2006) as they seek to visit the most iconic places first (Dredge, 1999). As the visit comes to an end, they tend to remain in the city center, presenting more static behavior than at the beginning of the stay (Zillinger, 2007).
Conclusions
This study analyzed the likelihood of tourist spending in an urban-cultural destination using binary multilevel regression as well as tourist and tourism-activity characteristics as predictors. Four hypotheses were tested.
In general terms, the likelihood of spending was higher for non-cultural tourism activities (as opposed to the main cultural attractions) and during the first few days of the tourist’s stay. Tourists also presented more dynamic spending behavior in the early part of the stay because they were willing to make considerable effort to reach certain attractions at the beginning of the visit, sometimes traveling far beyond the city center. In contrast, their spending patterns became more static (closer to the city center) toward the end. Building on these conclusions, a number of management implications can be drawn.
As regards the implications of this work for the management of cultural micro-destinations, one of the main problems facing such destinations is low-cost tourism (Eugenio-Martin & Inchausti-Sintes, 2016). Specifically, our results show that tourists are more likely to spend money on the destination’s non-cultural elements. Therefore, if the aim is to increase spending per tourist in the destination, it is essential to improve these elements. However, such measures must be accompanied by better cultural services, since although the non-cultural elements involve higher expenses and thus generate higher profitability per tourist, it is the cultural elements that attract visitors. However, such measures must be accompanied by better cultural services, since although the non-cultural elements (i.e., the non-cultural-service offering) involve higher expenditure and thus generate higher profitability per tourist, it is the cultural elements that attract visitors.
Second, as concerns timing in relation to expenditure, the results underscore the need to inform travelers about the services and activities on offer at the destination prior to their visit arrival because the likelihood of spending is higher in the first few hours and days of the stay. This would lead not only to higher expenditure, but also more overnight stays, which is one of the main problems in this type of destination (de Menezes et al., 2008).
Third, we have shown evidence of an interaction between the timing of the tourism activity (earlier or later in the stay) and the distance of attractions and tourism services from the city center (Zhong et al., 2019). This finding is in line with the above implications regarding the economic sustainability of the destination as it points to the need to improve the distribution of spending in the destination and avoid overcrowding (which is highly advisable, in view of COVID-19). Indeed, this is also a profitable strategy because of the exploratory behavior tourists display during the early part of their stay. Moreover, it is important to assess whether this result can be extrapolated to urban-cultural macro-destinations.
This study has some limitations that could be addressed in future research. The primary limitation was that the gathering of travel data required participants to install an app on their mobile device and use it throughout their stay, which limited the sample size. Nevertheless, no relevant biases were identified in the study group compared to the general population of visitors to Granada, and the sample size was sufficient for guaranteeing the validity of the analysis.
Another limitation was that the app was not developed for iOS or Windows devices. Furthermore, the sample included only domestic tourists because the participants were required to maintain a continuous internet connection, while many international tourists prefer to keep their mobile data switched off because of the roaming fees that may apply. Although domestic tourists account for two-thirds of the city’s tourism, an interesting line of future research would be to replicate this work with international tourists.
Lastly, only those data provided by visitors via the app were analyzed. Nevertheless, each tourist recorded approximately eight tourism activities during their stay. We consider this an adequate sample of activity per tourist for a destination with a mean stay of 2.1 days.
Footnotes
Appendix
Declaration of Conflicting Interests
The author(s) declared no potential conflicts of interest with respect to the research, authorship, and/or publication of this article.
Funding
The author(s) disclosed receipt of the following financial support for the research, authorship, and/or publication of this article: This research was supported by (PID2019-110941RB-I00 / SRA (State Research Agency /10.13039/501100011033) and (B-SEJ-381-UGR18/Junta de Andalucía and FEDER funds).