
Abstract
National Systems of Entrepreneurship is defined as a nation’s resource allocation structure leading to entrepreneurial behaviors. However, the existing indicators of national framework conditions may have limitations in comparing the entrepreneurial efficiency of countries. Based on institutional theory, this paper presents a model to examine the efficiency of entrepreneurial activities stemming from the given conditions of a country and find benchmarks based on data envelopment analysis by scrutinizing inputs and outputs with static efficiency, dynamic efficiency, and strategic quadrant analysis. For this purpose, the study utilizes the Global Entrepreneurship Monitor dataset from 2015 to 2020 for 24 countries and presents the research questions regarding the differences in global entrepreneurial efficiencies, the countries for benchmarking, and the implications for entrepreneurial activities. The research implications suggest that diversifying the views on entrepreneurial efficiency may be valuable, and policymakers may focus on institutional conditions and entrepreneurial efficiency regarding the activity of early-stage businesses.
Keywords
Introduction
Entrepreneurs play a substantial role in a country’s economic development. They are the agents of creative destruction (Schumpeter, 1934), the epicenter of innovation (Ács, Audretsch, 1988), and actors of job creation and knowledge spillover (e.g., Blanchflower, 2000; Parker, 2009; van Praag & Versloot, 2007). Despite its positive contributions to the economy and academic recognition, still defining entrepreneurship is challenging. Various scholars have strived to make a consensus presenting different views on defining entrepreneurship (Anderson & Starnawska, 2008; Gedeon, 2010; Sendra-Pons et al., 2022) over time. It is an economic novelty-introducing (Schumpeter, 1934), firm-level behavioral disposition or individual cognitive attribute for business opportunity (e.g., Lumpkin & Dess, 1996; Shane & Venkataraman, 2000), or activities such as self-employment or new business creation (i.e., Reynolds et al., 2005).
Various academic debates about entrepreneurial theories and their academic background need further elaboration (Ács et al., 2014). Entrepreneurship is a complex phenomenon, and many determinants affect its occurrence. A country’s resource allocation systems are affected by the individual’s opportunity pursuit and new business creations, and these activities and outcomes are influenced by the country’s particular institutional specificities (Ács et al., 2014). Then, it could be assumed that individual entrepreneurial activities and the birth of early-stage businesses could be viewed as a result of the national systems at a country level (Ács et al., 2014; Inacio Junior et al., 2021; Tasnim & Afzal, 2018). Also, the concept of National Systems of Entrepreneurship (NSE) is central to assessing a country’s contextual conditions upon the entrepreneurial performance (Feldman, 2001; Sternberg, 2009), which influenced the policymakers to form a framework to understand entrepreneurial activities in the overall context. NSE, affected by the National Systems of Innovation (NSI) concept, is defined as a nation’s resource allocation system and structure where individual entrepreneurial behaviors and initiatives occur (Ács et al., 2014; Inacio Junior et al., 2021; Tasnim & Afzal, 2018). NSE focuses on systemic factors driving entrepreneurial activities (Ács et al., 2014), and it views the creation of businesses as the product of a process affected by combined factors that arise from the system (Inacio Junior et al., 2021). However, referring only to the rankings of global surveys that measure national institutional conditions where developed economies hold the entrepreneurial leadership position (the highest national potential for entrepreneurship) may not help compare the entrepreneurial activities of countries since those rankings are not designed to evaluate the simple efficiency such as the ratio between input and output (Inacio Junior et al., 2021). Top rankers in those global surveys may not always be efficient in generating new businesses, and they may also strengthen the belief that a national system with the highest ranking should be chosen as a benchmark (Bogetoft, 2012).
As such, quantifying and measuring conditions may not be sufficient in understanding the actual performance of a national system (Inzelt, 2004; Kuhlmann, 2003), and indices not considering the input-output efficiency may not fulfill the need to gauge the country’s entrepreneurial performance (Edquist & Zabala-Iturriagagoitia, 2015). Due to its substantial role in decision-making policies and nurturing socioeconomic development, academic interests and attention have examined the causal relationships between innovative entrepreneurial activities and a country’s international competitiveness (Ferreira et al., 2017). While valuable, the existing global entrepreneurship surveys focus on how supportive the entrepreneurial environment is and may have limitations in considering national characteristics and specificities to evaluate entrepreneurial activities’ efficiency as the output of national systems (Edquist & Zabala-Iturriagagoitia, 2015). The entrepreneurship literature has neglected to highlight efficiency by focusing on advanced economies with the best framework conditions, such as the US (Inacio Junior et al., 2021). Hence, examining how a nation’s entrepreneurial activities could be evaluated and compared apple-to-apple based on the “output” of the given systems would add value to the literature.
Consequently, this paper seeks to analyze entrepreneurship efficiency that is measured and calculated by considering inputs (the institutional factors that make up the national framework condition, such as evaluation results of mechanisms and processes) and the output (the entrepreneurial activities of a country represented by the creation of new businesses), enabling efficiency comparison at the global level and help to find comparable benchmarks. Benchmarking refers to exploring and utilizing other organizations’ best practices, services, and products to improve organizational performance (Main, 1992). However, there is a risk of taking a wrong benchmark that ignores NSE differences if policymakers only focus on entrepreneurial performance, such as the high birth rate of start-up businesses. In other words, it would be a reasonable approach to choose a benchmark country that produces optimum performance in a similar social and economic environment (Lins et al., 2003). Efficiency theory can be applied when selecting a benchmark with excellent output in a similar input structure.
Efficiency is defined as the relationship between input and output or evaluating the effectiveness of output factors for input (Ramanathan, 2003; Thornton et al., 1982). Efficiency is a significant concept in economics. Low efficiency could mean poorly performing system components that hinder overall performance (Tasnim & Afzal, 2018). The application of the efficiency theory could help find high-performance units and units with similar input conditions as benchmarks. Parametric and non-parametric methods can be considered for efficiency evaluation (Smith & Street, 2005; Stone, 2002). Data envelopment analysis (DEA) is a non-parametric statistical technique that measures efficiency by comparing relative inputs and outputs (Casu & Molyneux, 2003) and estimates the optimal level of output based on the mixed input elements (Smith & Street, 2005). In addition, the DEA model enables relative evaluation between DMUs (decision-making units) by comparing the empirical productivity frontiers in a similar environment and provides information on benchmarks with optimal performance. Efficiency or productivity focuses on selecting a target that achieves superior performance (e.g., services, outcomes, or activities) under a similar environment (e.g., socioeconomic factors, budget) (Shephard, 1970; Stone, 2002). The environment involves national contexts, levels of NSE, and stages of economic growth, such as GDP (Gross Domestic Product) per capita (i.e., Solow, 1957), where a country can foster entrepreneurship.
To date, global entrepreneurship research investigating entrepreneurial efficiency frontiers based on the institutional factors and early-stage entrepreneurs for the multi-faceted efficiency and longitudinal analyses as in this paper are somewhat limited. Some previous studies suggesting NSE constructs (regional framework conditions) such as output measures, attitude measures, and framework measures but without efficiency comparison (i.e., Ács et al., 2014) failed to examine longitudinal dynamics (e.g., Das & Kundu, 2019; Inacio Junior et al., 2021; Tasnim & Afzal, 2018) or set misleading causal relationships between inputs and outputs for efficiency analysis (i.e., Faghih et al., 2021). Overall, it is understood that global entrepreneurship literature further requires; (a) an efficiency study based on NSE, (b) empirical evidence for benchmarking, and (c) integrated efficiency measures that would advance future studies.
In order to reduce the research gap, this paper aims to contribute to the knowledge of country-level efficiency based on the NSE concept and provide a valuable integrated efficiency model for benchmarking based on empirical evidence gathered throughout the research. This paper mainly deals with the global entrepreneurship phenomenon from a “systemic efficiency” viewpoint, not “the superiority of entrepreneurial environment.” To this end, this paper focuses on cross-sectional (static) and longitudinal (dynamic) efficiency analyses. Also, the paper aims to assess global entrepreneurship competitiveness based on strategic quadrant analysis to compare each country’s position with peers. For this purpose, this study utilizes the Global Entrepreneurship Monitor (GEM) dataset for 6 years, from 2015 to 2020, for 24 countries. Consequently, this paper presents the following research questions; (a) What are the differences in entrepreneurial efficiencies of countries? (b) Who are the benchmarking countries and regions from a static and dynamic efficiency perspective? (c) What are the strategic implications of the efficiency-stability analysis result? This study is structured as follows. Section 2 deals with the literature review. Section 3 provides the research design and methodology. Section 4 deals with the specific result of the study. Section 5 discusses and summarizes the conclusion, and Section 6 provides theoretical and policymaking implications. Lastly, Section 7 presents suggestions for future research.
Literature Review
National Systems of Entrepreneurship
National Systems of Innovation (NSI) literature comprised the holistic relationships toward interactive, iterative, and cumulative innovation processes at a country level (e.g., Freeman, 1987; Lundvall et al., 2002). NSI’s institutional and structural focus inspired policymakers with a framework-based performance evaluation (Nelson, 1993) and made stakeholders consider the influence of regulatory intervention in national entrepreneurship (Inacio Junior et al., 2021). As a result, entrepreneurship literature has strived to study systemic context and system-level conditions of entrepreneurial action (Ács et al., 2014).
National Systems of Entrepreneurship (NSE) concept is about institutional resource allocation closely related to the entrepreneurial attitudes, abilities, and aspirations of individuals leading to the creation and operation of new businesses (Ács et al., 2014; Tasnim & Afzal, 2018). In summary, the NSE depicts national capacity leading to entrepreneurial activities and presents the dynamic, inter-correlated relationships among the multi-dimensional economic, social, and institutional frameworks (Ács et al., 2014), and also helps explain the national economic capability for potential entrepreneurial activities (Ács, Szerb, et al. 2014; Inacio Junior et al., 2021; Tasnim & Afzal, 2018). Further recently, the NSE concept evolved into the “entrepreneurial ecosystem” concept (i.e., Szerb et al., 2019), which views the regional ecosystem may affect different types of entrepreneurial activities (Kirznerian or Schumpeterian). A healthier ecosystem grants greater capacity for higher business formation, while a weak ecosystem leads to innovation of entrepreneurs due to a lack of support policies or economic support (Szerb et al., 2019). NSE also represents the dynamism and interaction among individual attitudes, aspirations, and abilities that stimulate resource allocation via new business creation and operation (Ács et al., 2014). In a country, individuals pursue entrepreneurial opportunities and evaluate the desirability and feasibility of the pursuit, which is also determined by a particular country’s institutional (contextual) factors, such as distribution of available resources, social norms, and attitudes (Ács et al., 2014). Some NSE output indicators evaluate the degree of emergence for the newly born entrepreneurs within a given population, and the most widely used example is GEM’s total early-stage entrepreneurial activity rate, TEA (Autio, 2007). Global entrepreneurship indicators such as GEDI (Global Entrepreneurship and Development Index) and GEI (Global Entrepreneurship Index) deliver multi-faceted information on the NSE performance at a system level by profiling each NSE. However, these indicator-based approaches might be less valuable in contemplating the relationships between input factors and the productivity or efficiency of analyzed units (Inacio Junior et al., 2021). Also, considering the countries with the highest values in NSE indicators as benchmarks could lead to severe bias or failure in decision-making processes (Bogetoft, 2012).
Understanding the system performance requires a holistic approach (Inzelt, 2004; Kuhlmann, 2003), and quantifying the national systems may not be sufficient if not followed by the productivity analysis considering inputs and outputs (Edquist & Zabala-Iturriagagoitia, 2015; Inacio Junior et al., 2021). It is reasonable to identify the national system’s performance based on the efficiency concept, where a unit’s productivity is based on the rate of a total of outputs by a total of inputs (Ramanathan, 2003). Also, it contributes to the existing literature to evaluate and review if a particular country’s institutional condition leads to the high efficiency of entrepreneurial activities. This paper seeks to provide an empirical analysis of entrepreneurial efficiency based on the relational assumptions among the national framework conditions and individual entrepreneurial outcomes as hypothesized in the NSE concept.
Global Entrepreneurship Efficiency Literature
Different studies suggested the methodological approach for efficiency comparison and analysis for global entrepreneurship. Bygrave et al. (2003) examined the correlation of entrepreneurship from a push-pull perspective in 29 countries participating in the GEM program, finding the relationship between opportunity-pull entrepreneurship and variables such as informal investment, entrepreneurial capacity, and perception of start-up opportunities. Sternberg and Wennekers (2005) provided empirical evidence that the role of entrepreneurial activity varies according to economic development stages. Also, they suggested that regional framework conditions, such as infrastructure and policies, need to be considered to investigate the regional entrepreneurial context. Lafuente et al. (2016), based on the data of 63 countries from 2012, tested the knowledge spillover theory of entrepreneurship using DEA, highlighting the relationship between NSE and knowledge spillovers leading to better efficiency. Tasnim and Afzal (2018) compared country-level efficiency based on the NSE perspective, hypothesizing that individual-level actions and country-level framework conditions interact. Das and Kundu (2019) compared countrywide efficiency based on GEDI and GEM datasets from 2012 to 2016 to understand small-sized enterprise performance. They utilized attitudinal parameters as independent variables and adopted dependent variables, such as the nascent entrepreneurship rate. Also, Lafuente et al. (2021) conducted an efficiency analysis using the non-parametric technique to figure out how country-level entrepreneurship relates to total factor productivity using global entrepreneurship data from 2002 to 2013. Faghih et al. (2021) investigated entrepreneurship “overall efficiency,” assessing national entrepreneurship attitude toward the entrepreneurship system, based on GEM 2018 data. Inacio Junior et al. (2021) conducted an efficiency analysis of the GEI data to demonstrate that the global entrepreneurial rankings may misinterpret NSE dynamics with the impression that countries showing higher national framework indicators are more productive in generating actual entrepreneurial activity. The authors claimed that there might be another perspective that prioritizes the efficiency of actual entrepreneurial activities. They pointed out that lower-positioned countries in framework conditions often present higher efficiency, producing more entrepreneurial business opportunities at the individual level.
The previous studies can be divided into three streams; (a) Research that dealt with the level of NSEs without efficiency analysis among countries (i.e., Ács et al., 2014), (b) Research that compared efficiency among countries without longitudinal or time-series consideration (e.g., Inacio Junior et al., 2021; Tasnim & Afzal, 2018), and (c) Research that needs further probe in setting input-output relationship (i.e., Faghih et al., 2021). In Faghih et al.’s efficiency study (2021), GDP is defined as the output of the overall entrepreneurial activity. Under the research setting, the author consequently prioritizes a country with less entrepreneurial activity (less input) and higher GDP (more output) as an efficient benchmark. If the researchers adopt this theoretical assumption, entrepreneurship-nurturing implications for developing economies with less-supportive institutional conditions might be limited. If a country’s NSE efficiency is defined by the total input-output rate (Ramanathan, 2003), the variable selection might be reconsidered (Inacio Junior et al., 2021). Consequently, providing objective logic for national entrepreneurial efficiency and criteria for global comparison benchmarks is expected to contribute valuable insights into fostering early-stage businesses.
Data Envelopment Analysis (DEA)
Data envelopment analysis (DEA) was proposed by Charnes et al. (1978). DEA is a part of the linear planning methodology and can evaluate the relative efficiency of each DMU (decision-making unit) by applying multiple input and output factors (Casu & Molyneux, 2003). DEA is a non-parametric statistical technique used in various fields because it can be applied even when the measurement scale of each variable is different (Barros & Alves, 2004; Nguyen et al., 2016; Wu et al., 2009). DEA evaluates units that produce maximum (weighted sum) outputs at minimum (weighted sum) input levels as efficient DMUs (Smith & Street, 2005; Stone, 2002). It informs the level of improvement and decrease of the input variable, has the advantage of expressing the growth potential of the output variable numerically, and is used in various research fields (e.g., Nguyen et al., 2016; Wu et al., 2009).
DEA directly compares efficient and inefficient DMUs and provides information on which DMUs can be benchmarked to improve efficiency. It has two models, input-oriented and output-oriented. After fixing the output value, the former calculates the efficiency index based on the input factor values, focusing on the input reduction. The latter fixes the input factors and pays attention to how much the output can be improved. In addition, DEA has CCR (Charnes-Cooper-Rhodes) model (Charnes et al., 1978) that assumes the Constant Return to Scale (CRS) and BCC (Banker-Charnes-Cooper) model (Banker et al., 1984) based on Variable Return to Scale (VRS) assumption.
Technical Efficiency (TE)
The first concept proposed in efficiency research was Technical Efficiency (TE). TE calculates the efficiency index through relative comparison using input-output data and assumes the constant return to scale. Technical efficiency theory was first introduced by Farrell (1957) and later rediscovered by Charnes et al. (1978) and subsequently re-labeled as CCR-efficiency under DEA (Cooper et al., 2000). The CCR model measures TE, the maximum output capacity for input, assuming that the scale value is invariant. However, this model works with DMUs operating at the optimal scale and has the disadvantage of not distinguishing between Scale Efficiency (SE) and Pure Technical Efficiency (PTE).
Pure Technical Efficiency (PTE)
The BCC model calculates the efficiency assuming that production constraints occur in the input-output relationship. The BCC model was proposed to overcome the shortcomings of the CCR model (Banker et al., 1984), reflecting the variability of returns to scale. It is a concept that examines the change in the outputs when the scale extends while keeping the ratio of input factors constant. BCC considers Increasing Return to Scale and Decreasing Return to Scale, yielding Pure Technical Efficiency of DMUs.
Scale Efficiency (SE)
Scale Efficiency (SE) is calculated from TE value (measured by CCR model) divided by PTE value (measured by BCC model). SE value of “1” means the optimal scale state, and if it is less than “1,” the current input and output are not achieving scale efficiency. SE value could provide the direction of efficiency improvement by identifying whether the cause of the inefficiency of the DMU is purely technical or in terms of scale through the relationship between PTE and SE.
DEA/Window Analysis
Although DEA has been used in various analytical studies due to its cross-sectional characteristics, it has not frequently been applied to longitudinal research. This study utilized the DEA/Window analysis, which complements the cross-sectional characteristics of DEA. Through this method, it is possible to evaluate how the performance of the same DMU changes according to time, and DMUs are analyzed and divided into several windows of multiple periods (Charnes & Cooper, 1984). In this analysis, individual DMUs can be evaluated by referencing other DMUs belonging to different periods if the primary input-output relationship does not change over time.
For analysis, a researcher determines the window width (p) after collecting the longitudinal data for a certain period. The number of windows (w) is “k-p+1.” After analyzing the first (p) period, the first analytical unit (e.g., year, month) is replaced by the new unit to analyze the next window. This process is repeated until the final period k (see Table 1). The efficiency trend and stability of each DMU can be analyzed by assessing the efficiency of each window. The DEA model used in this study is as follows (see Table 2).
DEA/Window Analysis Formula.

Note. k: time, p: window width, w: # of windows.
DEA Models Used in This Study.

Method
Research Design
This study evaluated global entrepreneurship’s static and dynamic efficiency and explored the benchmarking countries for entrepreneurship efficiency. The analytical procedure is as follows. First, the data collection process chose the primary data for the research. Second, the pre-processing stage identified the input and output variables. Third, static efficiency analysis calculated the technical efficiency (TE), pure technical efficiency (PTE), and scale efficiency (SE) of DMUs. Fourth, dynamic efficiency analysis covered the longitudinal examination using the DEA/Window method. Fifth, the efficiency-stability matrix based on quadrant analysis was drawn, grouping the similarly-characterized countries. The overall research framework is presented below (see Figure 1).

Research design.
Data Collection
This study utilized the Global Entrepreneurship Monitor (GEM) dataset from 2015 to 2020. GEM is a comparative study tracing entrepreneurial thoughts, behaviors, and activities having over 150,000 participants from over 50 countries (GEM, 2020). The research consists of Adult Population Survey (APS) and National Expert Survey (NES) and provides primary data on the competitiveness of each country’s NSE by surveying the adult population and experts (Das & Kundu, 2019). The countrywide dataset from 2015 to 2020 consisted of 335 NES and 320 APS instances. The 24 countries consecutively participated throughout the whole period (6 years, the time frame of this research) were chosen as DMUs, and a total of 144 data instances were finally collected for analysis. As for the DMUs, four countries were from Latin America and Caribbean (17%), fourteen were from Europe and North America (58%), two were from Africa (8%), and four were from Asia and Oceania (17%) (see Table 3).
Regional Composition.

Note. Countries consecutively participated from 2015 to 2020.
n = 24.
Data Processing
This study adopted a computational analytical tool to eliminate human errors. Efficiency Measurement System (Scheel, 2000) was utilized as a reliable DEA statistical tool (Afzal & Lawrey, 2012). This package provides the CCR, BCC, DEA/Windows, and Malmquist analysis.
Theoretical Foundation and Variable Selection
A country’s institutional factors (framework conditions) are known to be fundamentally correlated to formal structure/the norms of regulatory bodies and cultural/social practices while playing a decisive role in promoting individual entrepreneurial behaviors (Bianchi et al., 2015; Boudreaux et al., 2019; Bylund & McCaffrey, 2017; Sendra-Pons et al., 2022). Therefore, it is of theoretical value and interest to view the entrepreneurship phenomenon from an institutional theory standpoint regarding the remarkable contextual influence on promoting entrepreneurial activities stemming from the institutional environment (e.g., Bruton et al., 2010; Sendra-Pons et al., 2022; Sinha et al., 2019). The institutional theory assumes that the regulatory, social, and cultural elements affect organizations to promote legitimacy and be poised for survival (e.g., Ahlstrom & Bruton, 2003; Fang, 2010). The theory has been broadly accepted as a theoretical foundation in various research topics, recently widening its presence in studying determinant factors leading to the success of new entrepreneurial activities (e.g., Bruton et al., 2010; Peng, 2001). The institutional environment, such as accountability, effectiveness, and quality of related authorities, policies, and support organizations, may enhance or hinder the development of businesses (Sendra-Pons et al., 2022). In this regard, the paper hypothesizes and selects variables based on the assumptions from the institutional theory point of view to build an efficiency model. Determining valid inputs and outputs is substantial in analyzing efficiency (Chan & Karim, 2012). The following variables were selected to create the efficiency model. The variables were determined by the consensus of three researchers and 2 Ph.D. holders after a peer review for validity. Finally, three input variables and one output variable were selected (see Table 4).
Variables.
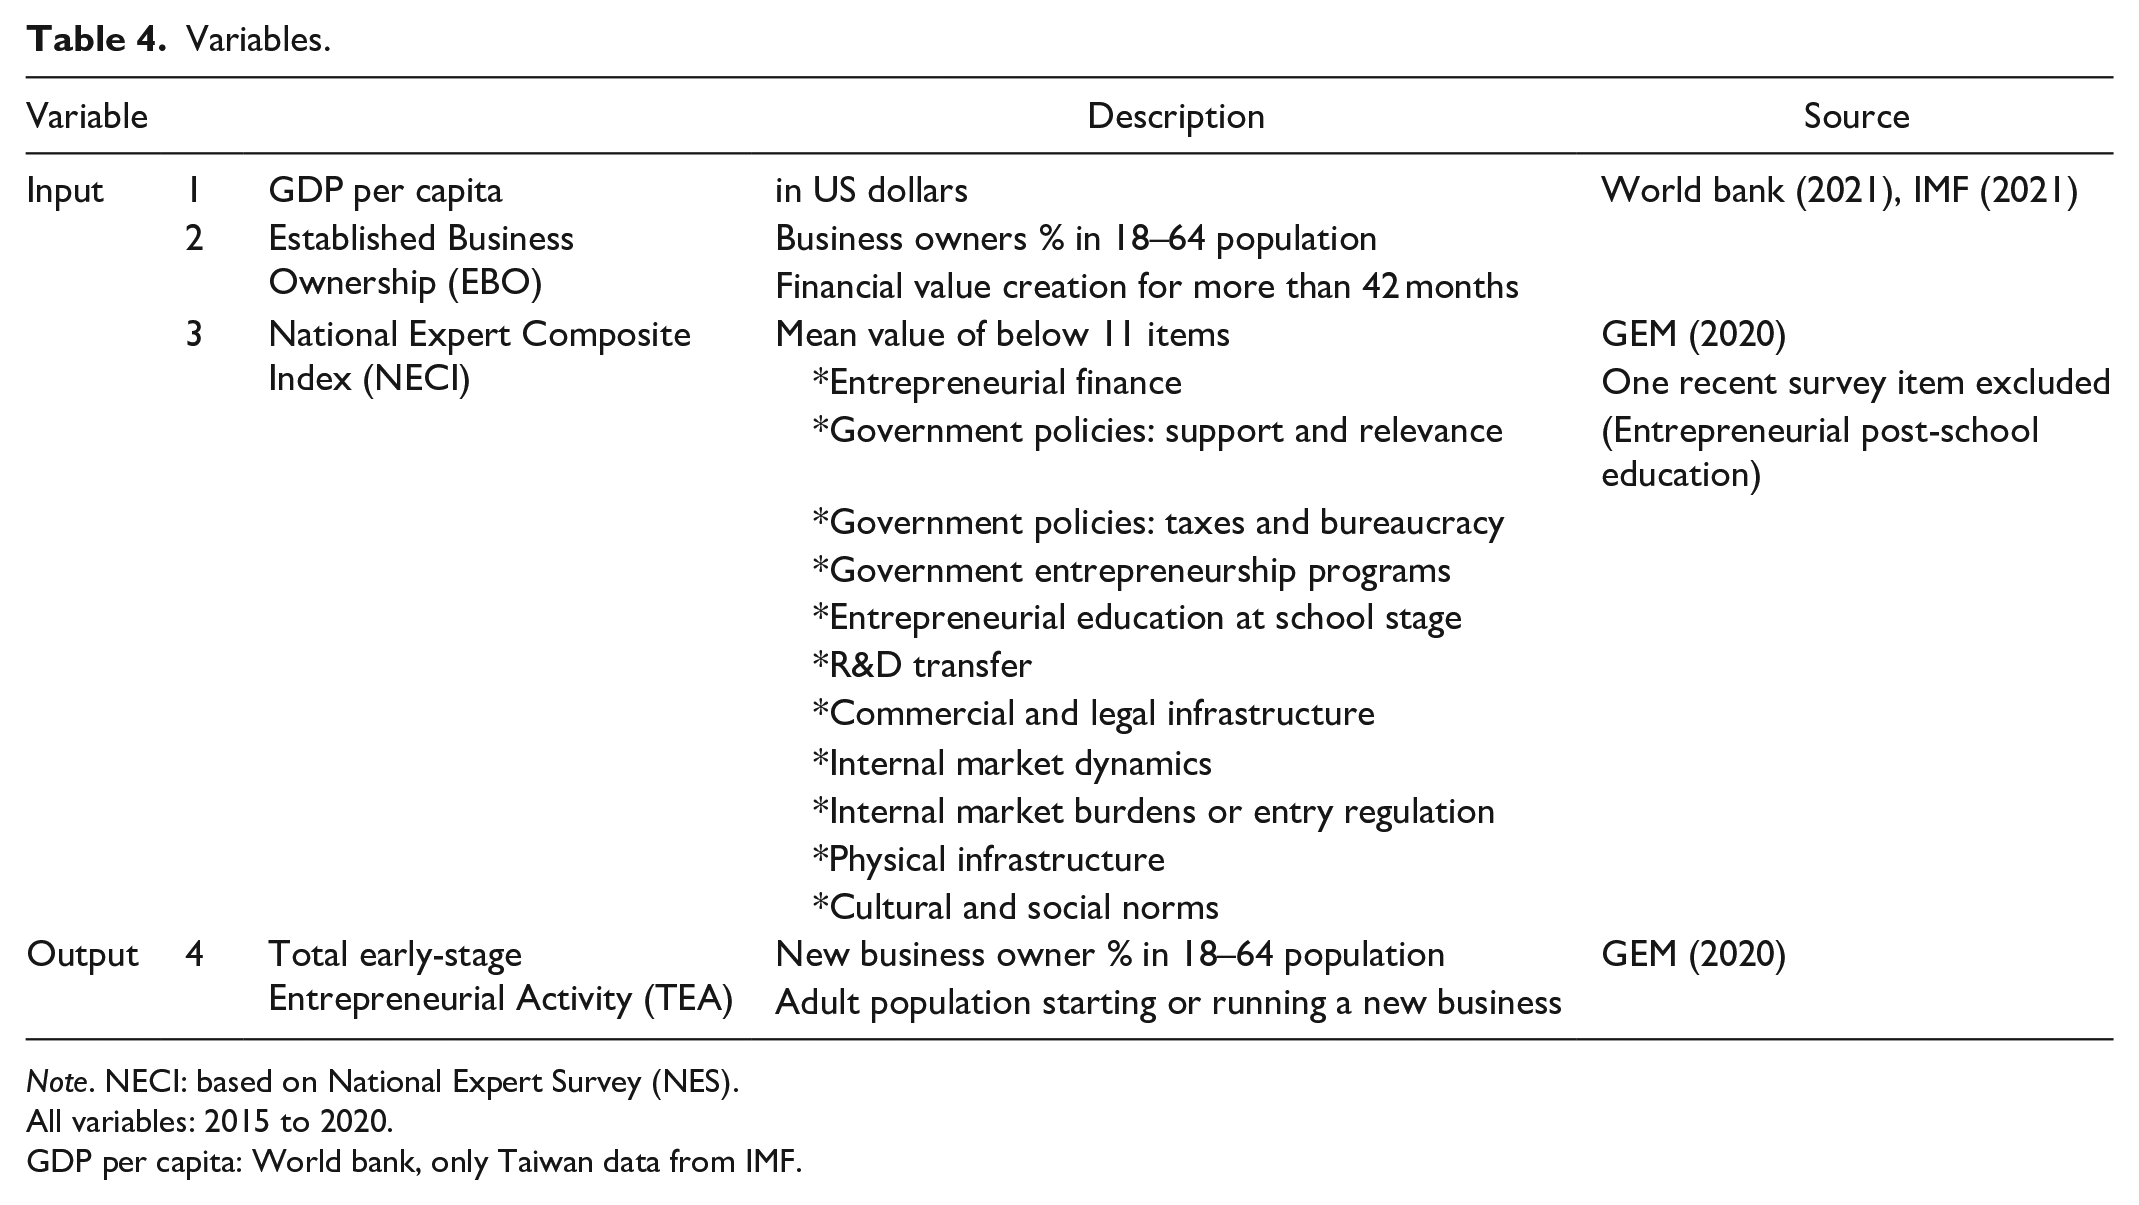
Note. NECI: based on National Expert Survey (NES).
All variables: 2015 to 2020.
GDP per capita: World bank, only Taiwan data from IMF.
Output Variable
Input Variable
The total number of inputs and outputs in DEA should be limited to a minimum to avoid unrealistic evaluation results. The number of input and output factors is closely related to the number of DMUs, and for validity, the number of DMUs should be over twice the product of the number of input and output factors (Banker et al., 1984). This study chose three inputs, one output factor, and 24 DMUs, satisfying the condition.
The descriptive statistics of the variables are as follows (see Table 5). From the data for 24 countries from 2015 to 2020, the mean of GDPPC was 30,489 USD (min: 1,606, max: 116,654). For NECI, the mean value was 2.8 (min: 2.1, max: 3.6), and the EBO rate was 7.9% (min: 1.5, max: 20.3). TEA, the output variable, was 11.3% on average (min: 1.9, max: 36.7).
Variable Descriptive Data.
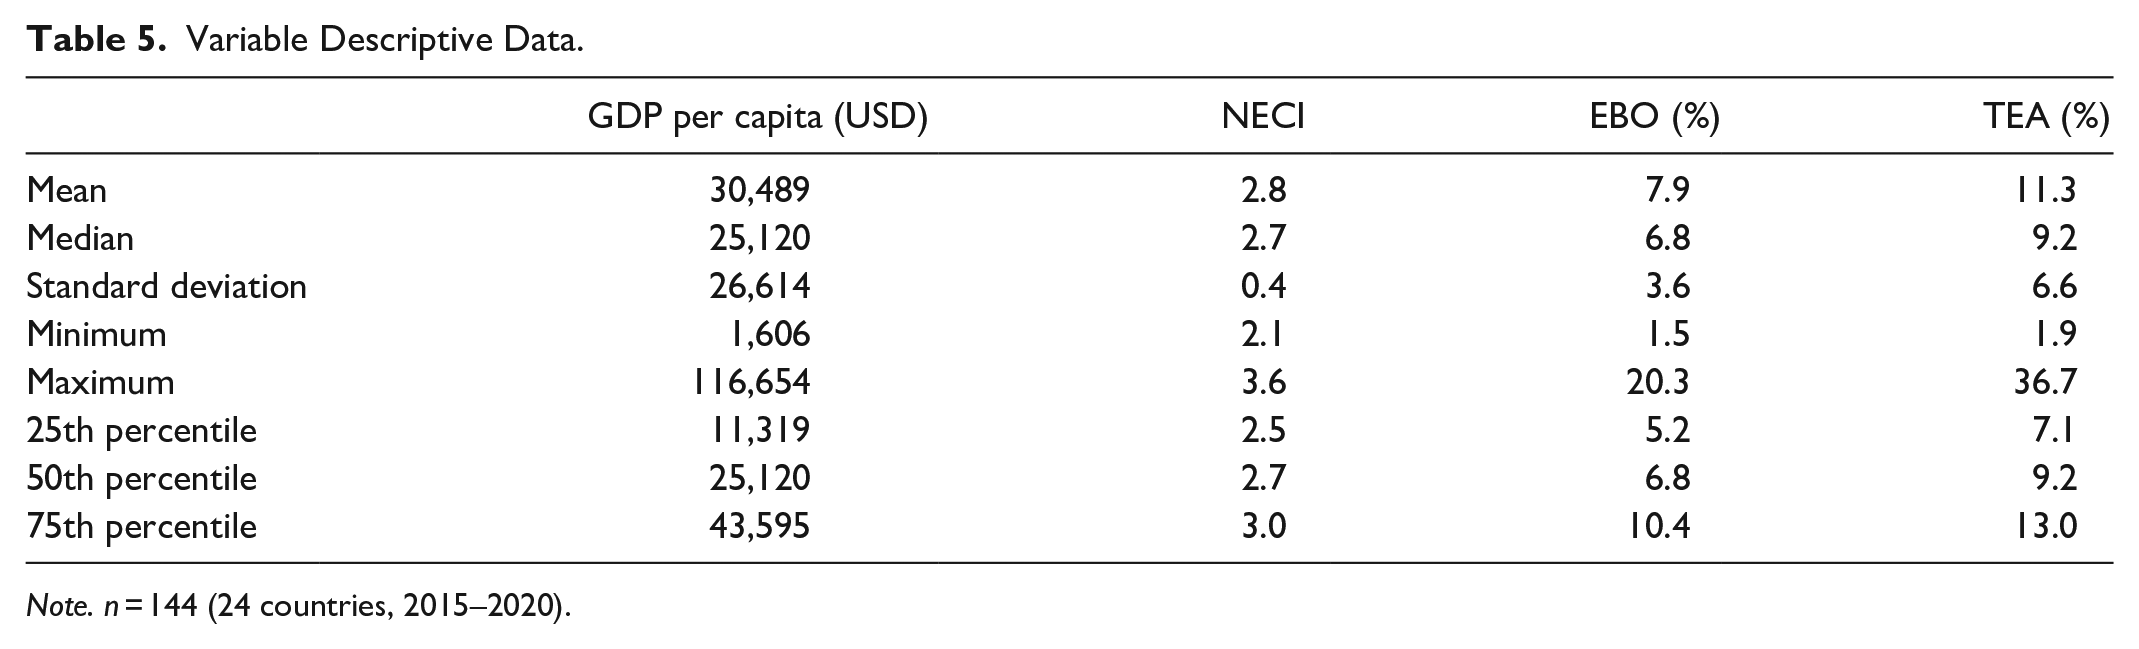
Note. n = 144 (24 countries, 2015–2020).
Efficiency Analysis
Static efficiency analysis
An output-oriented model was applied to all analyses in this study. As discussed previously, national framework conditions are inputs, and initial entrepreneurship activities are output. Under these assumptions, reducing the inputs for efficiency (input-oriented model) is not reasonable, and improving the output under given conditions would be adequate. In addition, since the efficiency level cannot be ranked among the efficient DMUs whose index is 1 (100%), the super-efficiency model (Andersen & Petersen, 1993) is applied to rank efficient DMUs. The output-oriented values are converted into inverse numbers to make comparison easier. Static analysis proceeds in three steps; (a) TE analysis by CCR model, (b) PTE analysis by BCC model, and (c) SE analysis calculated by TE/PTE.
Dynamic efficiency analysis
DEA/Window analysis is a valuable method to evaluate how the performance of the same DMU changes over time. Enabling comparative evaluation over time can allow researchers to focus on the longitudinal side of the data. In this study, dynamic efficiency analysis is performed to measure changes in the effectiveness of entrepreneurial activities. The period is 6 years (2015–2020), and the window width (p) is three based on the formula of ((k + 1)/2) ± 1/2, and through four windows, changes in the efficiency were measured. In addition, by calculating the mean, standard deviation, LDY (largest difference between scores in the same year), and LDP (largest difference between scores across the entire period) within the analysis period, the entrepreneurship performance based on the efficiency-stability of each country was calculated.
Strategic quadrant analysis
This study also proposes a strategic quadrant analysis based on the stability (LDP value) and the mean efficiency of each DMU based on the dynamic efficiency results. Unlike the existing literature, this study adds value by including another performance axis, entrepreneurial stability, suggesting a matrix framework to compare the relative positions with peers.
Results
Static Efficiency Comparison
Global entrepreneurship benchmarking: TE
TE analysis compares entrepreneurship efficiency and ranks the efficiency levels, suggesting benchmarks among reference DMUs. The results are as follows (see Table 6). In 2015, five DMUs were found effective in entrepreneurship activities (Colombia, India, Guatemala, Chile, and Brazil), and Colombia was the most efficient and referenced country (inversed super-efficiency θ = 1.578, referenced = 16). As of 2016, three countries were found efficient, with Colombia being the most efficient DMU (θ = 1.311, referenced = 20). India was second (θ = 1.270, referenced = 2), and Guatemala was third (θ = 1.004, referenced = 2). In 2017, four DMUs (Guatemala, Israel, Egypt, and Chile) proved themselves as efficient, and the most efficient was Guatemala (θ = 1.676, referenced = 8). The most referenced was Chile (θ = 1.080, referenced = 15), ranked fourth in efficiency, followed by Israel (θ = 1.535, referenced = 12).
Entrepreneurship Technical Efficiency (2015–2020).

Note. CCR & SE (super-efficiency): inverse number / Bold: SE (CCR = 1.000).
Regarding 2018 results, two countries were found to be efficient; Guatemala (θ = 1.805, referenced = 13) and Colombia (θ = 1.221, referenced = 20). In 2019, four countries were efficient (Guatemala, Colombia, Chile, and India). Same as the previous year, Guatemala (θ = 1.442, referenced = 2) was the most efficient. Colombia (θ = 1.433, referenced = 15) and Chile (θ = 1.364, referenced = 15) were the most referenced. Concerning the TE results in 2020, two countries were picked as efficient DMUs; Colombia (θ = 1.913, referenced = 20) and Guatemala (θ = 1.054, referenced = 17).
The overall TE analysis results demonstrate that Guatemala has been an efficient unit throughout the whole period (six times). Four countries (Guatemala 6, Colombia 5, Chile 3, and India 3 times) were selected as efficient DMUs over three times (17% of the entire countries). Three countries other than India belonged to Latin America and Caribbean, showing high competitiveness in entrepreneurial activity efficiency.
Global entrepreneurship benchmarking: SE
SE was calculated as the second step of the static efficiency analysis. SE value smaller than one means that scale inefficiency exists. From the relationship between PTE and SE, a researcher can suggest directions for efficiency improvement by identifying whether the cause of the inefficiency is a purely technical issue or a scale issue. For example, in the SE results of 2020, six DMUs have PTE values greater than SE values out of 24 countries (Chile, Croatia, Egypt, India, Italy, and Morocco). It is understood that these countries can improve efficiency through economies of scale (SE) rather than resource conversion (PTE) for entrepreneurial activities (see Table 7).
Entrepreneurship scale efficiency (2015–2020).

The five DMUs with the highest mean SE values over the whole period were Guatemala, Colombia, Chile, Sweden, and United Kingdom. On the other hand, the bottom five countries were Morocco, Croatia, Italy, Egypt, and the Slovak Republic. The year with the highest number of efficient DMUs was 2015 (6 countries, % of efficient DMU = 25.0%). On the other hand, the years with the lowest number of efficient DMUs were 2018 and 2020 (2 countries, % of efficient DMU = 8.3%).
The regional analysis results are as follows (see Table 8). Latin America and Caribbean area was the highest region in TE and SE except for 2016. Africa has been consistently effective in terms of PTE for 6 years.
Entrepreneurship scale efficiency by region (2015–2020).

Note. Efficiency: mean value of 24 DMUs.
Overall efficiency averaging of all countries is as follows (see Figure 2). It can be seen that TE, PTE, and SE have been on a downward trend since 2015.

Entrepreneurship efficiency: TE, PTE, SE (2015–2020).
Dynamic Efficiency Comparison
DEA/Window analysis
A dynamic efficiency analysis was performed to measure the efficiency change over time. DEA/Window analysis, which complements the cross-sectional characteristics of DEA, enables longitudinal comparisons among DMUs by evaluating the performance based on smoothed average values. The analysis period is from 2015 to 2020, and the window width (p) is set to 3, with four windows (2015–2017, 2016–2018, 2017–2019, and 2018–2020). This analysis included the mean value of 24 countries that presents the average value of entrepreneurial efficiency for all countries included in the same time frame, which is a window of 4 years (Mean A), and the mean value of 4 windows that can show a smoothed efficiency of a country over time (Mean B). The value of 0.471 shown where the x-axis (Mean A) and y-axis (Mean B) meet is the average efficiency of all DMUs within the entire window period (see Table 9).
DEA/Window Analysis.

Note. Countrywide mean of each window’s CCR-output oriented model value, inversed.
Mean A suggested the average value of all DMUs’ efficiency scores in the same window. The overall average of Mean A was 0.471, and Window 2 (2016–2018) showed the highest efficiency (0.523). The window efficiency slightly improved in the Window 2 period, then showed a downtrend passing Windows 3 and 4. It could be interpreted that the overall global entrepreneurship efficiency trend has declined since the Window 2 period (2016–2018), and the dynamics, drivers, and relevant contextual factors that soared the global entrepreneurial efficiency during this period may require further research. Mean B can be interpreted as representing the continued overall efficiency of each DMU over 6 years. According to the result, Latin America and Caribbean DMUs, such as Chile, Colombia, and Guatemala, were among the top three countries.
Four additional indicators were calculated based on the above results (see Table 10). First, the four windows’ average value and standard deviation were calculated. Second, LDY (largest difference between scores in the same year) means the maximum value among the differences in efficiency values for each country in the same year. Third, LDP (largest difference between scores across the entire period) is the difference between maximum and minimum scores of a country within the entire period. Through these indicators, the efficiency-stability of entrepreneurial performance can be identified.
Dynamic Efficiency Analysis.

Note. SD: Standard Deviation (population); LDY: Largest Difference between scores in the same Year; LDP: Largest Difference between scores across the entire Period.
Efficiency (CCR) mean: 0.471, Stability (LDP) mean: 0.266.
Guatemala showed the highest efficiency (0.940), and Italy had the lowest value (0.179). The DMU with the lowest inter-window standard deviation was Switzerland (SD = 0.010), and Israel showed the largest value (SD = 0.162). Greece was the DMU with the lowest LDY (0.028), which showed stable entrepreneurship performance. The Slovak Republic indicated the largest LDY value (0.300). DMUs with low LDP values were Switzerland (0.076) and Greece (0.113), which showed the slightest change in efficiency during the entire period. On the other hand, Israel showed the most significant change (0.642).
Efficiency-Stability Model
A strategic quadrant matrix analysis presented efficiency-stability axes based on dynamic efficiency results (see Figure 3). A model with four quadrants consisting of the X-axis (Mean, average = 0.471) and Y-axis (LDP, average = 0.266) was created. DMUs belonging to Quadrant 2 (High efficiency–Low stability) and 3 (Low efficiency–High stability) need to balance their framework conditions to pursue efficiency and stability. Seven countries are in Quadrant 2, and twelve are in Quadrant 3. Three countries (Guatemala, Brazil, and Croatia) located in Quadrant 1 with higher average entrepreneurial efficiency and stability are considered benchmarks for DMUs in other quadrants. DMUs in Quadrant 1 are considered to have shown higher-than-average entrepreneurial efficiency continuously regarding their framework conditions. The two countries included in Quadrant 4 display low efficiency and low stability. These countries may need attention and efforts at the national level to promote and foster entrepreneurship activities.

Entrepreneurship efficiency-stability model.
Conclusion
This paper aimed to present a diverse way to understand entrepreneurial activities as the outcome of institutional conditions and benchmark for country-level efficiency, based on the NSE concept from a “systemic efficiency” viewpoint. As a result, this paper presented research questions regarding; (a) differences in entrepreneurial efficiencies at the global level, (b) the countries for benchmarking, and c) the implications for entrepreneurial activities. The study conducted static/dynamic efficiency analysis and strategic quadrant analysis for 24 countries throughout the 2015 to 2020 period. The results are summarized as follows.
From TE results of static efficiency analysis, Guatemala was an efficient DMU with outstanding input-output competitiveness regarding regional framework conditions among peer countries. Additionally, from the SE point of view, it was confirmed that the DMUs - such as Guatemala, Colombia, and Chile - in Latin America and Caribbean countries showed higher efficiency, leading to the birth of nascent and new entrepreneurs. The dynamic efficiency analysis results also revealed that the efficiency of countries in this region, such as Guatemala, was outstanding. The setting of national direction or priority in policymaking might differ by country when weighing the two axes provided by this study (efficiency or stability). However, when viewed from a global entrepreneurship perspective, the benchmarking focus could be on efficiency first, prioritizing the activity of newly born businesses. Then the strategic priority could be thought of in the order of Quadrants 1, 2, 3, and 4. This research was based on the theoretical assumptions of the institutional theory and determined input variables such as (a) the economic development stage of a country (GDP per capita), (b) overall national framework conditions (NECI), and (c) the vitality of existing businesses (EBO). TEA was selected as the output variable. Different from the conclusions of previous literature that centered on the superiority of regional framework conditions (i.e., Ács et al., 2014) or that included the degree of economic development stage (GDP) as an output variable (i.e., Das & Kundu, 2019), this study highlighted the output of actual entrepreneurial activity stemming from the given conditions. The US, having been considered to have the highest level of NSE already, also proved itself as a productive DMU in the strategic quadrant analysis in this study. However, in terms of efficiency, which is output versus input, it could be understood that developing economies have higher efficiency than advanced economies with better framework conditions.
The higher efficiency in Latin America and Caribbean countries might be attributed to relative resource constraints, limited access to business, financial infrastructure, or the inefficiency of the formal labor market (GEM, 2019). However, at the same time, considering how to foster initial entrepreneurial activities as a significant axis of economic development despite the limitations of given national systems conditions would provide academic and policymaking insight on finding proper benchmarks.
Implications
This study suggests several theoretical implications. First, the paper synthesized the National Systems of Entrepreneurship concept and efficiency theory to provide a novel way of assessing the national entrepreneurial activities based on the institutional theory. Having excellent infrastructure for entrepreneurship and making as many early-stage businesses as possible are two different issues. This study does not merely compare national NSEs but advances a perspective that might demonstrate the causal relationship of a national entrepreneurial system. For example, Ács, Autio, et al (2014) presented GEDI as a valuable framework for NSE. The indicators under the concept depict how a nation’s framework conditions are prepared and might be adequately viewed as a process rather than an output. It would be challenging to consider the evaluation results of the institutional contexts as a country’s “systemic efficiency.” However, this paper, standing on a simple efficiency relationship between major factors, has further enhanced the theoretical value of NSE by synthesizing the efficiency theory to examine what kind of entrepreneurial result the environmental and contextual inputs have created. The study contributes to the literature by expanding and diversifying the views on entrepreneurial efficiency by highlighting TEA, the less studied output under NSE assumptions, as a dependent variable that may help establish a feasible efficiency comparison model based on DEA.
Second, a multi-faceted evaluation model that could compare global entrepreneurship efficiency was presented. This research suggested a novel, integrated methodology using realistic input-output variables. This approach applies to countries at various stages of economic development looking for a similar-level benchmark. This study revealed three evaluation methodologies to consider for an overall picture; (a) static analysis, (b) dynamic analysis, and (c) strategic quadrant analysis. Few studies on global entrepreneurship brought intensive evaluation perspectives to date to identify the comparable positions of DMUs in a global landscape based on an efficiency evaluation. In particular, the strategic quadrant analysis framework presented evaluation axes, efficiency-stability, presenting two essential perspectives that should be considered for entrepreneurship policymaking. The findings of this study suggested implications for resource management and the significance of measuring efficiency from multiple perspectives.
The policymaking implications are as follows. This study provides a valuable reference for entrepreneurship policy planning and implementation. Setting a reasonable benchmark is essential, and only evaluating a benchmark’s framework conditions would hinder the policy’s effectiveness. Benchmarking refers to exploring and utilizing other organizations’ excellent practices, services, and products (Main, 1992). Selecting a country with excellent entrepreneurial efficiency in a similar socioeconomic environment is reasonable considering national differences in institutional contexts such as framework conditions (Lins et al., 2003).
Unlike previous literature, this study suggested a dynamic efficiency analysis (longitudinal) methodology and a cross-sectional (static) perspective to find a benchmark that shows outstanding output in a similar input structure. In addition, this study presented the global entrepreneurial frontier by including multiple aspects of entrepreneurial efficiency with regional analyses. Entrepreneurship-supporting entities and policymakers in each country will be able to get insight into improving their national infrastructure, which would eventually lead to the birth of initial stage entrepreneurs based on the findings presented in this study.
Limitations and Future Research
This study has several limitations. First, the judgment on entrepreneurial efficiency may differ depending on the viewpoint. However, critical views see entrepreneurship as a national phenomenon beyond mere new business creation rate (Ács et al., 2014; Lafuente et al., 2021). Also, this paper did not clarify the motivation for early-stage entrepreneurs in the research design. Studying decisive factors for necessity-driven and improvement-driven entrepreneurship (GEM, 2021) may interest researchers. Second, there may exist more substantial factors that influence early-stage entrepreneurs. The selection of input factors is crucial in creating a DEA model (Soares de Mello et al., 2008), which affects the overall assessment. Future researchers could apply hypotheses or assumptions different from those applied to this study and suggest a new model. Third, differences in the socio-cultural environment could be considered. Cultural factors may affect businesses and entrepreneurial activities (i.e., Hofstede, 1984). Studying these relationships may also contribute to advancing entrepreneurship literature. Fourth, this study did not fully consider the economic differences among countries. Even between two countries having similar GDP levels, the composition of the working-age population or the economy’s job-creating abilities may differ. Alternatively, in an economy where decent jobs are continuously provided, the desire to start a business may be limited. Lastly, the shortcomings of DEA modeling (oversimplifies the complicated phenomenon based on the input-output efficiency) may still exist. Future scholars may want to consider a more sophisticated research design using other models.