
Abstract
In the past two decades, China has implemented various industrial policies involving all aspects of national economic development. At the same time, the number of patent applications in China has rapidly grown to become the largest in the world. Is industrial policy the one force of China’s patent explosion? We investigate the influence of industrial policy on firm innovation outputs using data from the text of Five-Year Plan and Chinese listed firms during 2008 to 2020. Based on the negative binomial regression model, we find that industrial policy has a positive effect on the number of patent applications. Further tests show the varying relationship between industrial policy and firm innovation with industry heterogeneity. We also find that industrial policy increases the number of patent applications by easing financing constraints and strengthening competition. Conclusion of this study provides corresponding theory and decision basis for the implementation of industrial policy in emerging markets.
Introduction
Since China’s reform and opening up, the country’s economy has achieved rapid growth for more than 40 years (Luo & Xie, 2020), and industrial policy is viewed as one of the key reasons for the rapid growth (Barbieri et al., 2012; Chen & Xie, 2019; Lu, 2001). Meanwhile, China’s innovation has also experienced a rapid development, especially the number of patents. In the past two decades, China’s innovation has also experienced rapid development, especially the number of patents. According to the relevant report of the World Intellectual Property Organization in 2012, since 2011, the State Intellectual Property Office of China has become the organization that receives the largest number of applications for invention patents, utility models, and designs in the world. In 2020, companies accounted for 66% of patent applications. However, studies about the impact of industrial policy on firm innovation outputs are relatively limited.
Firm innovation is the main body of innovative activity. The improvement of firm innovation will finally bring an improvement of industrial and national innovations. However, market failures in firm innovation activities are often due to insufficient innovation. Industrial policy is recognized to play an important role in theoretically relaxing market failures in innovation activities (Arrow, 1962; Murphy et al., 1989; Rodrik, 2004). Some studies have evaluated the effectiveness of industrial policy from the view of innovation (Criscuolo et al., 2019; Falck et al., 2010; Zhao et al., 2019).
Using data of Chinese Five-Year Plans and firms’ number of patent applications, this study investigates the impact of industrial policy on firm innovation outputs. Employing a negative binomial regression model, we found that firms encouraged by industrial policy have more patent applications, regardless of the number of invention or non-invention patents. This result is robust in the case of changing the data, changing the model, and adding control variables. Moreover, by adding interactions of industrial policy and policy instruments (government subsidies, tax breaks, and credit holiday) into the basic model, we found that policy instruments play a role in the relationship between industrial policy and firm innovation outputs. We also did a grouping regression through industrial heterogeneity and found that the impact of industrial policy differs across different industries. We further used a mediation effect model to examine the mechanisms. The results show that industrial policy promotes firm innovation outputs by easing financing constraints and increasing market competition.
The work closely related to this research is the study of Zhao et al. (2019). They evaluated the impact of a specific policy and aimed to promote the new energy vehicle industry on firm innovation. They found that the “Ten Cities Thousand Vehicles Project” has a significant positive effect on the number of invention patent applications in listed firms. Compared with their study, the current research innovates in the following aspects. First, we evaluate the impact of industrial policy using the “Five-Year Plan” because it has been implemented for a long time and has evident Chinese characteristics. The Five-Year Plan is recognized to be the central in the China’s system of industrial policy. The Chinese government began to formulate and implement the Five-Year Plan to stimulate the economy since the 1950s. The government points out some industries to encourage in every Five-Year Plan based on the national conditions and future layout of industries. Second, we study the mechanisms of industrial policy on firm innovation outputs.
We contribute to the existing literature in several aspects. First, we shed additional insight into the government’s role in promoting firm innovation. This study investigates the impact of industrial policy on the innovation outputs of firms, which is largely overlooked by the evaluation literature. Most previous studies gage the effects on innovation inputs (e.g., Boeing, 2016; Levy & Terleckyj, 1983; Wallsten, 2000). Second, this study is a vital supplement to the research field of industrial policy and firm innovation (Liu & Ma, 2020; Rodrik, 2009). Given that firm innovation is often restricted by the lack of resources and motivations, we propose financing constraints and market competition mechanisms and examine the two mechanisms using mediation effect models.
Third, we expand the research framework of industrial policy by considering industry- and firm-level measures (Zhu and Lin, 2021; Chen, Li et al., 2017; Aghion et al., 2015). Apart from analyzing the impact of the “Five-Year Plan” on firm innovation outputs, we also added policy instrument variables to measure the strength of industrial policy support for a comprehensive analysis. Finally, our study enriches the relevant literature on patent behaviors (Dang & Motohashi, 2015; Hu & Jefferson, 2009; Li, 2012). We use the complete patent data of Chinese listed firms as our main data and find that industrial policy plays an important role in promoting the amount of patent. This result somewhat helps interpret the surge of patents in China. Unlike most existing literature, we focus on industrial enterprises rather than listed firms. The number of industrial enterprises is larger than that of listed firms. Thus, the former can better fit the true firm patent pattern rather than the latter.
The rest of the paper is organized as follows. Section 2 reviews the related literature. Section 3 develops the hypothesis. Section 4 describes our dataset, variables, and model. Section 5 presents the main results. Lastly, Section 6 concludes the study and presents policy recommendations.
Literature Review
Literature of Industrial Policy and Firm Activity
Industrial policy can foster the accumulation of resources, lead to competitive advantage, and improve performance (Lazzarini, 2015). Some studies provided positive evidence from the view of firm investment and performance. Chen, Li et al. (2017) pointed out that a government-sponsored industrial policy is one of the most important factors influencing corporate finance. Using the data of Chinese listed firms, they found that state-owned firms in government-supported industries enjoy faster growth in initial public offerings and loans granted by major national banks. Criscuolo et al. (2019) also found the positive impacts of industrial policy on capital investment and employment in the United Kingdom.
Meanwhile, some studies found no impacts or negative impacts of industrial policy. Krueger and Tuncer (1982) found that protected Turkish industries did not experience rapid increases in output per unit of input. Kiyota and Okazaki (2005) and Criscuolo et al. (2019) also found no positive relationships between industrial policy and total-factor productivity (TFP). Kiyota and Okazaki (2010) found that the annual average TFP growth rate of large firms for 1959 to 1964 was −0.72% using firm-level data in the cotton-spinning industry.
China is a country with abundant industrial policies, and scholars have closely watched the influence of China’s industrial policies on corporate behavior (firm productivity, investment, and financing). Aghion et al. (2015) constructed indicators about the degree of dispersion of government subsidies, tax incentives, credit preferences, and tariff protection that enterprises in the industry received to distinguish industrial policies. They found that industrial policies with a high degree of dispersion could improve enterprises’ productivity by promoting market competition. Chen, Gao et al. (2022) used a dataset of all medium and large firms in China from 1998 to 2013 to analyze the impact of Five-Year Plans on enterprise productivity. They find that industrial policy does increase the productivity of firms in supported sectors, especially in the long run. Chen, Li et al. (2017) analyzed the impact of industrial policies from the perspective of corporate financing. They used Five-Year Plans to identify enterprises supported by industrial policies and those not supported by industrial policies and found that enterprises that do have more advantages in equity financing and bond financing. Barbieri et al. (2021) explored the relationship between industrial policy and M&A and found that being identified as an emerging sector generates positive changes in the number of M&As.
The effects of industrial policy from the microcosmic angle have drawn increasing attention. However, research on the impact of industrial policy on firm innovation remains limited. Therefore, we expand the literature by studying the relationship between industrial policy and firm innovation outputs in China.
Literature of Government Intervention and Firm Innovation
Firms may lack the motivation to innovate and underinvest in innovation activity due to the externalities generated by innovation activities (Arrow, 1962; Nelson, 1959). Hence, government intervention is considered rational because it can be a response to these market failures (Aghion & Howitt, 1992; Romer, 1986). However, Rodrik (2004) argued that a serious principal-agent problem exists between government departments and private enterprises. This case may lead to the afterward moral risk and weaken the incentive to innovate (Firth et al., 2012). Expenditures and taxes are government policies that are strategically designed to regulate or stabilize the economy (Onifade et al., 2020). Several empirical studies have focused on the two types of government intervention on firm innovation.
Offering subsidies to firms has always been an important means of government intervention in innovation activities (Hall & Van Reenen, 2000; Klette et al., 2000). However, the empirical results are heterogeneous across programs and studies. Hamberg (1966) and Levy and Terleckyj (1983) found that government subsidies encourage firms to invest in research and development (R&D). Lichtenberg (1988) found that R&D funding policies have a significant impact on firm R&D investment. Hewitt-Dundas and Roper (2010) estimated the effect of public support in Ireland and Northern Ireland using instrumental variables (IVs). They found that public support can stimulate product additionality. Choi and Lee (2017) found that the Korean government’s R&D subsidy program for the pharmaceutical industry has considerably stimulated private R&D investment. However, Wallsten (2000) found an evident crowding out effect of government subsidies on R&D investment using the panel data of American firms.
Another important means of government intervention is tax policy. Unlike government subsidies, most studies on tax credit show positive results. Koga (2003) found that tax credits for R&D can stimulate R&D investment in large Japanese firms. By contrast, Baghana and Mohnen (2009) found that the estimated tax price elasticity of R&D is −0.142 for small Canadian firms. Ernst and Spengel (2011) used firm patent to measure innovation and found that R&D tax incentives enhance firm innovation in Europe. Czarnitzki et al. (2011) showed that R&D tax credit has significant positive effects on the formation of new products, the number of new products, and the proportion of new product sales in Canada. By contrast, Cappelen et al. (2012) used the IV method to study Norway and found that tax credits have no significant impact on technical innovation.
Looking at China-specific studies, the impact of government intervention on innovation has been mixed. Lin et al. (2021) found that implementing patent subsidy policy had a significant positive impact on the number of patents based on Chinese provincial panel data from 1995 to 2010. Employing the PSM approach to correct the selection bias, Yang et al. (2012) found a positive impact of tax credits on R&D activity. Chen, Feng et al. (2022) studied a policy that awards substantial tax cuts to firms with R&D investment over a threshold or “notch.” They found a significant increase in reported R&D partly driven by firms relabeling expenses as R&D. However, Boeing (2016) found that one public RMB reduces private R&D investments by half an RMB in 2006. Jiang et al. (2018) reached similar results using the data of Chinese New Energy Vehicle enterprises.
Although considerable empirical studies have assessed the effects of government intervention on innovation, most of them simply focused on a certain type of policy and ignored the joint forces among policies. However, the various government subsidies, tax incentives, and other policies formulated by the government are dependent but systematic and mutually supportive. In China’s policy system, industrial policy is a collection of policies, including government subsidies, tax credit, interest holidays, and tariffs (Aghion et al., 2015). Lee (1996) and Powell (2005) believed that the implementation of industrial policy will bring additional government intervention. Therefore, the impact of industrial policy on firm innovation is worthy of attention.
Hypothesis Development
Industrial Policy and Firm Innovation Outputs
Industrial policy is a policy adopted by the government to support the development of specific industries for the country’s long-term development needs (Rodrik, 2004). To support these industries, various government tools are used, leading government resources tilting to these industries (Chen, Li et al., 2017). Consequently, these industries are usually regarded as promising and investable. Therefore, a large amount of capital in the capital market may enter industries through equity and debt.
For firms in encouraged industries, the release of industrial policy also changes the firm’s operating environment from two aspects. On the one hand, the inclination of industrial policy to encouraged industries and the public’s positive expectations for encouraged industries may bring additional resource inflows to firms. The inflow of resources can alleviate the market failure of firms in innovation investment and improve the willingness and level to invest in innovation. Given the negative externalities of innovation activities, firms’ private R&D investment cannot reach the optimal level in the market, and they are sometimes unwilling to carry out innovation activities. Moreover, the asymmetry of R&D financing information generated by the high risk of innovative activities hampers firms’ ability to financing. In such situations, the inflow of capital brought about by industrial policy can provide funds for firm innovation investment. Firm innovation activity is a complex process of persistence, accumulation, long cycle and high risk. A larger funds for firm innovation investment increase input of innovation activity. These funds are used to research new technology, new product and apply for related patent. Thus, thereby can increase the level of firm innovation outputs.
On the other hand, the release of industrial policy sends positive signals that are conducive to the development of encouraged industries, which attracts additional new firms to enter. The entry of new firms has intensified market competition for firms. Thus, firms need to develop new products to capture market share to develop and maintain their position in the industry. This case will increase firms’ willingness to develop new products, improve firm innovation efficiency, and promote firm innovation outputs.
The two changes in the firms’ operating environment will have a positive impact on the firm’s innovation input and efficiency. Hence, we hypothesize the following:
Hypothesis 1. A firm that is encouraged by the industrial policy is likely to have more innovation outputs.
Industrial policy can directly or indirectly alleviate the problem of insufficient investment in enterprises’ innovation activities to promote the development of enterprises’ innovation activities and then improve the level of enterprises’ innovation output. Different industries have different sources of innovation and strategies due to different technological opportunities and internal demands for knowledge (Cohen et al., 2010). Therefore, the same industrial policies (e.g., supported by national planning, government subsidies, and tax incentives) will have different impacts on the innovation performance of enterprises in different industries. The level of industry’s R&D intensity reflects the dependence of industry innovation activities on R&D funds. For high-tech industries with R&D and innovation as their core business, innovation activities such as product, process, and technology innovation are the basis for maintaining its competitiveness. To improve the competitiveness of enterprises, those in high-tech industries are more likely to bring industrial policies to the capital. By contrast, for firms in non-high-tech industries, the production and business operation is more likely focused on the cost of competition rather than innovation activities. Thus, if supported by the industrial policy, they will not necessarily increase R&D investment but expand or proceed to mergers and acquisitions, which may lead to the low impact of industrial policy on enterprise innovation output. Hence, we hypothesize the following:
Hypothesis 2. Compared to firms in non-high-tech industries, the influence of industrial policy on the innovation output is greater for firms in high-tech industries.
Mechanisms of Industrial Policy on Innovation Outputs
Industrial policy, financing constraints, and firm innovation outputs
The funds for the firm’s innovation activities can be divided into internal and external funds according to the source of funds. Considering the high degree of uncertainty in innovation activities, the degree of information asymmetry in innovation financing is higher, which increases the difficulty of external financing for innovation activities. In this respect, internal funds are better than external financing for a firm to invest in innovation. However, given the high-risk and negative externalities of innovation activities, firm decision-makers are more willing to make fixed than R&D investments. Therefore, insufficient innovation funding is an important factor hindering firm innovation.
Firms encouraged by the industrial policy can fill the financing gap required for innovation in the following ways. First, firms encouraged by the industrial policy are more likely to receive various policy supports from the government, including government subsidies, tax incentives, and other financial support. Government subsidies and tax incentives can increase the firm’s investment in innovation activities by reducing the cost of innovation activities. Second, firms encouraged by the industrial policy are likely to obtain more external financing and have lower financing costs. These external funds can also ease the financing restrictions faced by the firm.
As mentioned above, the release of industrial policy not only can compensate for financing gaps faced by firms in the process of innovation investment through policy instruments, such as government subsidies and tax incentives, but also make up for the process of innovation investment by attracting external financing sources, such as equity and debt. Thus, we hypothesize the following:
Hypothesis 3. A firm that is encouraged by the industrial policy is likely to face lower financing constraints, thereby promoting firm innovation outputs.
Industrial policy, market competition, and firm innovation outputs
To promote the development of encouraged industries, the government may take measures to lower industry entry barriers, such as relaxing market access restrictions. Moreover, the capital market is more inclined to invest in encouraged industries. On the one hand, the industries supported by industrial policy are growth-oriented and occupy an important position in the national economic growth. The introduction of industrial policy has conveyed the information and signals of promising industries to the outside world. On the other hand, for enterprises, entering industries supported by industrial policies can also obtain more resources needed for development. In order to cooperate with the implementation of industrial policies, a series of preferential and supportive policies are usually matched. More importantly, industrial policy also plays the role of resource allocation baton. A large amount of market funds will follow policy-based funds into related industries, further promoting the development and development of these new industries. Therefore, more firms will enter the encouraged industries, which will increase the degree of market competition in the encouraged industries. Thus, market competition in industries encouraged by the industrial policy will increase.
Market competition may have the opposite effect on innovation. On the one hand, increased market competition may reduce the innovation gains of laggards, thereby inhibiting firm innovation (Cette et al., 2017; Scherer, 1965; Schumpeter, 1934). On the other hand, when market competition increases, firms may choose to innovate to escape competition (Acs & Audretsch, 1988; Correa & Ornaghi, 2014; Nickell, 1996). Many previous studies have also discussed the inverted U-shaped impact of market competition on firm innovation, that is, with the increase in market competition, the intensity and efficiency of enterprise technological innovation first increase and then decrease (Aghion et al., 2005; Jefferson et al., 2006; Peneder & Woerter, 2014). Although the results on the relationship between competition and innovation are controversial, a common view exists, that is, the level of industry competition is an important factor affecting firm innovation activities (Dai et al., 2018). Hence, we hypothesize the following:
Hypothesis 4. A firm that is encouraged by the industrial policy is likely to face greater market competition, thereby affecting firm innovation outputs.
Research Design
Data
Our main sample includes Chinese listed firms from 2007 to 2019. The main data are collected from three sources. The basic information and financial status of our sample firms come from the China Stock Market and Accounting Research Database (CSMAR). The second source of our data is the patent data from the State Intellectual Property Office of the People’s Republic of China (SIPO). Another source of data is the Industrial Policy Research (IPRD) database of Chinese Research Data Services (CNRDS) Platform. Based on the text of the Five-Year Plan, the database sorts out the country’s attitude toward industrial development into encouraging, neutral, and inhibiting.
Our data begin in 2007, since the Chinese listed firms only began disclosing data on their R&D spending in 2007, while the key variable we controlled is the log of R&D spending (lnRD). The sample period ends in 2020, the ending year of the 13th Five-Year Plan. To construct our sample, following Chen, Liu, Suárez Serrato, et al. (2021), the samples are processed as follows: (1) financial institution observations are removed; (2) ST firms are removed; (3) firms with negative rights and interests of enterprise owners are removed; and (4) firms with missing values in key variables (e.g., total assets, age). To eliminate the impact of outliers, 1% data is trimmed in year-industry pair. Finally, we obtain an unbalanced panel of 31,428 firm-year observations.
Main Variables and Summary Statistics
Explained variables
We are interested in firm innovation outputs. Kleinknecht and Mohnen (2001) argued that the core of innovation activity is in the outputs rather than the inputs. The indicators based on patent data and new products are commonly used to measure innovation outputs (Lu & Wang, 2018; van Zeebroeck et al., 2006). We took the number of patent applications to measure firm innovation outputs considering the following two advantages.
First, the indicator is instant compared with patent grants or new products. A patent to be granted in China often takes 2 to 4 years (Gao & Chou, 2015). Moreover, time is essential for new products to generate sales values because new products should be suited to market development. By contrast, patent applications can be filed by a firm once it is considered innovative and profitable. Second, obtaining the measure is easier than with patent citations. Considering a large number of industrial firms, constructing firm-level patent citations may be very difficult. Therefore, the number of patent applications is a relatively appropriate indicator for our study.
In China, patents are divided into three types, namely, invention, utility model, and design patents. We first calculated the sum of the three types of patents filed by firm i in year t, denoted by Patent. In addition, invention patents are often considered more qualitative because they take a longer time, require more investment, and can generate higher returns. Hence, considering the differences among patent types, we also set two variables. Variable Inven is represented by the number of invention patents filed, and variable Uninven is represented by the sum of utility model and design patents. Figure 1 shows the average trend of patent applications of the three categories. Evidently, the number of patent applications of Chinese listed companies increased rapidly in the sample period.

The average patent applications.
Explanatory variables
The core explanatory variable we care about is industrial policy. Following Chen, Li et al. (2017) and Zhao et al. (2020), we set up a dummy variable
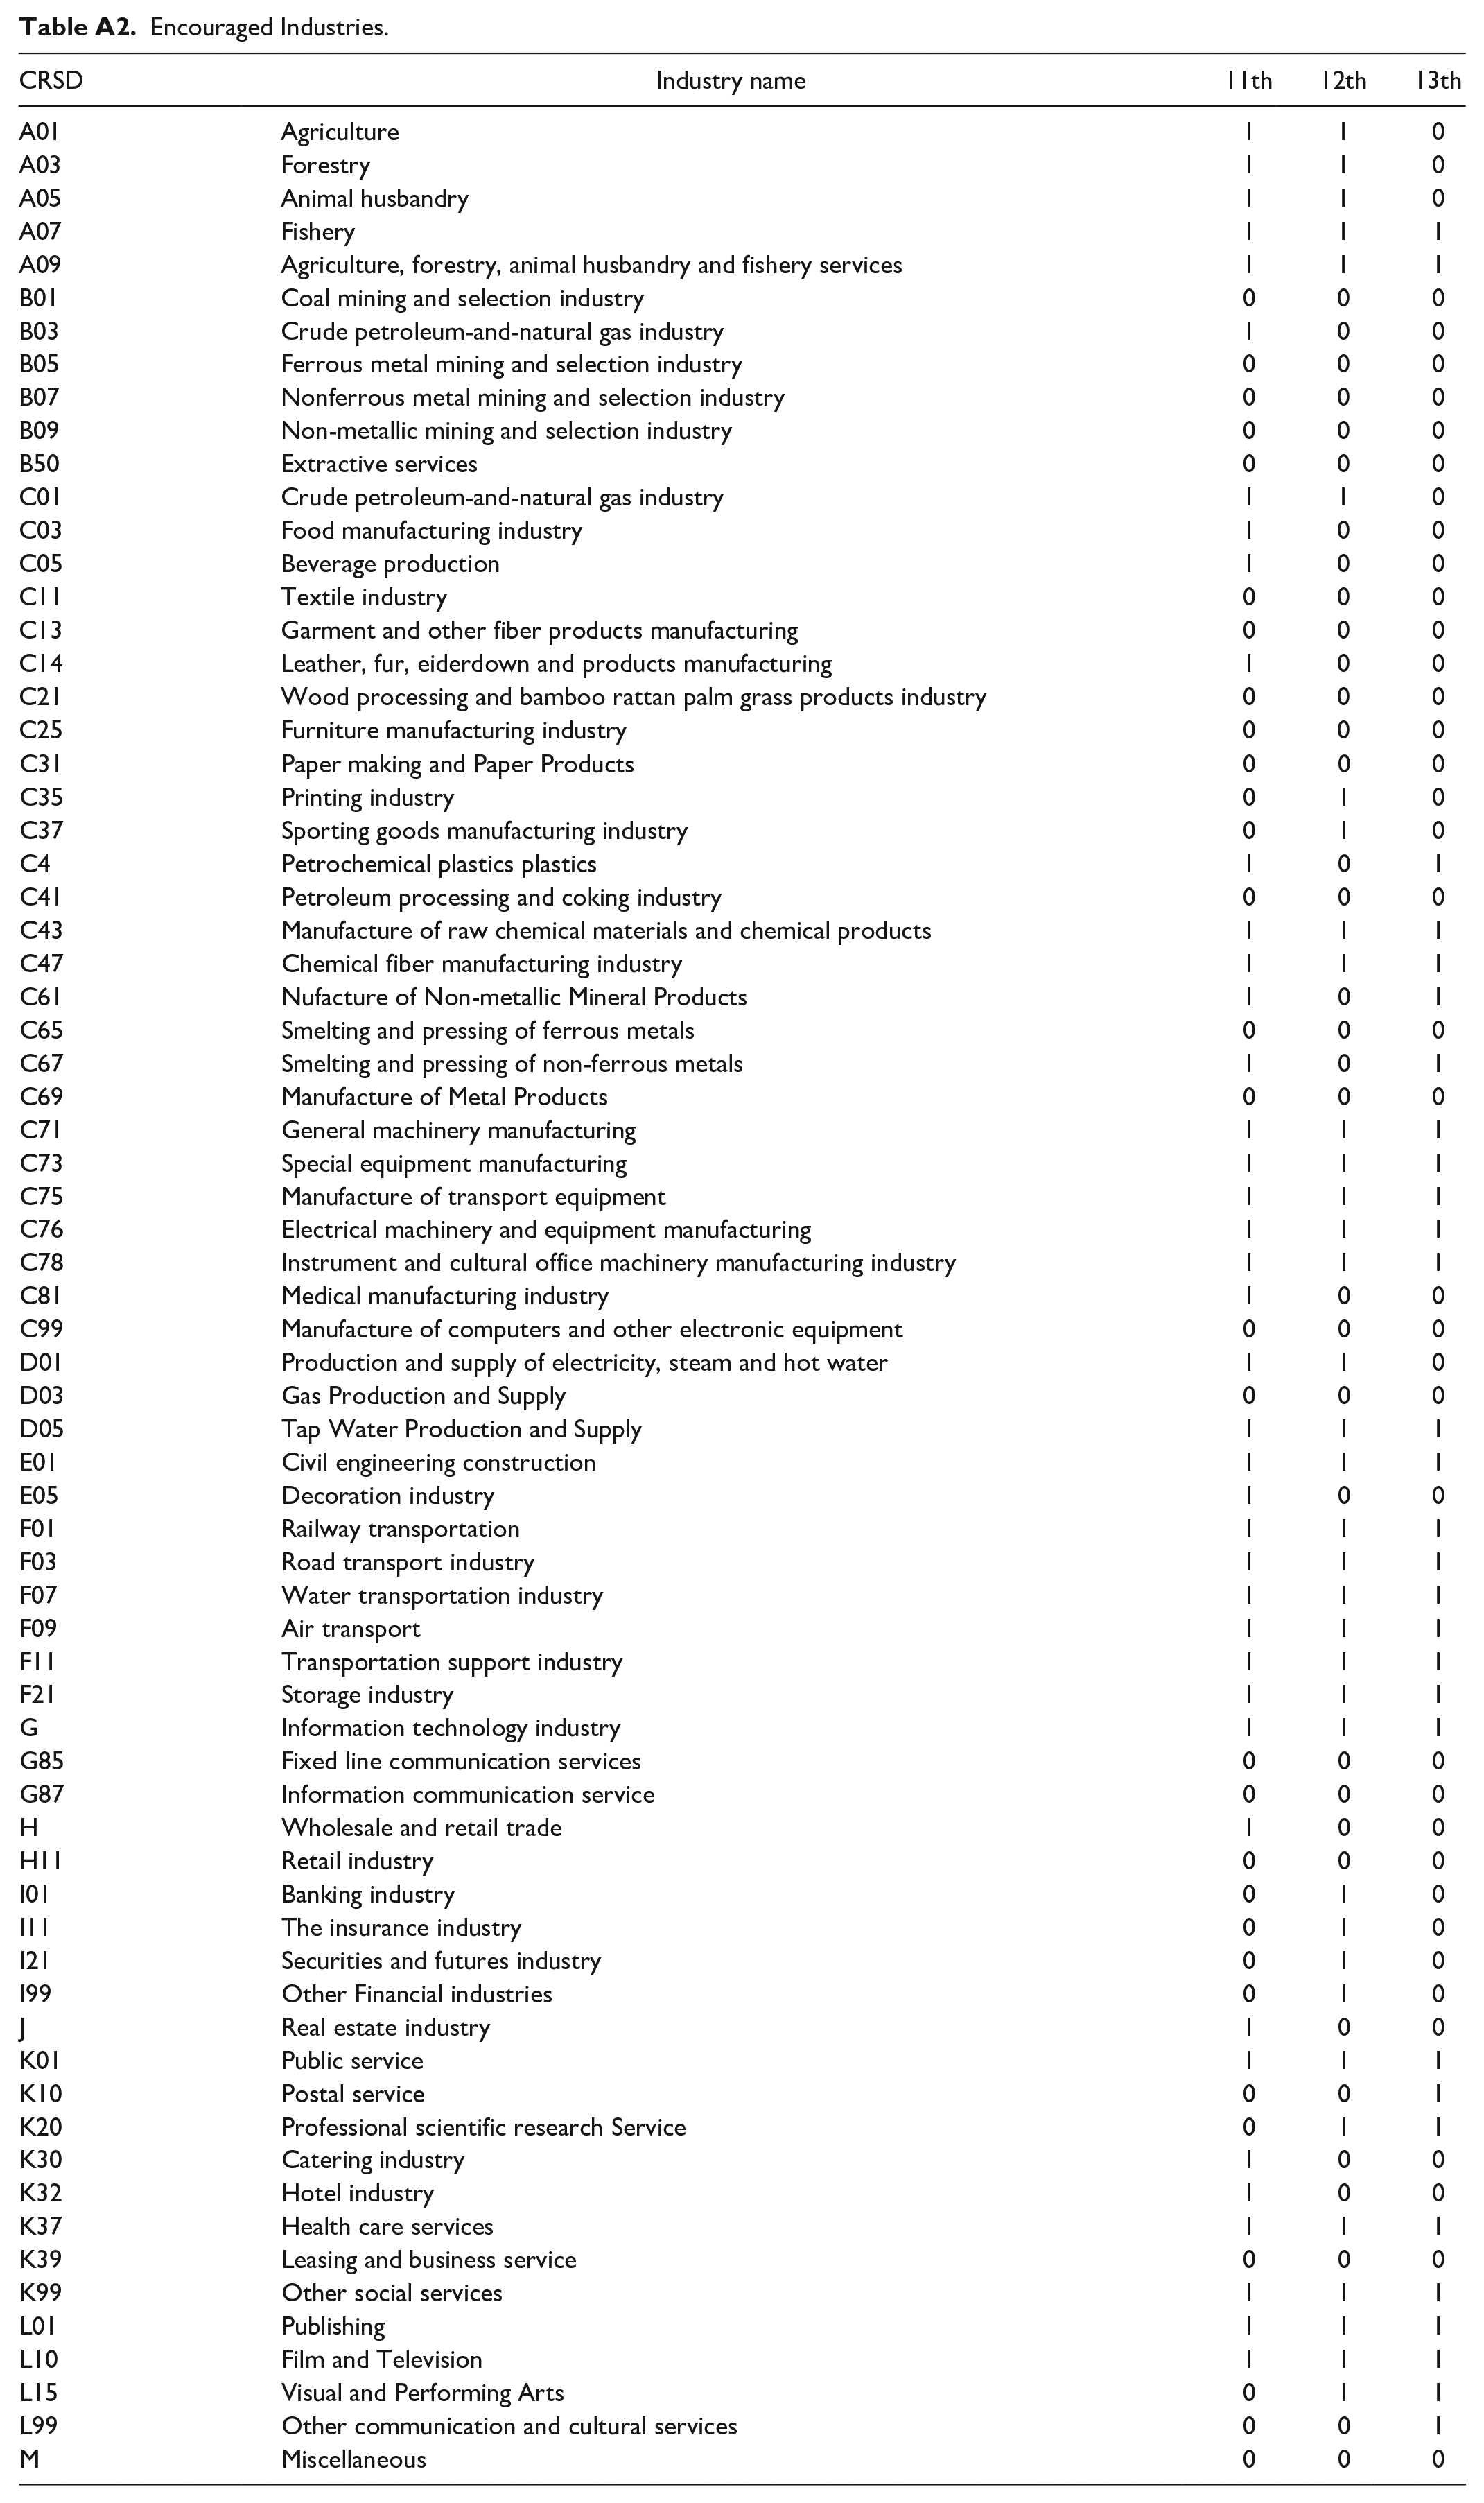
During the sample period, China went through three five-year plan periods. The period from 2007 to 2010 is in the 11th Five-Year Plan period, that from 2011 to 2015 is in the 12th Five-Year Plan period, and that from 2016 to 2020 is in the 13th Five-Year Plan period. In Appendix 2, we list the industries supported by industrial policies according to CSRC classification standards in the period.
However, the measurement of Istargeted is an industry level variable, which cannot distinguish the influence of industrial policy intensity. Based on the measurment of Aghion et al. (2015), we set up three interactions, that is, Istargeted_SUBI, Istargeted_TAX and Istargeted_CREDIT, to measure the intensity of industrial policy.
Mediation variables
financing constraints (KZindex) . According to Kaplan and Zingales (1997), we calculate firms’ KZ index to measure financing constraints. KZindex is a positive indicator of financing constraints. The larger the KZindex, the larger the financial constraints on the firm. The calculation model is as follow:

market competition (HHI). We use the Herfindahl index of firm sales as a measure of market competition, and the specific calculation formula is shown as follows:

Among them,
Control variables
Many factors affect firms’ innovative activity, and they need to be included to estimate the regression model as accurately as possible. Following He & Tian, 2013; Tong et al., 2014 ), several control variables are included in our study.
R&D spending (lnRD). Studies have shown that R&D investment has a significant impact on firm patent behavior (Vismara, 2014). One also may argue that the increase in R&D investment in encouraged firms leads to the increase in innovation outputs. Therefore, controlling R&D spending in our model is necessary. The variable lnRD is calculated as the logarithmic value of R&D spending plus 1.
Firm size (SIZE). Based on the Schumpeter’s theory of innovation, large enterprises have scale advantage in innovation outputs (Cohen & Klepper, 1996). The variable SIZE is calculated as the natural logarithm of total assets.
Firm age (AGE). Firms in the different stages of development will inevitably lead to the adoption of different innovation strategies owing to their own competitive advantages of the source of difference; thus, this scenario will affect the innovation output of enterprises (Balasubramanian & Lee, 2008). The variable AGE is calculated as the logarithmic value of year t minus the establishment year plus 1.
Firm ownership (SOE). In China, state-owned and private enterprises have different performances in innovation behavior (Gao & Chou, 2015). Accordingly, we add firm ownership into the model. The variable SOE indicates whether the firm is state-owned. If it is state-owned, SOE equals 1; otherwise, 0. We also control some financial indicators that may affect firm activities, including LEV, FA, and EBIT. The variable LEV indicates an enterprise’s level of debt and is measured as the ratio of total liability to total asset. The variable FA indicates a firm’s tangibility measured in the natural logarithm of fixed assets. The variable EBIT indicates a firm’s the profitability measured in the natural logarithm of earnings before interest and tax.
Summary statistics
Table 1 shows the descriptive statistics for the main regression variables. First, the number of patent applications of the sample ranges from 0 to 5,160 with an average of 54.392, and the median of the variable Patent is 11. The mean values of variables Inven and Univen are 23.510 and 29.680, respectively. The median values of the two variables are 3 and 5. The standard deviations of these three variables are all relatively large, indicating considerable differences in the innovation performance of sample enterprises. Columns (6)–(8) of Table 1 display the mean values of the main variables from different Five-Year Plan periods. Apparently, the average number of patent applications by Chinese listed companies rose from 21.593 to 75.873, with invention patent applications rising from 7.427 to 34.024 and non-invention patent applications rising from 13.033 to 40.965. Apparently, the innovation output of Chinese listed firms has been larger in the sample period. It shows that the innovation output of Chinese listed firms has experienced rapid development in the sample period.
Descriptive Statistics.

Note. The Columns (1)−(5) presents the mean, standard deviation, minimum, median and maximum values of the variables based on a sample of 31,428 observations of firms for the period from 2008 to 2020. The Columns (6)−(8) values of the variables in the 11th Five-Year Plan (2008–2010), 11th Five-Year Plan (2011–2015), 11th Five-Year Plan (2016–2020), respectively. The variables are winsorized at the 1% and 99% levels. Definitions of the explanatory variables are in “Appendix 1.”
Second, the explanatory variable shows that 58.5% of the sample are encouraged by industrial policy. Third, the average R&D investment (lnRD) also increased from 6.983 in the 11th Five-Year Plan period to 15.689 in the 13th Five-Year Plan period. Regarding other control variables, the figures present a sample with an average firm size of 22.003 and an average age of 2.769.
Model Setup
Basic model
Referring to the existing literature (Goto et al., 2020; Hu & Jefferson, 2009; Pakes & Griliches, 2014), we constructed a knowledge production function for patent applications:

where
To estimate the patent production function, Poisson regression, Negative Binomial regression, Zero-inflated Poisson regression, and Zero-inflated Negative Binomial regression are commonly used (Bruns & Kalthaus, 2020). We choose the model employed in this paper in two steps. First, we judge whether the distribution of our explained variables follow poisson distribution or negative binomial distribution. According to Figure 1, the three variables show the characteristics of excessive dispersion. We use the O test proposed by Böhning (1994) to test excessive dispersion. Appendix 3 shows the detailed calculations. The O statistics of the variables Patent, Invention, and Uninvention are 65,742, 42,543, and 24,132, respectively. Moreover, the variances of the three variables are far greater than the mean. Therefore, Poisson regression model is not suitable for our data set, and negative binomial regression model should be used to estimate the equation (2).
Second, in the case that the three variables (Patent, Inven, and Uninven) have many zero values, we need to determine whether to use the zero expansion model. The Vuong test has been used in many studies to test this problem, but Wilson (2015) pointed out that the classical test is misused to test zero-inflation because the models are not nested. Refering to Workie and Azene (2021), we use information criteria AIC and BIC to check whether a zero-inflated model is more appropriate. We estimated equation (1) using the four models. In Table 2, we compared the AIC and BIC. The Negative Binomial model has the smallest AIC value (194,275.8) and BIC value (194,372.8). We can conclude that the Negative Binomial model performs best for our data set.
Model Comparison Using AIC and BIC.

Note. The table reports the results of regression to the benchmark equation (3) using Poisson regression, Zero-inflated Poisson regression, Negative Binomial regression, Zero-inflated Negative Binomial regression, respectively. The variables included in the Inflate model of Zero-inflated Poisson regression, Zero-inflated Negative Binomial regression are all control variables.
Thus, we employed a Negative Binomial model to investigate the effects of industrial policy on firm innovation outputs.
Moderation model: The role of industrial policy instruments
To test the role of industrial policy instruments, we add the industry policy instruments (SUBI, TAX, and CREDIT) and their interactions with industrial policy (Istargeted_SUBI, Istargeted_TAX, and Istargeted_CREDIT) into equation (3). The moderation model used is as follows:
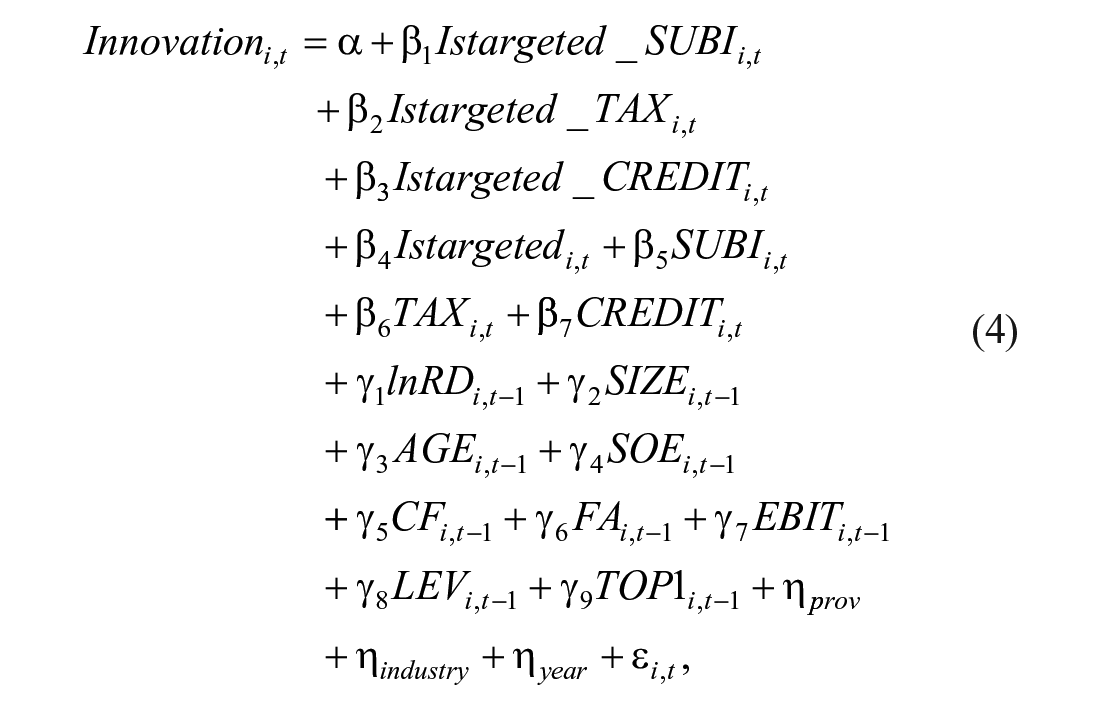
where
The coefficients
Mediation model: Mechanisms
We examine Hypotheses 4 and 5 to study the mechanisms of industrial policy on firm innovation outputs. Following Baron and Kenny (1986), we use the stepwise method to investigate the two mechanisms. The first step of the mediation effect model is to estimate equation (3), which is the total effect of industrial policy on firm innovation outputs.
Then, the second step of the mediation effect model is to estimate the effect of industrial policy on the two mechanisms. The models used are as follows:

where the
Coefficient
The last step of the mediation effect model is to estimate the effect of industrial policy on firm innovation outputs after controlling the mechanism. Based on equation (4), the following specific model is constructed:

Equation (6) Coefficient
An effective mechanism must satisfy the following conditions: ① the coefficient of Istargeted (
Results
Industrial Policy and Firm Innovation Outputs
Univariate analysis
We turn first to the results of univariate analysis. We divided the sample into two groups by variable Istrageted and calculated the average of our explained variables. Table 3 shows the average of variables Patent, Inven, and Uninven of firms in two groups. The last column of Table 3 reports the difference between the two groups.
Univariate Analysis for Industrial Policy and Innovation Outputs.

Note. The last column is the mean difference between the two groups. *** indicate statistical significance at the 1% levels, respectively. Variable definitions are in “Appendix 1.”
The average number of patent applications is 69.032 for encouraged firms, whereas the average number of patent applications is 33.813 for discouraged firms. The difference between the two groups is 35.219 and is significant at the 1% level. The results indicate that encouraged firms have a higher level of innovation outputs.
Similarly, the average number of invention patent applications of encouraged firms is more than twice that of discouraged firms. The average level of variable Uninven is 18.708 in encouraged firms and 37.486 in discouraged firms. The difference between the two groups is also significant. Overall, these results indicate that a positive relationship may exist between industrial policy and firm innovation outputs.
Basic results
We use a Negative Binomial model to explore the relationship between industrial policy and firm innovation outputs. Table 4 shows the main results. Province-fixed, industry-fixed and year-fixed effects are included in all regressions. Columns (1)–(3) show the estimated results of the impact of industrial policy on firm innovation outputs without control variables, and Columns (4)–(6) show the results with control variables.
Influence of Industrial Policy on Firm Innovation Outputs.

Note. Variable definitions are in “Appendix 1.” Negative Binomial model is employed to investigate the relationship between industrial policy and firm innovation outputs. All estimation results are robust. The numbers in parentheses are t statistics; *, **, and *** indicate significant levels of confidence at 10%, 5%, and 1%, respectively. Models include province, industry and year fixed effects.
Turning first to the coefficients of the explanatory variable, the coefficients of Istargeted in all columns are significantly positive, strongly indicating a positive impact of industrial policy and on firm innovation outputs. Using the regression results of Columns (4)–(6) as the benchmark interpretation object, the coefficients for Patent, Inven, and Uninven are 0.279, 0.221, and 0.293, respectively. The coefficients for Patent show that compared with discouraged firms, encouraged firms will apply for 1.27 (
Then we turn to the coefficients of the control variables. Our findings are consistent with some existing studies. From the regression results of Columns (4)–(6), a significant positive correlation exists between firm size and patent applications, showing that larger firms tend to engage in more patent activities (Cohen & Klepper, 1996). A significant negative relationship is observed between firm age and patent applications; thus, the older the firm, the less likely it is to engage in innovation activities (Balasubramanian & Lee, 2008; Xu et al., 2017). Private firms have more innovation outputs than state-owned firms, which indicate a higher innovation capacity in private firms (Gao & Chou, 2015). A positive correlation exists between firm profits and patent activities, indicating that the higher EBIT would have more resources and money to be invested in more patent activities (Kamien & Schwartz, 1978). The coefficients of FA and LEV are significantly negative, indicating that firms with higher fixed assets and higher leverage ratio have lower innovation outputs (Choi et al., 2016; Gao & Zhang, 2019).
Moreover, we report the values of alpha in Table 4. The alpha values in all regressions are greater than 0, indicating that the negative binomial model is suitable for our data.
In practice, if an industry is mentioned to be encouraged in the Five-Year Plan, then, local governments and ministries, such as the Ministry of Science and Technology, also formulate some related supporting policies and measures for the industry. Among them, the mostly used policy instruments are government subsidies, tax incentives, and credit holidays. The use of policy instruments is supposed to strengthen the positive impact of industrial policy on innovation outputs. We estimate equation (4) and display the results in Table 5.
The Role of Industrial Policy Instruments.
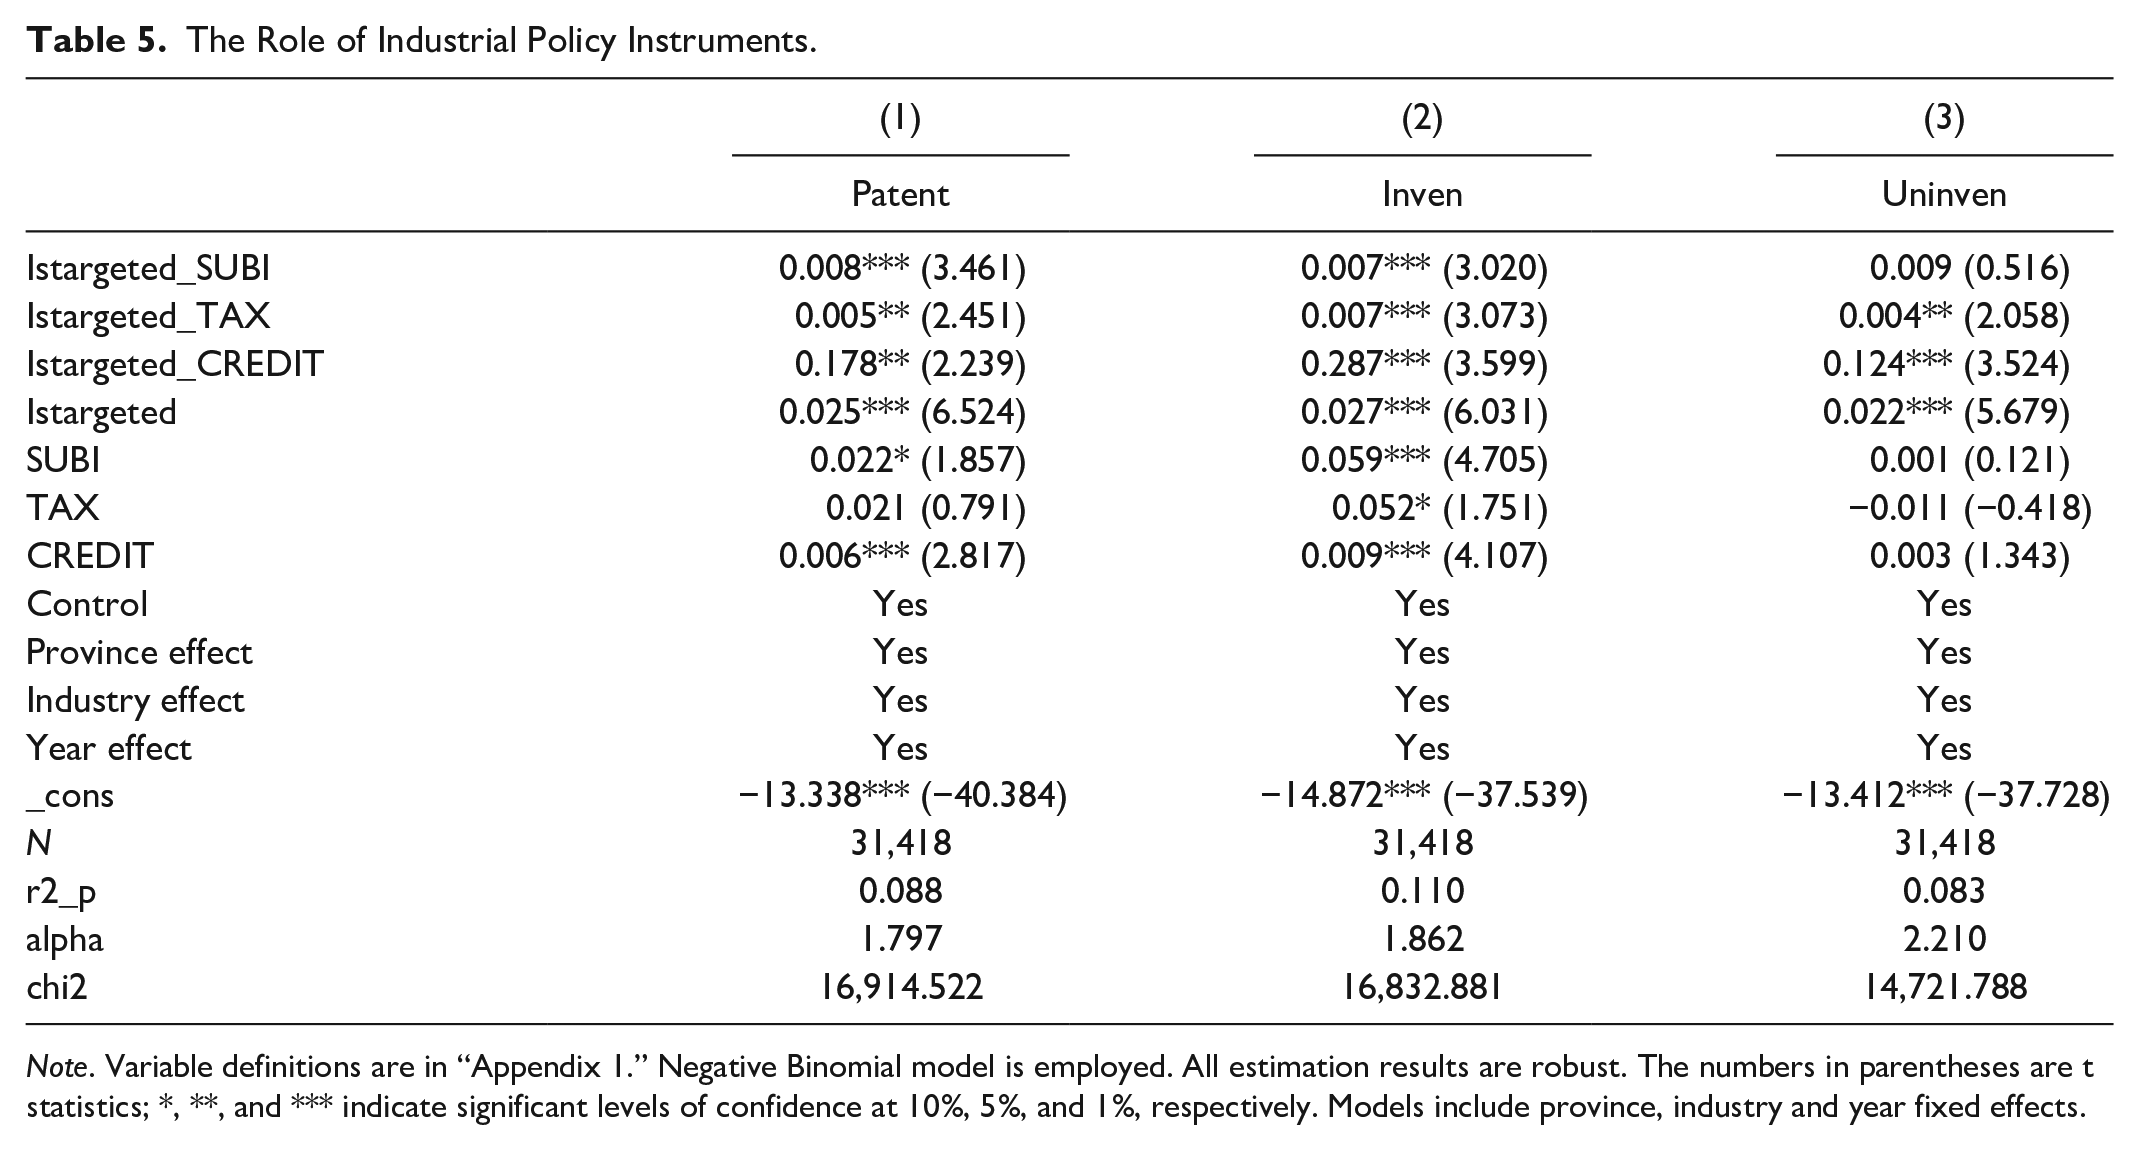
Note. Variable definitions are in “Appendix 1.” Negative Binomial model is employed. All estimation results are robust. The numbers in parentheses are t statistics; *, **, and *** indicate significant levels of confidence at 10%, 5%, and 1%, respectively. Models include province, industry and year fixed effects.
First, the values of alpha are all greater than 0, indicating that the negative binomal model is effective. Then, looking across Table 5, the impact of policy instruments is very intuitive. The coefficients of interactions (Istargeted_SUBI, Istargeted_TAX, and Istargeted_CREDIT) in each column are all positive and significant, indicating that firms with more government subsidies, higher tax incentives, and more credit incentives significantly file more patents in the type of invention and the type of utility and design. The results show that the increase in the intensity of policy instruments can help promote firm innovation outputs in encouraged industries. In addition, the coefficient Istargeted remains significantly positive, consistent with the results in above. This finding indicates that encouraged firms will have other innovation outputs after controlling for the policy instruments.
Robustness Checks
PSM-DID model
We have shown that encouraged firms have higher innovation outputs relative to discouraged ones after controlling for various firm characteristics. The endogenous problem is not majorly considered in our basic model because the Five-Year Plan is formulated by the Chinese Government and is an industry-level measurement, whereas firm innovation outputs are firm behavior. Firm behavior may respond to the Five-Year Plan. However, for a firm’ behavior to affect government policy is hardly possible.
However, one may argue that the higher level of innovation outputs in encouraged firms may be due to sample selection problem. That is, when the industrial policy is stimulated, the government has chosen the firms with strong innovation ability and decided to encourage these firms. Hence, innovative firms are more strongly encouraged by industrial policy. The PSM-DID model is commonly used to address the endogenous problem in the literature on policy evaluation (Zhao et al., 2019). To address the sample selection problem, we take the release of the 10th and the 11th “Five-Year Plan” as quasi-natural experiments and employ the PSM-DID method to retest the relationship between industrial policy and firm innovation outputs.
We first construct a PSM model to obtain the matching sample. The model is constructed as follows:
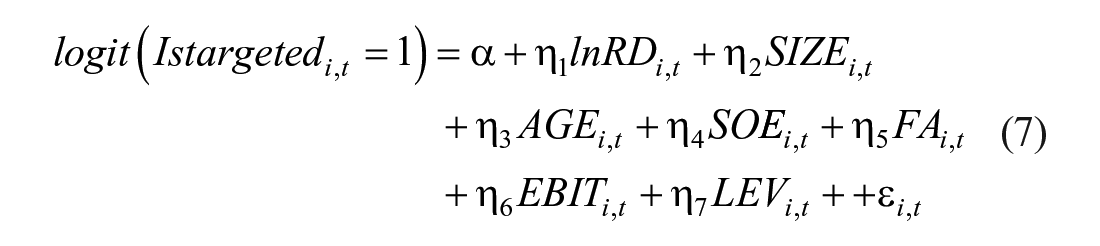
where the explained variable is whether a firm is encouraged by industrial policy. The explanatory variables are a set of control variables mentioned in equation (3).
Then, using the matching sample, we estimated the DID model as follows:

where Innovation1 includes variables Lnpat, Lninv, and Lnuninv. Lnpat (Lninv/Lnuninv) is the natural log of the number of patent applications (invention patent applications/utility and design patent applications) plus 1.
Istargeted equals 1 if the firm is encouraged by industrial policy and equals 0 if discouraged. In the treatment index, Istargeted equal to 1 indicates that the firm is in the treatment group. The term is equal to 1 if it is in the post-treatment group and equal to 0 if in the pre-treatment group. The coefficient on the interaction of Istargeted and Term (
Table 6 shows the PSM-DID regression results. In Columns (1)–(3), the sample period is from 2008 to 2015, and the treated year is 2011, when the 11th Five-Year Plan was released. The explained variables are Lnpat, Lninv, and Lnuninv, indicating the number of patent applications, invention patent applications, and utility and design patent applications by the firm in the current year. The coefficients on Istargeted_Term are significantly positive at the 1% level, and the value are 0.179, 0.224, and 0.193. The results show that encouraged firms file more patents, both type of invention and type of uninvention (including utility and design), indicating that encouraged firms are more likely to innovate than discouraged firms.
The Results of Using PSM-DID Model.

Note. Lnpat, Lninv, and Lnuninv indicate the number of patent applications, invention patent applications, and utility and design patent applications in the current year, Istargeted and Term are treat and time variables for industrial policy, other variable definitions are in “Appendix 1.” The numbers in parentheses are t statistics; **, and *** indicate significant levels of confidence at 5%, and 1%, respectively. Models include control variables, province, industry, and time fixed effects.
In Columns (4)–(6), the sample period is from 2011 to 2020, and the treated year is 2016 when the 13th Five-Year Plan was released. The results are similar to those in Columns (1)−(3), the coefficients on Istargeted*Term are significantly positive. That is, considering other conditions unchanged, encouraged firms are more likely to file and generate more patent applications (invention patent applications, utility and design patent applications) compared with discouraged firms.
Table 6 shows that the positive impact of industrial policy on firm innovation outputs is robust.
Other measures of industrial policy
In this section, we use several alternative measures of industrial policy. Following Du et al. (2014) and Aghion et al. (2015), we reestimate equation (3) by employing the most commonly used policy instruments, government subsidies, tax incentives and credit holiday, as the independent variables. Table 7 reports the results. The coefficients of three policy instruments are all significantly positive at the level above 10%, indicating that the results in Section 5.1 are also robust.
The Results of Other Measures of Industrial Policy.
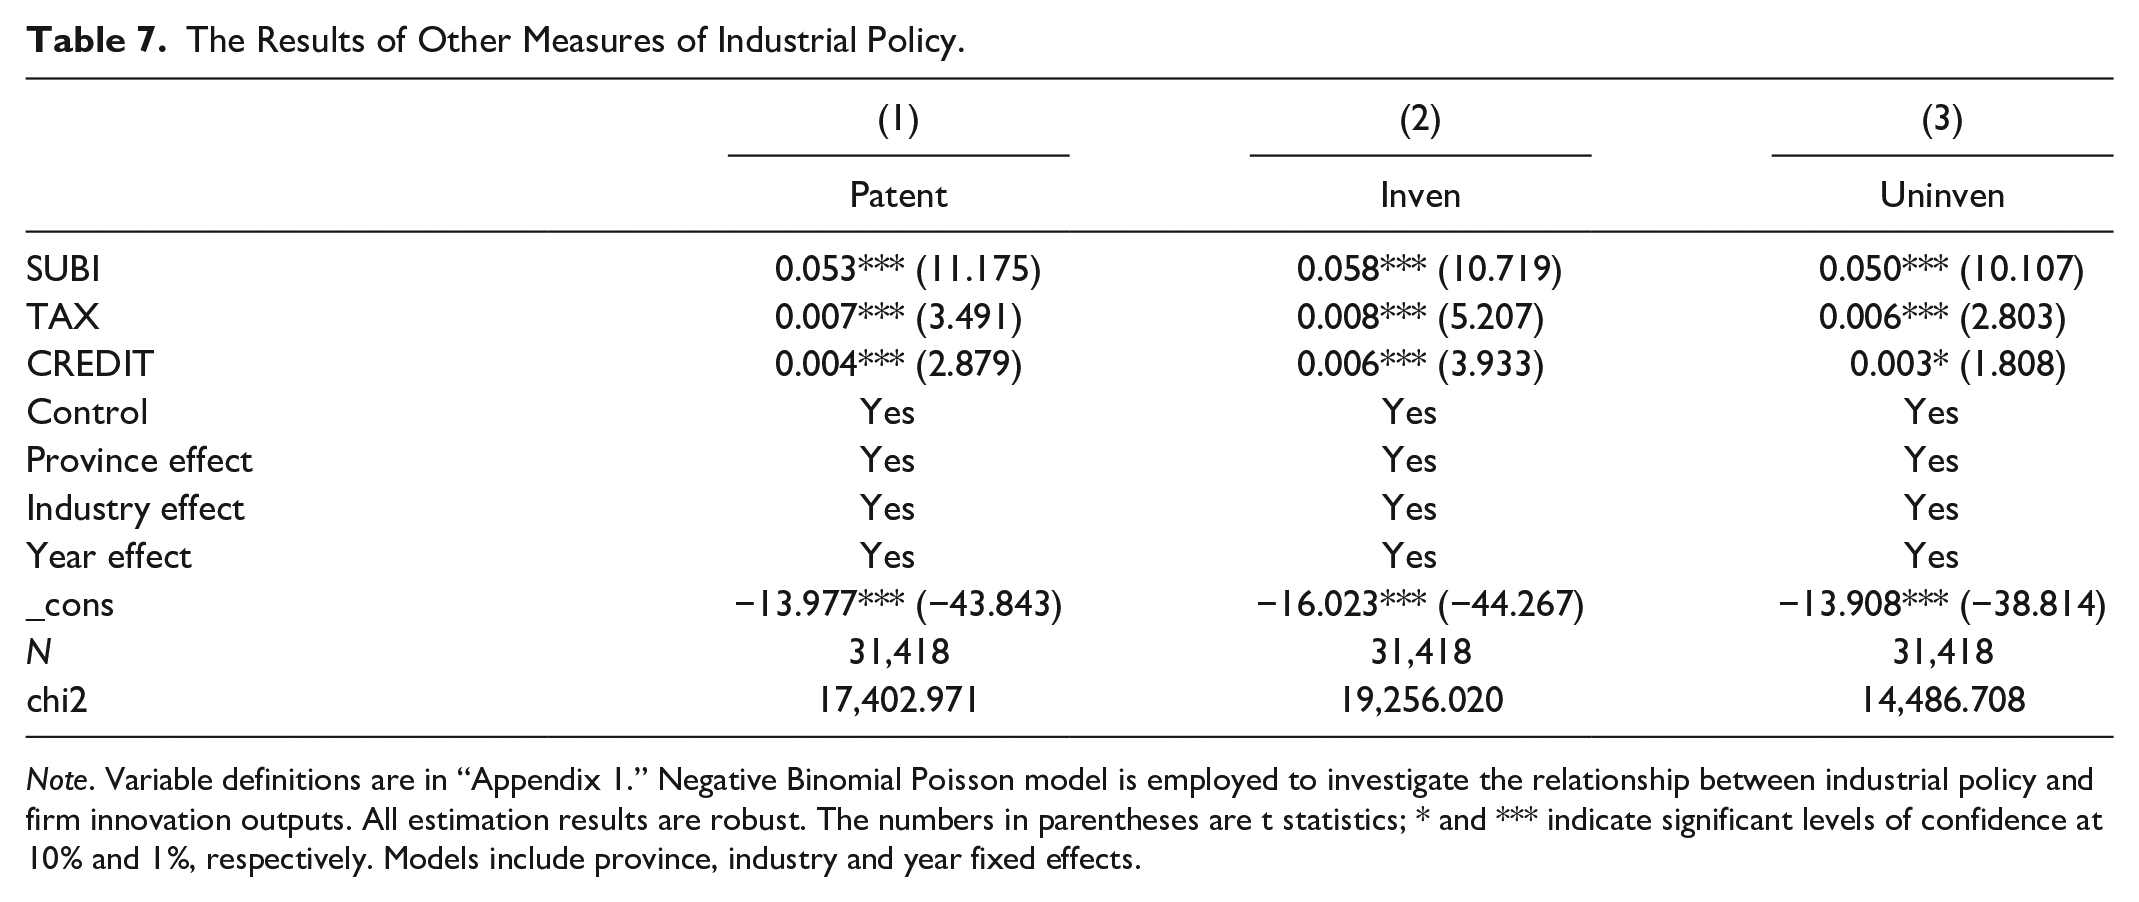
Note. Variable definitions are in “Appendix 1.” Negative Binomial Poisson model is employed to investigate the relationship between industrial policy and firm innovation outputs. All estimation results are robust. The numbers in parentheses are t statistics; * and *** indicate significant levels of confidence at 10% and 1%, respectively. Models include province, industry and year fixed effects.
Changing sample to Chinese industrial enterprises
In this section, we reestimate equation (3) by changing our sample to Chinese industrial enterprises. Considering the openness and timeliness, we employ data from Chinese listed firms to test our hypothesis. In fact, the number of industrial enterprises above designated size is far greater than the number of listed firms. However, the data of industrial enterprises come from the Annual Survey of Industrial Enterprises by the National Bureau of Statistics of China and are released to the public from 1998 to 2013 until now. Combined with the patent data from SIPO, we employ a zero-inflated negative binomial model. Table 8 shows the results.
The Results of Using of Sample to Chinese Industrial Enterprises.
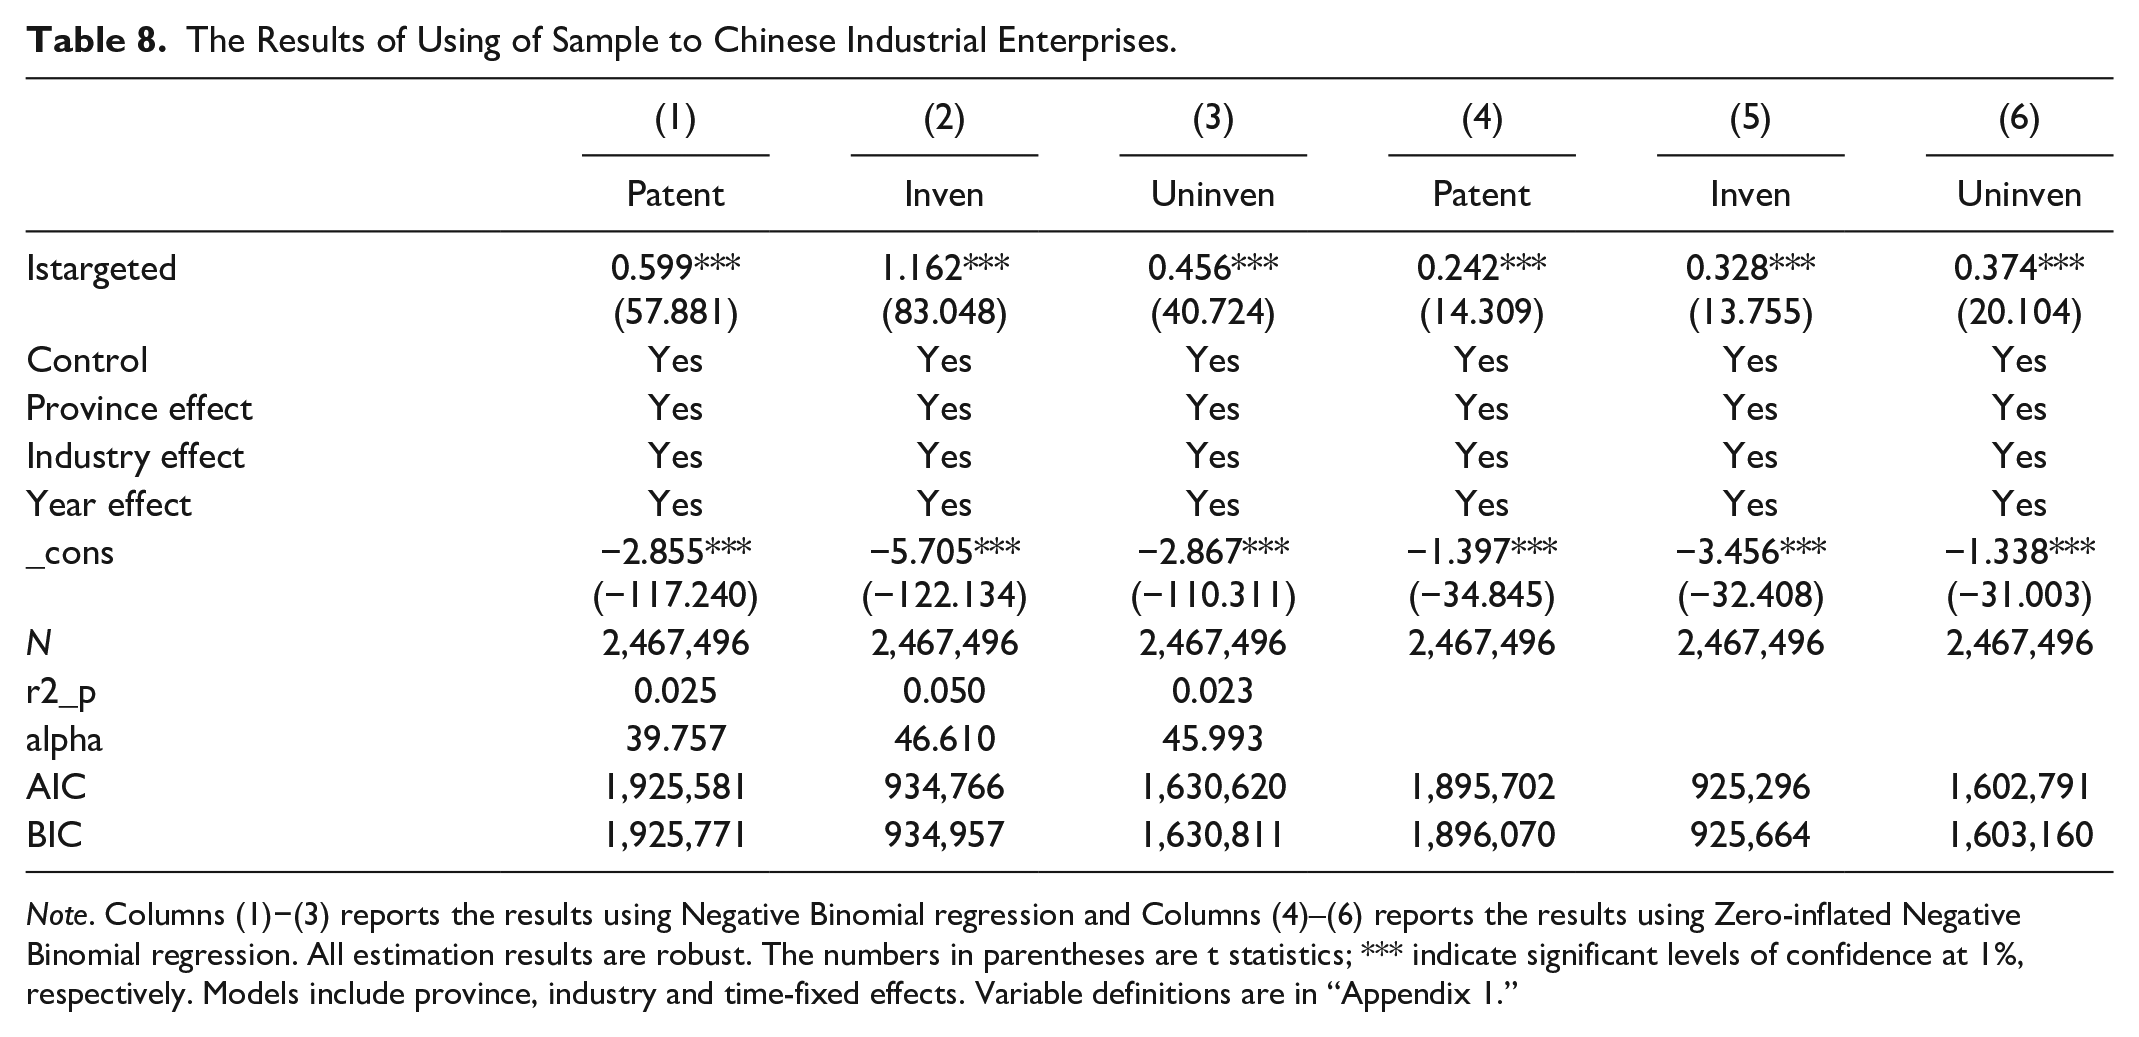
Note. Columns (1)−(3) reports the results using Negative Binomial regression and Columns (4)–(6) reports the results using Zero-inflated Negative Binomial regression. All estimation results are robust. The numbers in parentheses are t statistics; *** indicate significant levels of confidence at 1%, respectively. Models include province, industry and time-fixed effects. Variable definitions are in “Appendix 1.”
Columns (1)–(3) of Table 8 show the results using the negative binomial model. The values of alpha are greater than 0; thus, the negative binomial model is suited. Columns (4)–(6) show the results of counting process using the zero-inflated negative binomial model. Compared with the AIC and BIC in the six models, we can find that the zero-inflated negative binomial model has smaller AIC values and BIC values. Therefore, zero-inflated negative binomial model is more suited for the data of industrial enterprises. The coefficients of Istargeted are all significantly positive, indicating that industrial policy can indeed promote firm innovation outputs.
Further Analysis: Industrial Policy, Firm Innovation Outputs, and Industry Heterogeneity
We have shown that industrial policy has a positive effect on firm innovation outputs. The next question we are concerned about is whether the effect varies in different firms? In this section, we investigate the effects of industrial policy on firm innovation outputs from the perspective of policy instruments and industry heterogeneity.
Now, we pay attention to whether the promotion effect of industrial policy on firm innovation outputs is consistent across different industries. According to the high-tech industry classification standard released by the National Bureau of Statistics of China, we divide the sample into two groups, that is, high-tech industries and non-high-tech industries. Table 9 shows the results of regression in the two groups.
The Impact of Industrial Policy on Innovation Outputs in Different Industries.

Note. Variable definitions are in “Appendix 1.” Negative Binomial model is employed. All estimation results are robust. The numbers in parentheses are t statistics; *, **, and *** indicate significant levels of confidence at 10%, 5%, and 1%, respectively. Models include province, industry, and year fixed effects.
Panel A reports the total effect of industrial policy on firm innovation outputs based on equation (3). Columns (1)−(3) show results for sample firms in non-high-tech industries. In Column (2), the coefficients of variable Istargeted is 0.103 and is significant at statistical level of 10%, indicating that firms encouraged by industrial policy are more likely to apply for the type of invention patent. Columns (4)−(6) show results in high-tech industries. The coefficients of variable Istargeted are all significant at the statistical level of 1%, which shows that industrial policy has a significant positive impact on the patent filed in high-tech industries.
Panel B reports the results of equation (4) in different industries. The coefficients of Istargeted_SUBI are all significant and positive in Columns (1)–(3), indicating government subsidies have a significant positive impact on firm patent applications in non-high-tech industries, for the type of invention patent and types of utility and design patent. However, the coefficients of Istargeted_SUBI is not significant, indicating that government subsidies have not played an expected role in promoting innovation outputs in high-tech industries.
Then we turn to the coefficients of Istargeted_TAX. In Columns (1)–(3), the coefficients are significantly negative or not significant, indicating that tax incentives have not played an expected role in promoting innovation outputs in non-high-tech industries. The possible reason is that firms in non-high-tech industries have low R&D investment intensity and fail to reach the threshold of lowering firm tax rates. Hence, the tax deductions for R&D expenditures in these firms are not high, so they cannot promote firm innovation outputs.
The coefficients of Istargeted_CREDIT in Columns (4)−(6) show that encouraged firms in high-tech industries filed more patent, for the type of invention patent and the type of utility and design patent. Compared with non-high-tech industries, innovation activities of enterprises in high-tech industries are subject to greater financing constraints. Thus, the higher credit holiday can help to alleviate the financing constraints, thus promoting innovation outputs.
In general, the impact of industrial policy on firm innovation outputs differs in industries with varying characteristics. The specific manifestation is that in high-tech industries, encouraged firms are more likely to be innovative. For firms in low-tech industries, government subsidies are more effective, but for those in high-tech industries, tax incentives are more effective.
Mechanisms of Industrial Policy on Firm Innovation Outputs
Industrial policy, financing constraints, and firm innovation outputs
Table 10 reports the results of the financing constraints mechanism. Columns (1)–(3) show the total impact of industrial policy on firm innovation outputs, including patent applications (Patent), invention patent applications (Inven), and utility and design patent applications (Uninven). The coefficient of Istargeted is significantly positive, which is consistent with the results in Table 4. Column (4) lists the result of equation (5), where the explained variable is KZindex, indicating the financing constraint mechanism. The coefficient of Istargeted is 0.010 in Column (4), which is significant at the 1% level, indicating that the financing constraints of encouraged firms have been alleviated.
Industrial Policy, Financing Constraints and Firm Innovation Outputs.
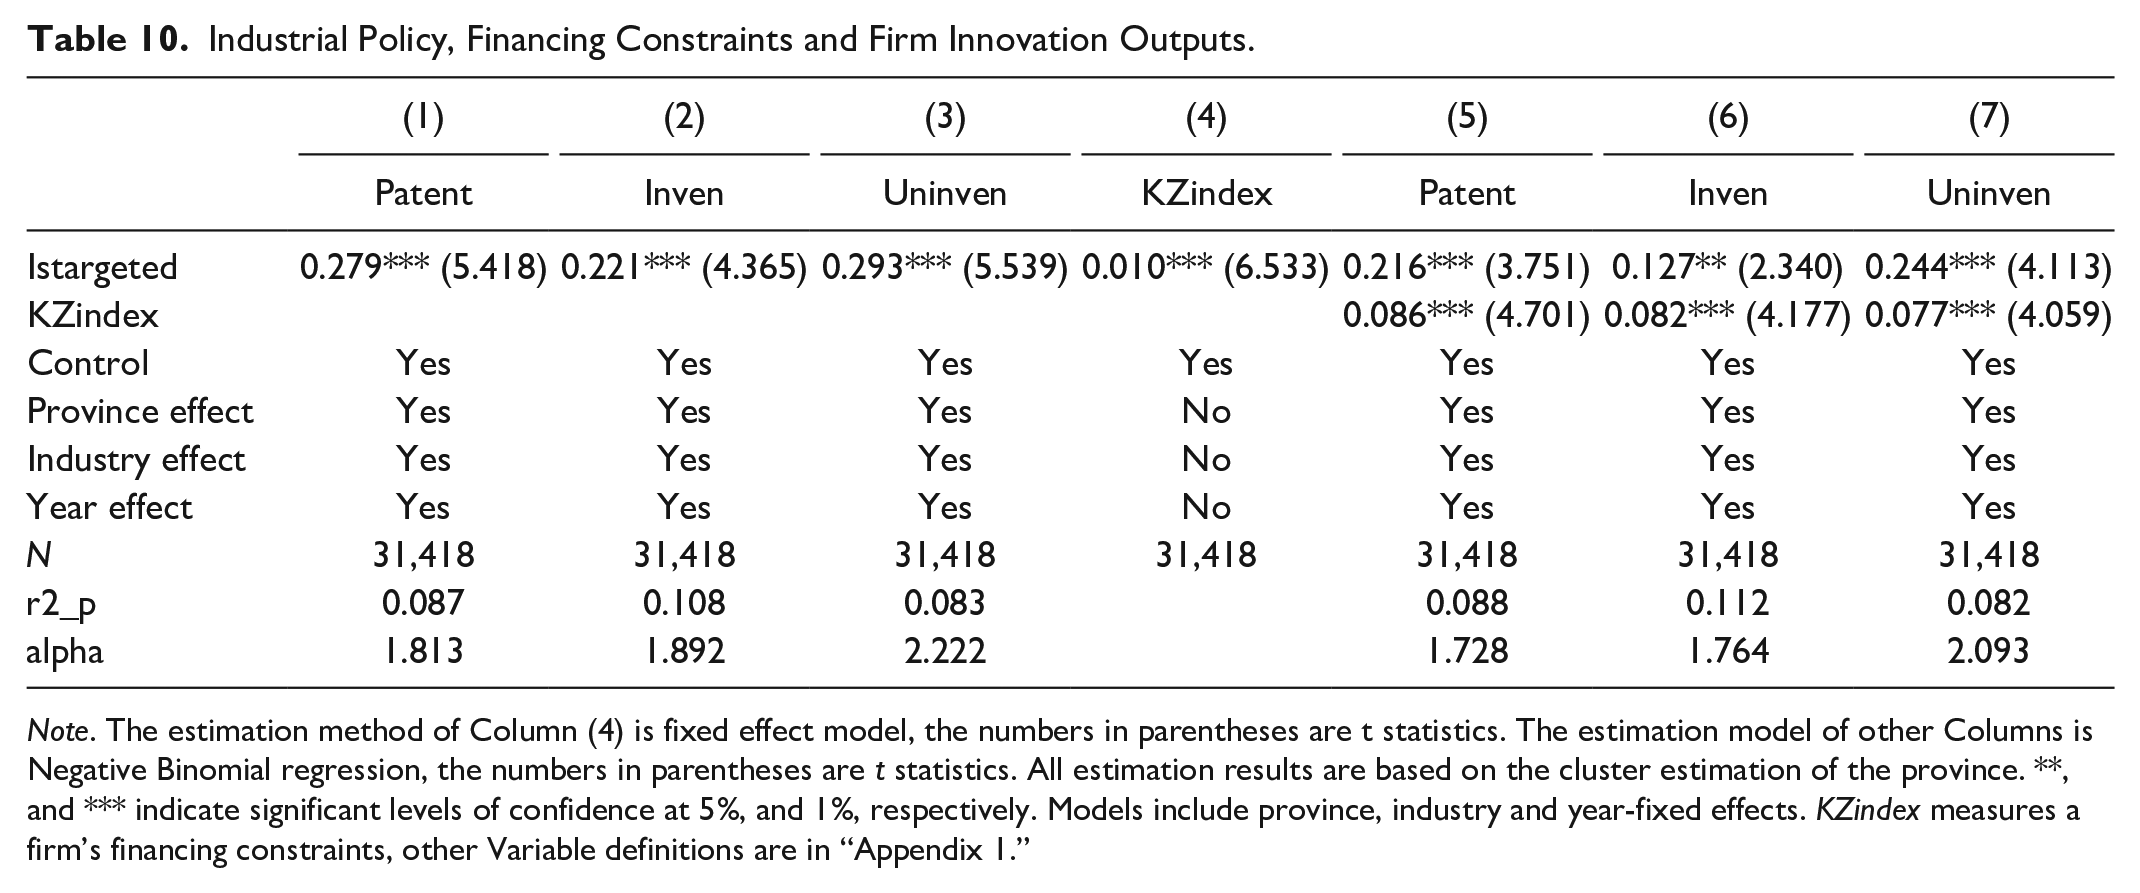
Note. The estimation method of Column (4) is fixed effect model, the numbers in parentheses are t statistics. The estimation model of other Columns is Negative Binomial regression, the numbers in parentheses are t statistics. All estimation results are based on the cluster estimation of the province. **, and *** indicate significant levels of confidence at 5%, and 1%, respectively. Models include province, industry and year-fixed effects. KZindex measures a firm’s financing constraints, other Variable definitions are in “Appendix 1.”
Columns (5)–(7) report the results of model (6), adding financing constraint variables to the benchmark model. The coefficient of KZindex is significantly positive, indicating that the alleviation of financing constraints helps promote firm innovation outputs. In addition, the coefficient of Istargeted is still significantly positive, indicating that financing constraints play a part in the mediating effect. The results show that alleviating financing constraints is indeed the path through which industrial policy affects firm innovation outputs.
Industrial policy, market competition, and firm innovation
Table 11 reports the results of the market competition mechanism. Columns (1)–(3) report the results of the benchmark regression. The results are consistent with Table 4, showing the significant positive impact of industrial policy on firm innovation outputs. Column (4) estimates the impact of industrial policy on the level of market competition faced by firms. The coefficient of Istargeted is significantly negative, indicating that encouraged firms are facing greater market competition.
Industrial Policy, Market Competition, and Firm Innovation.

Note. The estimation method of Column (4) is fixed effect model, the numbers in parentheses are t statistics. The estimation models of other Columns is Negative Binomial regression. All estimation results are robust. *** indicate significant levels of confidence at 1%, respectively. Models include province industry and year-fixed effects. Variable definitions are in “Appendix 1.”
Columns (5)–(7) report the results of adding market competition variables to the benchmark model. The coefficient of HHI is significantly negative, indicating that the increase in market competition can significantly promote firm innovation outputs. In addition, the coefficient of Istargeted is still significantly positive, indicating that market competition plays a part in the mediating effect. The results show that improving the level of market competition is the path through which industrial policy affects firm innovation.
Conclusions, Policy Recommendation, and Directions of Future Research
Discussion and Conclusions
A long history exists on the study of industrial policies. While some authors highlight the need to promote infant industries and overcome structural constraints for industrialization and economic diversification (e.g., Rodrik, 2004), other authors highlight the need for antitrust measures and ensuring the integrity of the market forces of competition and innovation (Bain & Kleinknecht, 2016; Baumol, 2002). This study presents empirical evidence on the economic consequences of industrial policy from the view of innovation. We set out to explore the following questions:
Does the industrial policy included in the Five-Year Plan significantly promote the firm innovative outputs in China? What are the mechanisms?
Given that the Five-Year Plan is macro industrial policy formulated by the national government of the People’s Republic of China, the implementation is usually followed by a variety of fiscal and tax policy instruments. Is the effect of macro industrial policy on micro firms’ innovation outputs influenced by policy instruments heterogeneity and industry heterogeneity?
Following our theoretical development and data analysis, we now revisit these questions and explain the contribution of our work. Using the patent and financial data of Chinese listed firms from 2008 to 2020 and policy data from the Five-Year Plan, we employed a negative binomial model to address the problems. We find that the firms encouraged by the Five-Year Plan have more patent applications, invention patent applications, and utility and design patent applications compared with firms discouraged by the Five-Year Plan. The results are robust after some robust tests.
The results actually supplement two aspects of literature, one is the research on the effectiveness of industrial policy, the other is the influencing factors of enterprise innovation activities. On the one hand, supporters of industrial policy believe that industrial policy can reduce the degree of information asymmetry in market economy and overcome market failure (Stiglitz et al., 2013); thus, industrial policy is necessary and effective. Prior studies focus on the valuation impact of industrial policy (Barbieri, Di Tommaso et al., 2021; Calder, 1995; Chang et al., 1998; Chen, Li et al., 2017; Eaton & Grossman, 1986; Etzkowitz & Leydesdorff, 2000; Rodrik, 2004). Five-Year Plans are increasingly used to measure industrial policy for China and is proven to play positive roles in firm financing (Deloof et al., 2022; Chen, Li et al., 2017), foreign direct investment (Li et al., 2022), productivity (Chen, Feng et al., 2022; Chen, Liu, Suárez Serrato, et al., 2021), and corporate tax avoidance (Geng et al., 2021). The significant positive effects of industrial policy on firm innovation activities indicating industrial policy can help alleviate the negative externalities in carrying out innovation activities for firms (Schumpeter, 1934) and somewhat overcome market failure. The results prove that the industrial policy is effective.
On the other hand, the related studies focus on the impact of government intervention on firm innovation (Lu & Wang, 2022; Fang et al., 2018). R&D spending is widely used as a measure of innovation (e.g., Seru, 2014). However, the existence of information asymmetry in innovation activities will lead to rent-seeking activities, which cannot reflect whether enterprises have made substantial innovation. Thus, we focus on the number of patent applications. The number of patents in China has grown rapidly in the past two decades (Chen & Zhang, 2019). According to the relevant report of the World Intellectual Property Organization in 2012, since 2011, the State Intellectual Property Office of China has become the organization that receives the largest number of applications for invention patents, utility models, and designs in the world. Our findings provide evidence for the positive role of government intervention on firm innovation outputs.
Second, with regard to the industry R&D characteristics, we found that the promotion effect of industrial policy on firm innovation outputs is manifested more in high-tech industries. The high-tech industry is knowledge-intensive and technology-intensive, with rapid technological development; and enterprises need high-quality cutting-edge creation to win in market competition (Zucker & Darby, 2007). Compared with firms in non-high-tech industries, firms in high-tech industries face the fiercer market competition (Cao et al., 2020). To win in the market, firms will spend their precious time and money on invention patents that can better represent the actual level of innovation. Furthermore, we find that industrial policy promotes firm innovation outputs via two mechanisms: alleviating firm financing constraints and increasing market competition.
We further find that the policy instruments play different roles across the different industries. In particular, the effectiveness of government subsidies seems to be larger for non-high-tech industries, whereas that of the tax and credit holiday seems to be larger for high-tech industries. In the context of COVID-19, determining how to better use industrial policy to enhance enterprise innovation activities and stimulate market economic activities is important for government. The findings indicate that government subsidies have not played its due role in promoting the innovation output of high-tech industry. In China, subsidies for enterprises’ technological innovation activities have always been the focus of government resources at all levels, especially for high-tech industries. However, China’s current supervision of subsidy approval and implementation process management is insufficient, leading to a lot of fraud or embezzlement, thus weakening the effect of the policy.
Managerial and Policy Implications
Based on the results, we believe that formulating industrial policy scientifically and rationally is essential to improve firm innovation outputs and enhance their international competitiveness. Additionally, in the process of implementing industrial policy, a reasonable combination of policy instruments for different firms can improve the effectiveness. Our work provides guidance to policymakers and innovation managers.
First, the government should adopt a more prudent attitude toward industrial policy. Before formulating and issuing industrial policies, government departments should do a good job of market research and solicit opinions widely to improve the scientific nature of decision making. Second, we suggest that the government should choose different policy tools according to the specific situation of different industries to stimulate the innovation willingness of enterprises to the maximum extent. Furthermore, government departments should give reasonable guidance and appropriate support for enterprises engaged in low-technology innovation and to improve the overall innovation quality. Lastly, compared with resource incentive, the government should change to competition incentive. In the process of implementing industrial policies, paying attention to promoting market competition, improving the system in which the market plays a decisive role in resource allocation and promoting the market to guide resource allocation effectively are necessary.
Limitations and Directions for Future Research
Some limitations persist in our work within the context of which, our results and recommendations should be interpreted. The first concerns the potential for endogeneity. During our analysis, we undertook the PSM-DID method as a robust test to ensure that such constraint does not affect our results. In addition, the industrial policy we used is a macro variable at the industry level, whereas the innovation output of firms is a micro enterprise indicator. Thus, the existence of a reverse causality relationship is unlikely. However, some missing variables may persist, such as the industry’s own innovation level and development cycle, which may affect the formulation of national industrial policy standards. How to overcome the endogenous problems caused by the omission of variables in macroeconomic activities and identify the causal relationship between industrial policy and economic development needs further attention in the future.
A second limitation relates to the measurement of firm innovation outputs. Firm innovation is multi-faceted. Although this paper attempts to measure firm innovation outputs by using different types of patents, it still cannot comprehensively measure firm innovation level. Therefore, how to measure the level of enterprise innovation still needs further study.
Furthermore, future research is still necessary to investigate the relationship between market competition and government support policies. The result of mediating effect model shows that supported by industrial policy can improve the degree of market competition. The relationship still remains to be further studied. Other types of industrial policy instruments, as well as the joint role of these instruments are also worth to be included in the future research. This notion is useful for identifying more efficient and diversified mix of policy instruments to improve firm innovation outputs.
Footnotes
Appendix 1
The variables used in the estimations are defined as follows:
Appendix 2
Encouraged Industries.
| CRSD | Industry name | 11th | 12th | 13th |
|---|---|---|---|---|
| A01 | Agriculture | 1 | 1 | 0 |
| A03 | Forestry | 1 | 1 | 0 |
| A05 | Animal husbandry | 1 | 1 | 0 |
| A07 | Fishery | 1 | 1 | 1 |
| A09 | Agriculture, forestry, animal husbandry and fishery services | 1 | 1 | 1 |
| B01 | Coal mining and selection industry | 0 | 0 | 0 |
| B03 | Crude petroleum-and-natural gas industry | 1 | 0 | 0 |
| B05 | Ferrous metal mining and selection industry | 0 | 0 | 0 |
| B07 | Nonferrous metal mining and selection industry | 0 | 0 | 0 |
| B09 | Non-metallic mining and selection industry | 0 | 0 | 0 |
| B50 | Extractive services | 0 | 0 | 0 |
| C01 | Crude petroleum-and-natural gas industry | 1 | 1 | 0 |
| C03 | Food manufacturing industry | 1 | 0 | 0 |
| C05 | Beverage production | 1 | 0 | 0 |
| C11 | Textile industry | 0 | 0 | 0 |
| C13 | Garment and other fiber products manufacturing | 0 | 0 | 0 |
| C14 | Leather, fur, eiderdown and products manufacturing | 1 | 0 | 0 |
| C21 | Wood processing and bamboo rattan palm grass products industry | 0 | 0 | 0 |
| C25 | Furniture manufacturing industry | 0 | 0 | 0 |
| C31 | Paper making and Paper Products | 0 | 0 | 0 |
| C35 | Printing industry | 0 | 1 | 0 |
| C37 | Sporting goods manufacturing industry | 0 | 1 | 0 |
| C4 | Petrochemical plastics plastics | 1 | 0 | 1 |
| C41 | Petroleum processing and coking industry | 0 | 0 | 0 |
| C43 | Manufacture of raw chemical materials and chemical products | 1 | 1 | 1 |
| C47 | Chemical fiber manufacturing industry | 1 | 1 | 1 |
| C61 | Nufacture of Non-metallic Mineral Products | 1 | 0 | 1 |
| C65 | Smelting and pressing of ferrous metals | 0 | 0 | 0 |
| C67 | Smelting and pressing of non-ferrous metals | 1 | 0 | 1 |
| C69 | Manufacture of Metal Products | 0 | 0 | 0 |
| C71 | General machinery manufacturing | 1 | 1 | 1 |
| C73 | Special equipment manufacturing | 1 | 1 | 1 |
| C75 | Manufacture of transport equipment | 1 | 1 | 1 |
| C76 | Electrical machinery and equipment manufacturing | 1 | 1 | 1 |
| C78 | Instrument and cultural office machinery manufacturing industry | 1 | 1 | 1 |
| C81 | Medical manufacturing industry | 1 | 0 | 0 |
| C99 | Manufacture of computers and other electronic equipment | 0 | 0 | 0 |
| D01 | Production and supply of electricity, steam and hot water | 1 | 1 | 0 |
| D03 | Gas Production and Supply | 0 | 0 | 0 |
| D05 | Tap Water Production and Supply | 1 | 1 | 1 |
| E01 | Civil engineering construction | 1 | 1 | 1 |
| E05 | Decoration industry | 1 | 0 | 0 |
| F01 | Railway transportation | 1 | 1 | 1 |
| F03 | Road transport industry | 1 | 1 | 1 |
| F07 | Water transportation industry | 1 | 1 | 1 |
| F09 | Air transport | 1 | 1 | 1 |
| F11 | Transportation support industry | 1 | 1 | 1 |
| F21 | Storage industry | 1 | 1 | 1 |
| G | Information technology industry | 1 | 1 | 1 |
| G85 | Fixed line communication services | 0 | 0 | 0 |
| G87 | Information communication service | 0 | 0 | 0 |
| H | Wholesale and retail trade | 1 | 0 | 0 |
| H11 | Retail industry | 0 | 0 | 0 |
| I01 | Banking industry | 0 | 1 | 0 |
| I11 | The insurance industry | 0 | 1 | 0 |
| I21 | Securities and futures industry | 0 | 1 | 0 |
| I99 | Other Financial industries | 0 | 1 | 0 |
| J | Real estate industry | 1 | 0 | 0 |
| K01 | Public service | 1 | 1 | 1 |
| K10 | Postal service | 0 | 0 | 1 |
| K20 | Professional scientific research Service | 0 | 1 | 1 |
| K30 | Catering industry | 1 | 0 | 0 |
| K32 | Hotel industry | 1 | 0 | 0 |
| K37 | Health care services | 1 | 1 | 1 |
| K39 | Leasing and business service | 0 | 0 | 0 |
| K99 | Other social services | 1 | 1 | 1 |
| L01 | Publishing | 1 | 1 | 1 |
| L10 | Film and Television | 1 | 1 | 1 |
| L15 | Visual and Performing Arts | 0 | 1 | 1 |
| L99 | Other communication and cultural services | 0 | 0 | 1 |
| M | Miscellaneous | 0 | 0 | 0 |
Appendix 3
the calculation of O statistics:
following Böhning (1994), the formula of O statistics is as follow:
Where n is the number of observations, d
Under the condition that the mean and variance are equal, the O statistics obeys approximately Normal distribution. Therefore, if O statistics is larger than 1.96, the data set is excessively discrete.
Declaration of Conflicting Interests
The author(s) declared no potential conflicts of interest with respect to the research, authorship, and/or publication of this article.
Funding
The author(s) disclosed receipt of the following financial support for the research, authorship, and/or publication of this article: This research was funded by National Social Science Foundation of China [grant number 16ATJ003]; National Social Science Foundation of China [grant number 18BJY238]; National Statistical Science Research Project of China [grant number 2018LZ24]; Social Science Fund of Shanghai of China [grant number 2019EJB007]; and Social Science Youth Fund of Hunan Province of China [grant number 21YBQ074].