
Abstract
The population of urban poor in India is posing enormous challenges to urban planning as there is a huge scarcity of segregated data. The five-year plans give an overview of how urban poor population has been estimated for planning and how the data deficiency in planning for them has been realized. Areas populated by the urban poor have a constellation of issues, but without data a comprehensive understanding of their vulnerabilities is lacking. Segregated data are needed for evidence-based planning. Undoubtedly, there are challenges in collecting these data. However, these challenges need to be addressed as planning so far is based on an average situation of the urban poor population, while all urban poor and the slums cannot be said equally vulnerable. Segregated data of urban poor are essential for inclusive planning and to build sustainable cities.
Introduction
Cities are indicators of development. World-class cities give countries pride. However, these cities cannot be developed without meticulous planning. City planning in India is becoming a challenge because phenomenal urban growth has given rise to urban complexities and inequities. India, the world’s second most populated country, has 31.16% urban population (Census of India, 2011b). In terms of percentage, urban population in India ranks 207 in the world (The World Bank, 2016), but in real number, the country stands second (United Nations Department of Economic and Social Affairs, Population Division, 2014). As the country is gradually urbanizing, a distinction between the urban poor and the urban nonpoor arises owing to noninclusive urban planning. In cities, the slums have been the mainstay of the urban poor population. Thirty-eight percent of India’s slum households are in 46 million plus cities, and among top cities, it ranges from 44.1% in Greater Visakhapatnam Municiapal Corporation to 29.8% in Agra (Census of India, 2011a). The urban population of India has increased with a decadal growth rate of 31%, whereas the slum population has increased with the rate of 25.1% (Primary Census Abstract for Slum, 2013).
Slums, considered a by-product of urbanization (Basu, 1988), have been increasing with the numeric rise in urban population and towns. Table 1 compiled using Census 2011 data reveals some striking facts about the spread of slums. Table 1 shows that a total of 242 statutory towns are newly added but more significant for policy makers is the addition of 870 new towns where slum populations have been reported for the first time. Statutory towns have increased by just 6.4% in comparison with 7.8 times rise in statutory towns with slum population. In Census 2001, about 46% statutory towns were plagued with slum population, but in Census 2011, about 65% statutory towns have a slum population. Statutory towns without any slums have reduced by 30.54%, but statutory towns reporting slums have increased by 49.91%. The statutory and Census towns increased by 2,774, but the slum population data are available only regarding statutory towns. So, there is a large information gap about towns that are outside the statutory status (Srivastava, 2013a).
Statutory Towns and Towns With Slum Population in India.

On the basis of population, cities in India are classified as mega, metro, and Class I to VI, and towns as small, medium, and large. Such classification is used to prioritize cities in urban planning. The prioritization of cities in urban planning is done on the basis of population, not on the basis of the vulnerability analysis of urban poor living in cities. The primary reason for this is the nonavailability of data about the urban poor population. Data-based gaps about millions of urban poor population, who provide inexpensive services to urban middle and rich classes, have excluded them in urban planning. The urban poor population in India is ever increasing even after constant efforts of the government to address their housing, health, education, and livelihood necessities through social protection schemes, goal-based planning, and adopting Rights Based approach. The urban poor population in India is almost equal to the population of France. Thus, on the basis of the urban poor population, it can be assumed that the task of planning for urban poor in India is manifold than any other country and this is the reason that urban poor have now become a focal point of urban planning.
It is urgent to bridge the gap between urban poor and urban nonpoor to build inclusive cities, which are able to provide quality life to all. In economic planning, money is the main concern, whereas in urban planning, it is the quality of life (Bijlani & Roy, 1991). Standards for “quality life” cannot be set differently for rich or poor. In planning for urban poor, the issues of availability, accessibility, affordability, and awareness are prominent because urban poor differ from urban nonpoor on these four parameters. All these four As regarding urban poor can be understood only through data. The planning cannot be initiated without defining the problem, and problem cannot be understood without sufficient, relevant, standardized, and accessible data. Without data, the problem is obscured, alternatives are less, and the initiatives are directionless. Data on urban poor are one such area where India is facing a big vacuum. In the current article, an attempt has been made to understand how the planning of India has realized the need of urban poor data and why the need of segregated data has aroused in planning for urban poor.
Method
The article is conceptualized on the basis of theoretical analysis of secondary documents in which the five-year plans (FYPs) of India are the key documents. Other types of documents include policy documents, city plans, and guideline of national-level programs, daily newspapers, websites, different study reports, and books related to urban studies. The available data of Census of India 2001 and 2011, National Sample Survey Organization (NSSO), and National Family Health Survey (NFHS) have also been used to understand the availability of data on urban poor and their vulnerability in various contexts. Several documents are not referred to in the article but were consulted to develop a profound understanding of the need of segregated data about urban poor. The article is guided by the following research questions:
Results and Findings
Urban Poor Data in FYPs of India
In India, since 1951, the five-year planning is an important activity to envision the smooth development of the country. FYPs give a complete account of the postindependence development of India in different sectors. Analysis of these plans in the context of urban poor reveals the manner in which their issues have been addressed in the absence of segregated data. The evidence of data collection about slums comes right from the First FYP (1951-1956), which suggested slum surveys for slum clearance scheme. In the population Census 1961, the information on housing conditions was collected but issues were not comprehensively covered. Therefore, the plan regretted the unavailability of data on erstwhile building activities, housing requirements, material, and pricing issues.
The first ever estimation about the population of slum dwellers was found in the Sixth FYP (1980-1985) in which the slum population was estimated at about 33.1 million. Simultaneously, the plan also identified the unavailability of reliable data on investment in private housing as a gap. The Seventh FYP (1985-1990) identified tawdry water and sanitation facilities in urban poor areas as a major cause of morbidity and mortality. The plan also questioned the reliability of available data of urban population, whether they adequately covered the urban poor population, deprived of water and sanitation facilities. In the Eighth FYP (1992-1997) the statewise data of urbanization were given and an attempt toward research and evaluation of urban scheme was found. The Urban Low-Cost Sanitation for Liberation of Scavengers scheme was evaluated in three states to diagnose reasons for low impact of the program. In the Ninth FYP (1997-2002), the urban mapping scheme was launched to improve land-use planning. The Plan suggested strengthening of the database by forming National Data Bank and Monitoring Cells at the state and central level. A regular and timely collection of data on allocations, costs, and total houses constructed each year was recommended, but it was also identified that there was a lack of information on actual users of night shelters and coverage of footpath dwellers and their satisfaction with the scheme, Night Shelters/Sanitation Facility to Footpath Dwellers in Urban Areas. In the Tenth FYP (2002-2007), the population of urban BPL (below poverty line) was estimated and assumed that more than two-fifth percent of poor children would be slum dwellers. In the Eleventh FYP (2007-2012), the planning appeared more data based like survey data of National Family Health Survey was used to press needs for planning about health issues but it was in the context of only rural and urban. Towns were classified on the basis of population. The plan had provisions like the establishment of National Urban Information System, National Urban Databank and Indicators in each State nodal agency and capacity building of town planners for use of modern automated methods (Eleventh FYP, 2008b). The Twelfth FYP, developed for the period 2012-2017, has evidence-based situational analysis. For example, the Ministry of Urban Development, in its assessment of 423 cities in 2010, found none of the cities “healthy and clean” with respect to sanitation. The plan emphasized on development and maintenance of management information system (MIS) and knowledge warehouse on issues related to urban slums and creation of municipal-level MIS and other urbanization-related statistics. The Plan talked about designing multipronged strategies to address urban poor issues and identified the need for surveys in states to understand the migration pattern through systematic data collection to avoid the dependency upon macro-level data (Twelfth FYP, 2013b).
The issue of inclusive growth is becoming stronger as various governments in India are unable to control the spread of poverty. The question of how to reduce poverty has been a challenge for all the political parties in power. This is the reason that on papers the figures of poor have been calculated several times to show a decline by different committees constituted under planning commission. However, it has never been simple to determine the approximate population of urban poor, if not the exact, as shown in Table 2. Different sources have estimated different figures of urban poor population, even in the same year. For example, a United Nations (UN) report estimated urban poor population (by mid-year 2001) at 158.42 million, whereas Census 2001 and Town and Country Planning estimated at 52.4 million and 61.82 million, respectively, for the same year. Again, on one hand, the Census 2011 estimated the population at 64.10 million, and on the other hand, the Press Note of Planning Commission in 2011-2012 gave a figure of 52.8 million. The 12th FYP estimated different figure of urban poor population i.e. 94.98 million. The Hashim Committee report put the number of poor in urban areas closer to 70% (Sethi, 2013). Such high contradictions in figures of urban poor collected from different sources show that locating urban poor is an enormous challenge and one would need to diagnose the issue in depth.
Difference in Figures of Urban Poor/Slum Population in Different Documents.
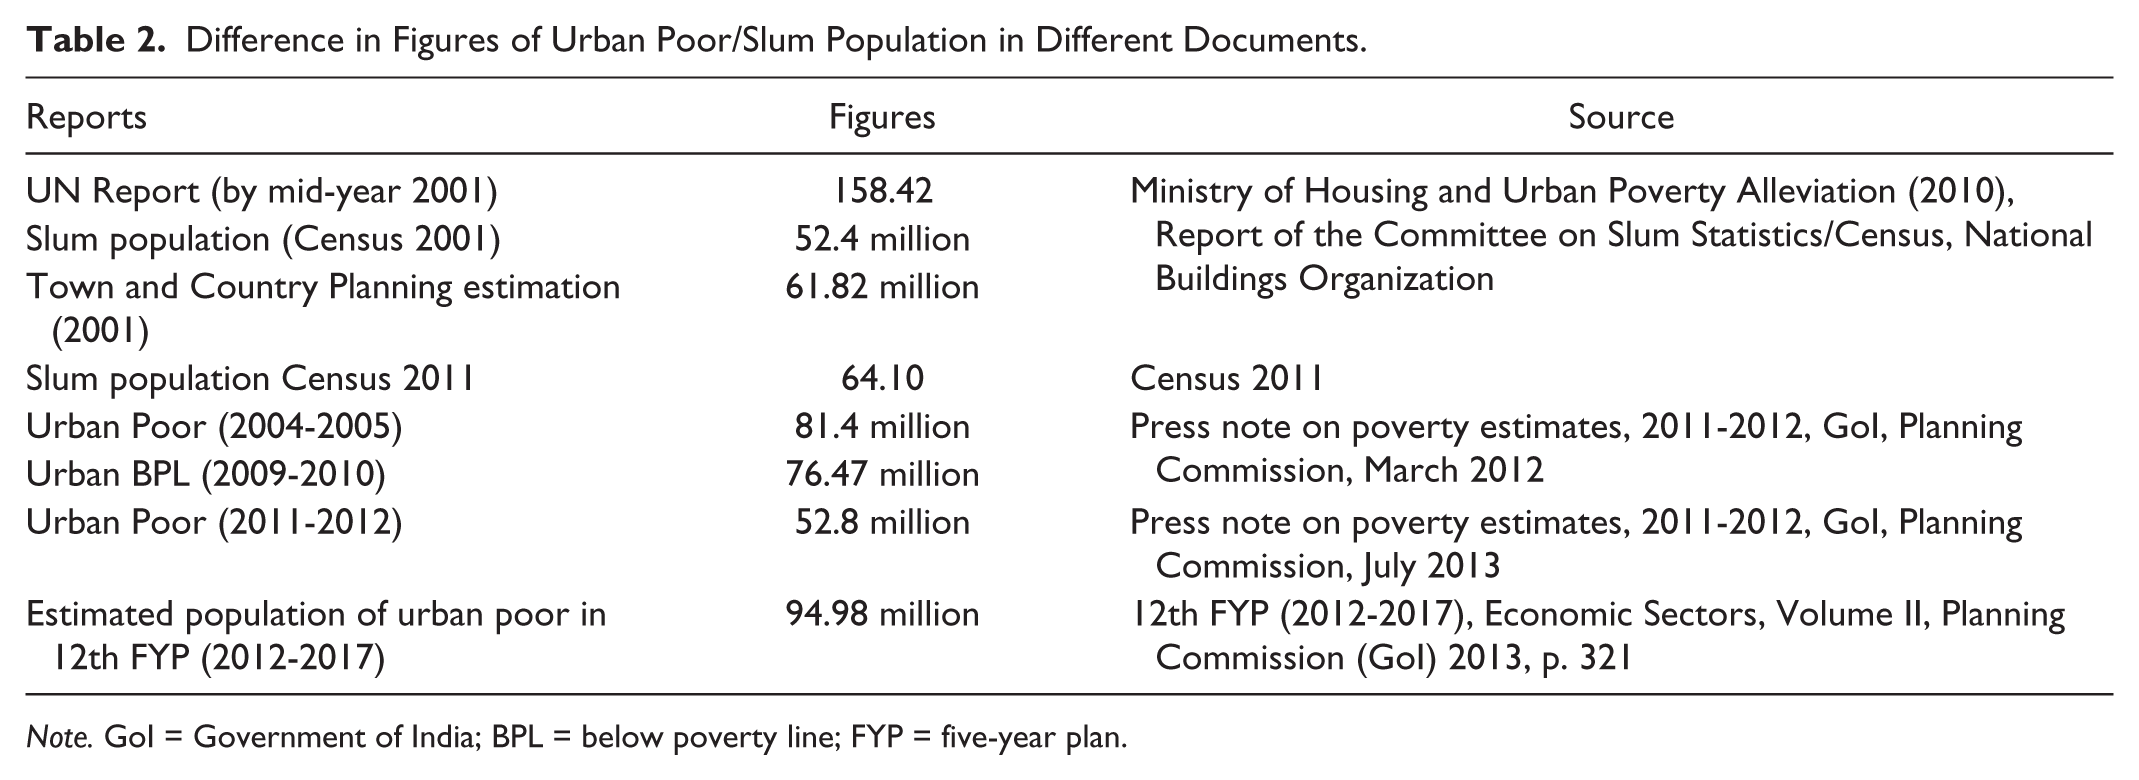
Note. GoI = Government of India; BPL = below poverty line; FYP = five-year plan.
A perspective analysis of FYPs shows that planning urban poor issues was largely based on the use of vague terms, estimations, and projections; for example, “significant proportion of the population in many cities is without shelter” (Planning Commission, Government of India, 1992c), “. . . cities where the slum population is large . . .” (Planning Commission, Government of India, 1992b); the Fifth FYP (1974-1979) did not even have the word slum; “. . . of the total urban population, nearly a fifth is estimated to constitute the slum population” (Planning Commission, Government of India, 1981); “urban poor, due to their low paying capacity and also due to the peculiar conditions governing their settlement patterns, are generally deprived of adequate water and sanitation facilities” (Planning Commission, Government of India, 1985); “. . . worst sufferers are the poor, whose access to the basic services like drinking water, sanitation, education and basic health services is shrinking” (Planning Commission, Government of India, 1992a); “. . . an increasing proportion of the urban poor and migrants live and often work” (NABHI’s, 2000); “. . . more than 40 percent of the poor children in the country would be residing mostly in urban slums” (Planning Commission, Government of India, 2003); and “. . . almost 30-40 percent of India’s urban population lives in slums” (Eleventh FYP, 2008a) (all emphases added).
Poverty estimates are more strongly found from the Ninth FYP onward. In the Ninth FYP (2000), the urban poor population was estimated by Modified Expert Group of Planning Commission, in which the urban poor population declined from 38% (1987-1988) to 32.36% (1993-1994). The Ninth (1997-2002) and Tenth (2002-2007) FYPs provided data of urban poor with estimations from 1973 to 1994. A comparison of the revised estimations of urban poor/urban BPL population in the Tenth FYP and previous FYPs is shown in Table 3 and Figures 1 and 2. The revised estimates in the Tenth FYP prove the previous estimates incorrect.
Estimated Population of Urban Poor in Various FYPs.

Source. Compiled from different FYPs of India and the Tenth FYP.
Note. FYP = five-year plan; BPL = below poverty line; NSS = National Sample Survey.

Urban poor population estimated in FYPs.

Urban poor population calculated in the Tenth FYP.
A review of the FYPs has also provided evidence of fair acceptance of planning gaps from the Sixth FYP (1980-1985) onward, that is, after the availability of data on urban poor. The observations made in different FYPs become harsh with the availability of data. For example, the slum relocation was not seen as a solution in the Sixth FYP. While the Eighth FYP identified poor planning a problem in managing the slum problem, the Ninth FYP further identified the planning gaps. The Tenth FYP detailed on the vulnerability of urban poor as a result of poor urban planning. The observations made in FYPs vis-à-vis the availability of slum-level data through large-scale surveys started gradually, as summarized in Table 4.
Observations About Planning for Urban Poor Areas in FYPs and the Contemporary Surveys.

Note. FYP = five-year plan; NSSO = National Sample Survey Organization; NSS = National Sample Survey; BPL = below poverty line; NFHS = National Family Health Survey.
An important conclusion can be reached from the above discussion that there is a lack of synchronization in the planning of the country. For a long time, urban planning remained confused with the urban poor population figures. Doing back calculations, experts making projections, which are then rejected by another group, these are all methodological calculations of economics that have nothing to do with vulnerabilities of being an urban poor. Shifting the line of poverty just on the basis of per day income or expenditure is like deleting the vulnerabilities of urban poor on paper but not in reality. Latest data, direct from the field, should be made available for the current planning to make it highly rational. The country, however, has hardly learned from such gaps in planning because till the Twelfth FYP (2012-2017) was developed, the data about urban poor of Census 2011 were not fully released. The Twelfth FYP was developed on the basis of 2004-2005 data of NSSO. So, the question of how planning can be specific, inclusive, and sensitive remains unaddressed. Another issue is that some descriptive data about urban poor is available only for big cities like million plus cities, which are only 53 in number out of 4,041 statutory towns (Census of India, 2011b). So, what about the urban poor population in remaining towns?
Need of Segregated Data About Urban Poor
To identify the rural poor, the BPL Census was conducted by the Ministry of Rural Development in 1992. Also,
To evolve a standard methodology, an Expert Group constituted by Ministry of Rural Development recommended an approach based on transparent and objectively verifiable indicators applicable in the rural setting. But no corresponding initiative had so far been taken for identifying the urban poor. (Planning Commission, 2012, p. 1)
This gap in urban planning was identified by the report of the Expert Group constituted under the chairmanship of Prof. S. R. Hasim in 2010 by the Planning Commission.
The urban poor data in different FYPs appeared just in terms of estimated population. It was only in the Tenth FYP that the vulnerability of urban poor was defined. But for in-depth understanding, the definition is not sufficient. Segregated data are necessary to create a true picture of the situation. Reanalysis of data of India’s largest health survey NFHS III (Table 5) shows how the socioeconomic and health indicators of urban poor are lagging behind urban nonpoor. The National Urban Health Mission proposed in the Eleventh FYP and rolled out in the Twelfth FYP has been conceptualized to bridge this gap. However, in the absence of segregated data, how the country-level planning will percolate further at the city, town, and ward level remains to be seen because so far the planning has been based on an average situation.
Some Key Indicators of Health of the Urban Poor in India From NFHS III.

Note. NFHS = National Family Health Survey; AWC = Aanganwari centres.
There are some robust issues that make the urban planning doubtful. As per the data of Census 2011, about one fourth of slum population belongs to socially vulnerable groups, that is, Scheduled Castes and Scheduled Tribes (SC/ST). It is also a known fact that urban poor are mainly the rural migrants. This means that these people have been excluded in different schemes of social welfare for vulnerable groups such as SC/STs in rural areas. The question here is, if this were to happen in cities as well, then whose failure would it be—that of planners, implementers, or the beneficiaries? This is a serious issue because one needs to understand why these populations have been excluded twice in our planning—once in rural planning and again in urban planning. So there are benefits of having segregated data of urban poor in urban planning. Some are briefly described here:
For inclusive planning
Commitments such as Shelter for All, Housing for All, Health for All, Education for All, Access to Quality Education for All, Clean Drinking Water for All, and Universal Health Care are repeatedly made in FYPs and policies. The question is, how will the urban poor fit in this “All” category without data? There are different policies to guide the plans and programs of the country on health, housing, education, adolescents, gender, and so on, but segregated data are needed to make them inclusive in the context of urban poor. Further categorization of urban poor on the basis of basic survival needs, the security issue, and standards of living, such as core poor, intermediate poor and transitional poor, declining poor, coping poor, and improving poor (Planning Commission, Government of India, 2003), can be done only through reliably segregated data. Otherwise, creating such categories can further lead to the exclusion of the real target during prioritization.
To understand the vulnerability
Comprehensive planning should not mean to cover a larger area through a single approach but to address multiple issues of all people living in that area. The data collected about urban poor living in slum areas should be able to narrate the situation, causes of that situation, and the mechanism to handle that situation. The data collected under various surveys have proved insufficient to visualize the vulnerability of urban poor for effective planning. The Tenth FYP (2002-2007) has classified vulnerability in the form of housing, economic, social, and personal aspects (see Box 1).

Source. Planning Commission, Government of India (2003, p. 627).
Urban poor are vulnerable, but merely calling them vulnerable cannot define their vulnerabilities in different aspects. For example, poverty of urban poor is not just related to income but also to access to water, sanitation, and modern fuel as explained in Human Development Report (2011). The link between urban poverty and vulnerability is a very complex issue. Poverty is the condition of denial of resources that are considered a necessity for social and economic well-being whereas vulnerability is more about insecurity, exposure to risks or hazards, and the coping mechanism in response. On the basis of this understanding, it can be said that all slums and slum dwellers are not equally vulnerable. But all sorts of vulnerabilities of an urban poor and a slum can be unfolded only through segregated multivariate data. Similarly, no two towns and no two cities are equally vulnerable. It is the burden of the urban poor population and their vulnerabilities that can decide the vulnerability of any geographical classification of city/town/ward. Therefore, the meaning of “segregated data” needs to be understood not just in terms of slum dwellers and slums but also with respect to each city, town, and ward to make ideal comparisons.
Collecting data and using them are two different aspects of any planning, and in both these stages, the authorities involved can be different. One who is collecting data can be a social scientist but the one who is going to use it can be from a non–social science discipline. In this context, it is pertinent that how the data can be made self-explanatory so that the planners are able to identify the role of different stakeholders of development. Good data can be collected in local languages but need to be interpreted well in the context of local planning needs. No single investigation into vulnerability indicators can be holistic and comprehensive to develop new indicators (Dwyer, Zoppou, Nielsen, Day, & Roberts, 2004). Urban poor come from different socioeconomic and cultural backgrounds. They may have similar problems but can have different ways of dealing with them. Planning needs more indicators to understand the situation and to arrive at solutions. So multidimensionality may lie both in the problems and the solutions. Merely using sympathetic words is not sufficient to make planning sensitive. Only segregated data can compare the vulnerability of one slum from the other and the people living in those slums.
To prioritize the action
Some slums enjoy comparative advantage over other slums, but in most surveys, the data such as status of slum (listed/unlisted or recognized/notified/identified) and availability of urban basic infrastructure services are collected and on the basis of these indicators the vulnerability is assessed. There can be many other parameters as well to assess the vulnerability of two slums, as tried in Table 6. Depending upon the situation of such parameters, the vulnerability of two slums A and B can be compared. Factors such as better political connections with local politics, nearness to city infrastructure, accessibility inside slum, and special occupational skill make some slums more popular and increase the chances of selection for intervention because authorities find it easy for showcasing and exaggerating even their trivial efforts in those slums. Slums that have strong political connections and more number of voters can do better negotiation with administration. Also, in popular slums, multiple nongovernmental organizations (NGOs) can be found working on common issues seeking the credit and appreciation to attract funds. The presence of NGOs in slums can also be a factor in giving an edge to a less vulnerable slum in highlighting their vulnerabilities in comparison with a more vulnerable, which is devoid of NGOs’ interventions.
Parameters for Comparative Analysis of Slums.

Note. NGO = nongovernmental organization.
All the indicators mentioned in Table 6 are not well covered in social surveys, and segregated data on such parameters are hardly available, because of which the chances of faulty planning always exists. So, the availability of segregated data of each slum can be a big advantage to assess the vulnerability and to prioritize the action for planning. Otherwise, a more vulnerable slum may get excluded in the selection process for planning and a slum that is less vulnerable may get selected. A detailed vulnerability index should be developed for all slums.
To know the real target
There are a flood of schemes for the poor and disadvantaged sections of the society. The benefits of many schemes are extended to those whose record is available in surveys undertaken by Urban Local Bodies or those who have legal documents to prove their residence in the slum. Slum surveys are done by urban local bodies to update their records and also to undertake new slum rehabilitation programs such as Rajive Awas Yojana, Basic Services for Urban Poor, and so forth. Taking advantage of the weakness in urban administration, the illegal claimants try to add their names to slum surveys or try to procure legal documents such as the Ration card, BPL card, and so on (Srivastava, 2013b) for the purpose of benefitting from those schemes. Availability of segregated data will filter the noneligible entries, and check the fraudulent practices and facilitate prompt implementation of schemes.
For positioning the infrastructure
Another major issue is the demand and supply of services in urban poor areas. The gap between demand and supply may be due to reasons that vary from wrong positioning of services to a deficient number of users. The coordination between demand and supply is an issue because at some places the low uptake of services leads to wastage of resources and at some places the higher demand leads to resistance in public because supply of services is inadequate. Supply of services on the basis of mere estimations or projections can only lead to gaps in demand and supply. Here it is important to mention an excerpt from Twelfth FYP (2013a):
The present system of estimating demand and supply of water in cities is rudimentary and leads to poor accounting and poorer planning. Indian cities compute demand by simply multiplying the population (as known) by an estimate of water demand per capita (as understood). This leads to huge variations between cities in terms of how much water needs to be supplied. (p. 161)
Thus, segregated data can help in assessing the demand and supply of services in urban poor areas in a real number. It can improve the service delivery by a better positioning of physical infrastructure in respect to location and timing of service delivery because behavior of urban poor toward the uptake of health and education services is well affected by the distance and timings of services.
To build convergence and partnerships
Convergence is an important strategy to speed up the development but yet not fully achieved in totality because stakeholders are not able to visualize their role as the potential contributors in addressing urban issues. Data sharing is one such area from where the convergence of social development schemes can be initiated. Different departments deal with different objectives and issues. Hence, they collect different sorts of data, which can be used by other departments to compensate their data needs and gaps. Similarly, the data can be used to do advocacy with interested corporates to pull the resources for interventions on education, health care delivery, livelihood training, drinking water, sanitation, and so forth, in urban poor areas. Segregated data can help to promote Public Private Partnerships (PPP) under Corporate Social Responsibility (CSR) mandate of companies because The Companies Bill (2012) has made it mandatory for the corporate to spend 2% of their profit for social issues. Most of the CSR funds are being spent on rural development because rural population is about 70% in India. Another reason was that scope of working with urban poor population is not very well highlighted. The segregated data can bring forth the harsh realities in lives of urban poor and will motivate the corporate sector to mobilize their fund on issues listed under Schedule VII of sections 135 of The Companies Bill (2012) in urban areas as well.
To eliminate myths
Segregated data are important to refute several prejudices toward urban poor such as they are antisocial, uneducated, drug addicts, impediment in progress, unwilling to work, and so on (Share: The World’s Resources, 2010). Only the segregated data can break the myths like slums are inhabited by castes that fall at the lower rungs (Tiwari, 2005). Data can establish the facts that slum people often display a much higher degree of social adjustment and sharing than middle-class neighborhoods (Shivramakrishnan, 1978).
To know the contribution of urban poor in urban economy
Breaking myths about urban poor through segregated data will also pave the way for recognition of their contribution to the inclusive growth of cities. There are studies that have proved such facts, such as one done by Kala S. Sridhar and Venu Reddy of Public Affairs Centre regarding urban poor of Bangalore city in 2011. The study shows that “19 per cent of the city’s population contributes to nearly 14 per cent of the city’s economy” (Sridhar & Reddy, 2014).
In the Twelfth FYP, the urban areas are called engines of economic growth. The midterm appraisal of the Eleventh Plan (2007-2012) projected the urban share of GDP at 62% to 63% in 2009-2010 (Twelfth FYP, 2013b). If the share of the urban economy is increasing in GDP of India, then it is important to know the contribution of urban poor’s efforts in it. Also, without segregated data, it is difficult to understand how their exclusion in urban planning has affected on slow achievement of Millennium Development Goals by India.
Challenges in Collecting Urban Poor Data
Inclusive planning cannot happen until the barriers are eliminated, gaps are identified and challenges are sorted out because planning should be able to empower urban poor in all its forms, categories, and definitions (Srivastava, 2013a). However, there are many challenges that need to be addressed because those challenges have made the collection of segregated data difficult. The key challenges in collecting segregated data about urban poor are briefed below:
Definition of slum:
The inclusion of all urban poor becomes difficult when at the policy level there are conflicts and confusion regarding terms and definitions. It has led to the self-interpretation of terms and definition being used for defining the urban poor. In India, the slums in different cities are named differently. Also, the conditions of slums are not same everywhere. The urban local bodies in different states have set their own criterion to define the vulnerability of slums and the people living therein on the basis of socioeconomic conditions, topography, and access to urban basic services. The definition of slum area adopted by the state government is based on Slum Acts of the respective state (Ministry of Housing [MoH] and Urban Poverty Alleviation [UPA], 2010). Differences in these characteristics cause discrepancies between the parameters adopted by state governments and the agencies responsible for collecting slum-level data such as Registrar General of India and NSSO.
Different classifications:
Apart from the definition, slums as a geographical unit are classified with different terms such as declared and undeclared (used by NSSO for the survey in 1976-1977), notified/non-notified slum (used by NSSO in 1993 and 2002), and notified, recognized, and identified (used in Census of India, 2011a). In literature, some more terms such as listed/unlisted, informal settlement, squatter settlement, and pavement dwellers are found. Such classifications show conflicts in the system to confer slum status to a particular area. The surveys are done primarily in listed slums, due to which the vulnerabilities of people living in unlisted slums remain unnoticed. Not only that, often, the benefits of welfare schemes also goes to the people of listed slums alone, because slum dwellers of unlisted slums are declared illegible.
Urban poor terminology:
The term BPL was first used in the Sixth FYP (1980-1985), Urban Poor in the Seventh FYP (1985-1990), and then the term Urban BPL (also rural BPL) came into vogue. The term BPL is legitimized and qualifies one for demanding the services but the term urban poor shows just a sign of sympathy. Slum population is that population which is living in a slum, whereas urban poor criterion includes challenges such as limited access to employment opportunities and income; inadequate and insecure housing and services; violent and unhealthy environments; little or no social protection mechanisms, and limited access to adequate health and education opportunities” (The World Bank). In the absence of clarity on terms being used to denote urban poor, there is a scope for confusing arguments like all urban BPL are not living in slums. All slum dwellers are not BPL but counted as urban poor because they are living in slums. A Government of India analysis of 2005-2006 national survey data found that about 20% of the population of Delhi reside in slums. However, the proportion living in slums was greater than the proportion in poverty (14%), indicating that not all slum dwellers were poor, but most poor households were located in slums (Australia India Institute & The Nossal Institute for Global Health, 2011).
Number of slums:
Two factors act as barriers to reaching the final number of slums in a city, namely, multiple classifications of slums as discussed above and the boundaries of development authorities. Development authorities collect information on urban poor, slum areas, and squatter settlements only in their administrative division areas. Lack of clarity in administrative divisions, powers, and monitoring gives space to duplication or complete exclusion of slum areas, and reaching any final figure of slum areas in city becomes difficult. Due to lack of sharing of data among urban agencies, the figure of slums varies in government records as well. The exclusion of unlisted slums has created a huge data gap and also can be a cause contributing to the reduction in urban poor population in Census 2011, whatever projected. The projected slum population for 2011 was 24.7% (MoH & UPA, 2010), but it is only 17.4% in Census 2011. It is found that even after regularization of slum and providing all urban basic infrastructures, the area is still mentioned as a slum in government records.
Boundary of slum:
A slum is taken as a geographic unit for interventions for urban poor, and there is no specific boundary between a slum and nonslum area. The boundary of slum can overlap with a nonslum area and the peripheral areas which are under transition phase of rural to urban with the growth of city limits. They may even fall in two different wards, and ward is an administrative unit
Mobility:
The migration of slum dwellers and squatters frequently occurs within the same city or to different city/state for various socioeconomic reasons. It is, however, an obstacle for the system to reach them and to derive quality data. In a sample study of 257 households in eight slums of Jaipur city, only 17.9% of the sample households were living in the same slum from the beginning. Among the remaining 82.10% of households, 35.41% changed their location once, followed by 25.68%, 12.45%, and 5.41%, who changed their residence twice, thrice, and five times, respectively. The households who changed their location four times or six times were less than 2% (Srivastava, 2008). High mobility of slum dwellers is a challenge in data collection, service delivery, and monitoring of services.
Lack of resources:
Data collection at a micro level with more indicators undoubtedly increases the requirement of funds, time, expertise, research skills, and analysis. A lot of empirical data are collected about slums sporadically but there is no mechanism in place to ensure its availability at one place. Technology is the only way to collect data on different variables and indicators and to manage it. Modern urban planning emphasizes the development of slum-level MIS, municipal-level MIS, use of Geographic Information System, and so on. States, such as Tamil Nadu in India, have made some initiation in this regard (Lopez, 2013), but for many states, the availability of funds is a challenge. The urban local bodies in India are already under fund crisis due to which the devolution of power under the 74th Constitutional Amendment Act has not been completely done in many states. High mobility of urban poor is a big challenge in managing and updating the information regularly.
Sociocultural Challenges in Data Collection:
Sociocultural barriers are also a challenge in collecting data with urban poor. The sociocultural barriers prevent them from building rapport with the researcher and sharing information. There are many issues related to occupation, income, assets, and expenditure where people do not feel comfortable in disclosing correct information. The dimensions of poverty, and its relative distribution among different social classes, are significantly different when approached from an assets perspective, as opposed to an income perspective (Ratcliffe et al., 2007). These are the issues where people try to escape with approximate or false responses due to which the integrity of the data is suspected.
Respondents hesitate to share personal details such as stigma associated with health problems such as HIV/AIDS, leprosy, TB, and so on. This prevents people from sharing information because they fear that their status would be revealed to the public and in turn their social status would depreciate. The data on sensitive issues, such as domestic violence, sexual health, and so forth, are difficult to collect from the urban poor population as issues related to gender prevent access to female respondents, generally housewives and adolescent girls, for data collection. Therefore, health-related vulnerabilities of urban poor sometimes remain undercover.
Suggestions
The challenges in segregated data can be overcome by adopting a segregated approach in collecting and compiling data at smaller urban units. Government departments have the ability to reach all levels and have an already developed system. The importance of data has also been understood across the government departments. Different government departments are running a number of social welfare programs to access and benefit the vulnerable groups. There are field-level functionaries at community-level institutions such as Accredited Social Health Activists (ASHA) and Mahila Arogya Samiti (Women Group constituted in slums under National Urban Health Mission) of the Health Department, Field Functionaries of Department of Women and Child Development, and Sanitary Inspectors of Urban Local Bodies. All these field functionaries collect information on different indicators to provide services at the community level. An integrated MIS of different departments can be a way to improve the availability of data on urban poor. The data collected in a segregated manner through each department should be shared among different departments at the local level. The sharing of data by stakeholders available with them can compensate the data deficit, increase convergence, and reduce duplication of efforts.
Also, the Census-based survey needs to be made more comprehensive by adding more indicators, which may have implications on the budget, timeline, and other resources, but it will help get more information. Also, the analysis should be provided up to slum level. The specially designed surveys should not exclude the towns having lower population because the number of such towns may be less but they constitute a significant population of urban poor. Collecting data at lower units will help to highlight the local issues in planning. The bottom-up approach in planning is significant only when the bottom is strengthened enough to provide an insight to the upper level.
Promotion of online systems of data sharing is another IT-based solution to address the issue of data shortage on urban poor. Different development agencies/institutions conducted studies and pilots for various interventions in underserved areas. Many research scholars do their thesis on urban poor issues. Universities can take a lead in making such studies available online with the copyright of the author. There are different options that can be explored, experimented, and encouraged to improve the availability of segregated data of urban poor.
Conclusive Remarks
Whether it is the Third FYP or Twelfth FYP, there is a perception that the country can be made slum free. In the Third FYP, only six major cities were identified for immediate priority to deal with slum problems, whereas in Census 2011, this number reached 2,613. The side effects of segregated data deficiency have been proved costly. Averaging out the situation of urban poor has brought larger cities in limelight but eclipsed the small towns and cities and hence excluded the urban poor population living therein. Slums have a constellation of issues, and data are the only way to see each issue with a magnified view because averaging has masked the failures and gaps of urban planning for so long. In one decade, India developed two FYPs, and both the plans use the same data because Census is repeated after a decade. Also, experience shows that most of the time, planning is not able to achieve fully whatever is envisaged. Eventually, the same problems are boomeranging in a more severe form. Segregated data of urban poor can make a difference to expose the vulnerability, unveil the barriers in reaching urban poor, identify gaps in planning, and offer the options for future planning and implementation. Also, it will help to come out from the habit of categorizing poor.
Data will help in rationalized planning and budgeting, and also reserve the beneficiaries against schemes in the proportion of their number. It can help to develop new strategies to break the cultural rejections of technically sound initiatives for people like nomads. Data can be used for framing effective policies for slum dwellers that can withstand the pressure of urbanization. It will help to select a representative sample of urban poor and develop a new set of indicators pertaining to access, coverage, and service delivery to make the urban governance more accountable. A strengthened database will make monitoring of service delivery easier. It will allow stakeholders working at city and slum level to think about the issues on which capacity of community needs to be built, identifying the groups that need to be strengthened, type of services required, and the types of approach discernible, such as, slum clearance, environmental improvements, and sites and service approach.
The country now needs target hit planning, not just target-based planning. To hit the target, data are the ‘magic bullet’ in urban planning. Without segregated data, inclusive planning in the context of urban poor is merely a dream, and without inclusive planning, India cannot build the sustainable cities. Though segregated data should be used for segregate planning for urban poor but it will help to bring them into mainstream urban society. Segregated data will be able to show how many urban poor have moved out from the slum environment because it will be the real impact of our efforts.
Footnotes
Acknowledgements
The author is thankful to Ms. Priyanka N. of SAATHII, Chennai, for providing her inputs on the manuscript.
Declaration of Conflicting Interests
The author(s) declared no potential conflicts of interest with respect to the research, authorship, and/or publication of this article.
Funding
The author(s) received no financial support for the research and/or authorship of this article.
Author Biography
Ambey Kumar Srivastava is PhD in Anthropology. His thesis work was on urban poor. He is a development professional and has worked with International and national organisations in India in projects related to Health, HIV/AIDS and Resettlement & Rehabilitation issues.