
Abstract
Price dispersion is an important indicator of pricing strategy and market efficiency. However, the relationship between price dispersion and sales has not been explored, especially for durable goods such as automobiles. In this study, we use a unique data set from Autohome comprising the actual transaction prices of buyers to assess the extent of price dispersion in the new automobile market. Based on an empirical analysis of over 222,592 price observations for 59 vehicle models collected over a period of 48 months, we find that the percentage difference (PD) and coefficient of variation (CV) of new automobile transaction prices are 43.4% and 9.9%, respectively. In addition, the empirical results show that the price dispersions lower for non-sedan type, Chinese car brands, and produced by state-owned companies. We further investigate whether the increase in the price dispersion of a new automobile has a positive impact on automobile sales using a multiple quadratic regression model. The findings show that price dispersion has positively impact of sales. More interestingly, negative quadratic effects are observed, indicating a concave-down-increasing relationship between price dispersion and sales. This implies that an extreme price dispersion is less helpful than a moderate price dispersion. These findings advance knowledge of consumer buying behavior and seller pricing strategies, with important theoretical contributions and practical implications for automobile companies.
Introduction
Pricing is a crucial issue in both business-to-consumer (B2C) and business-to-business (B2B) environments and has attracted extensive research attention (Brynjolfsson & Smith, 2000; Clemons et al., 2002; Indounas, 2015, 2020; Indounas & Avlonitis, 2011). Companies often have to sell their products through distributors, so the implementation of pricing programs through agreements with distributors is an important issue. There are two common types of agreements: the agreement price strategy (where the company and its distributor agree on a minimum selling price or reach an agreement) and the unilateral policy price strategy (where the company independently determines prices; Israeli & Zelek, 2020). Under either agreement type, however, the distributor may use different marketing tactics (e.g., bundling or discounting products) or even breach of contract to optimize its benefits. This leads to differences in actual consumer spending on the same product. Therefore, an interesting question is whether the dispersion of the transaction price affects product sales, which can be an important reference for companies in their pricing programs with distributors. Formally, price dispersion refers to “the distribution of prices of an item with the same measured characteristics across sellers” (Pan et al., 2002, p. 433). Price dispersion is very important to sellers and buyers as well as the whole market. For a seller, price dispersion reflects their competitors’ pricing strategies and influences the seller’s ability to charge different prices than their competitors. For a buyer, price dispersion is a characteristic of alternative products in the market and affects search and buying behavior. For the market, price dispersion is a crucial indicator of information efficiency.
Recent empirical studies of price dispersion mainly focus on investigating listing prices (Clemons et al., 2002; Li et al., 2013; Pan et al., 2004) because these data are easier to acquire than transaction price data (Wang & Li, 2020; Zhao et al., 2015). Several recent studies use transaction prices to understand price dispersion in the online market (Chellappa et al., 2011; Ghose & Yao, 2011; Zhao et al., 2015). Ghose and Yao (2011) report that the dispersion of transaction prices is lower in the online Federal Supply Service (FSS) for U.S. government procurement (B2B market) than offline. Zhao et al. (2015) study luxury imported handbags sold on Taobao.com and find that the price dispersion of online transaction prices is lower than that of listing prices. By contrast, Chellappa et al. (2011) find higher price dispersion for transaction prices than for listing prices for domestic U.S. airline markets. Hence, the price dispersion of transaction prices may be small but is affected by the product category (Pan et al., 2004). Many studies have shown differences in the degree of price dispersion across product categories (Chiu et al., 2021; Pan et al., 2004; Shankar & Bolton, 2004). Prior studies mainly examine low-involvement product categories such as airline tickets (Chellappa et al., 2011; Cui et al., 2019; Ma et al., 2020), books (Clay et al., 2001, 2002; Li et al., 2013), CDs (Lee & Gosain, 2002; Pan et al., 2003), consumer electronics (Baye et al., 2003, 2004; Ghose & Yao, 2011), electricity (Nelson et al., 2018), gasoline (Noel & Qiang, 2019), and luxury goods (Zhao et al., 2015), and analyze only cross-sectional data (Brynjolfsson & Smith, 2000; Pan et al., 2003). By contrast, this study examines the automobile industry because automobiles are high-involvement products. We choose China’s automobile industry as the setting for study because China has been the world’s largest automotive market and automotive manufacturing country since 2009. This market is therefore representative and meaningful. According to an official report of the China Association of Automobile Manufacturers (2018) on global automobile sales, China was the world’s largest and fastest-growing automotive market in 2017, with annual sales reaching a new high of 28.9 million cars, an increase of 3.04% over the previous year.
Most prior studies of price dispersion focus on comparing the efficiency of online and offline markets (Brynjolfsson & Smith, 2000; Zhuang et al., 2018) or the drivers of price dispersion (Ghose & Yao, 2011; Pan et al., 2002, 2003, 2004), and few has focused on the potential role of price dispersion on product sales. This study seeks to fill this gap by addressing the following research questions based on a large number of real transaction prices from consumers data: (1) How does the price dispersion of automobiles? (2) How does price dispersion vary across automobile characteristics (e.g., type, country of origin, and state-owned enterprise production)? (3) Does the price dispersion of automobiles contribute to the sales of automobiles? To address the research questions, we employ automotive transaction price data from Autohome (autohome.com.cn), which was established in 2005 and is China’s most popular online automotive community. Four-year panel data of 59 models are tracked in the empirical analysis. Our research is the first empirical study to use panel data to discuss the impact of price dispersion on sales, thus filling long-term gaps in the price dispersion literature. The analysis of this sample provides three main contributions. First, we expand the scope of price dispersion studies beyond low-involvement product categories (Pan et al., 2004). We study automobiles, a category that has not been examined in depth in the prior literature. Second, in terms of car types, the price dispersion for sedan is however greater than that for non-sedan. In terms of country of origin, the price dispersion is in descending order for Western car brands, Japanese and Korean car brands are larger, and Chinese brands. The price dispersion of cars produced by state-owned companies is smaller than that of cars produced by private companies. Finally, our research provides quantitative evidence that price dispersion can positively significantly impact sales. We further find that to enhance sales, extreme price dispersion is marginally less effective than moderate price dispersion. Therefore, our results provide a guide for managers to design price strategies to enhance sales.
The rest of this paper is organized as follows. In the next part, we review the relevant literature on price dispersion and present the research hypotheses. The third section describes the research context, the data collection process, the measurement of the variables, and the statistical methods. Next, we present our empirical results. Finally, we discuss the research findings and their managerial implications, future research directions and limitations.
Literature Review and Hypotheses
This literature review section consists of three parts. First, we propose two theories that explain price dispersion: product differentiation, information asymmetry, and price discrimination. Second, we discuss previous studies of the determinants of price dispersion and indicate gaps in the literature. Finally, we develop research hypotheses on the effect of price dispersion on sale.
The Reasons of Price Dispersion
Price dispersion refers to the distribution of prices, generally measured by the price range or standard deviation of an item, when the prices set by sellers of the same product and service in a given market differ (Pan et al., 2002). Price dispersion is one of the most common market phenomena and reflects the seller’s pricing policy and the customer’s search behavior (Clemons et al., 2002; Pan et al., 2002, 2004; Zhuang et al., 2018). Many previous researchers have reviewed the relevant literature and the reasons for the existence of price dispersion can be summarized into three ways: (1) information asymmetry, (2) product differentiation, and (3) price discrimination, which we explain in the following.
First, information asymmetry is the obvious reason for the ubiquity of price dispersion (Pennerstorfer et al., 2020; Salop & Stiglitz, 1977, 1982; Seifert et al., 2021; Stigler, 1961; Varian, 1980;). Information asymmetry means that consumers cannot compare prices due to a lack of information (Anderson & Renault, 2000). Two different driving perspectives, incomplete market information or differences in search costs (Carlson & McAfee, 1983; Stigler, 1961), are used to explain the phenomenon of price dispersion due to information asymmetry. According to the former, price dispersion is strongly influenced by informed customers (Brown & Goolsbee, 2002; Van Hoomissen, 1988). Informed customers usually obtain lower prices than uninformed consumers because uninformed consumers tend to buy products/services as long as the price is within their acceptable price range (Brynjolfsson & Smith, 2000). The latter perspective, information search costs, states that comparing product prices and quality may affect consumer-buying behavior (Lynch & Ariely, 2000). Generally, online search costs are expected to be lower than offline search costs. For example, Brynjolfsson and Smith (2000) show that e-retailers have smaller price changes than traditional retailers. Consequently, the online market is predicted to be more competitive and have a smaller price dispersion than the traditional market. This phenomenon is not surprising; the main motivation for customers to use an online intermediary is to find the lowest price. Empirical results indicate that price dispersion is derived from the information search cost for a wide range of industries, including the online book industry (Clay et al., 2001), automobile insurance industry (Dahlby & West, 1986), life insurance industry (Brown & Goolsbee, 2002), and prescription drug industry (Sorensen, 2000).
Second, product differentiation strategies such as bundle pricing or promotion strategies are another obvious reason for price dispersion (Clemons et al., 2002; Pan et al., 2002). When retailers use bundle pricing or product line pricing strategies, the unit price of each related product varies depending on the quality or content of the bundle, leading to price dispersion (Clemons et al., 2002). In our research context, the price of a car can be seen as quite comparable, but a variety of interior extras (e.g., electric windows and on-board computer), exterior extras (e.g., sunroof, aluminum wheels, and metallic paint), and safety extras (e.g., passenger airbag and anti-theft alarm; Hamilton & Koukova, 2008; Johnson et al., 1999; Klein & Ford, 2003) are available. In other words, the same automobile may have different price levels because of different optional extras. In a similar vein, Rosen (1974) and Varian (2000) predict that the service quality associated with a product could lead to price differences. For example, hotel prices vary over time depending on the type of room, such as refundable or non-refundable.
Third, price discrimination refers to a pricing strategy that targets different consumers with different price for the same goods or services. Some studies suggest that price discrimination is also a plausible cause of price dispersion (Clemons et al., 2002; Smith, 2001; Smith et al., 2001; Varian, 1980). Sellers can use price discrimination strategies to offer different prices to different customer segments as part of customer value management (Baltas & Saridakis, 2009). In general, a company will increase profitability by offering lower prices to high-value customers, thereby increasing customer retention and positive word-of-mouth (Lam et al., 2004). A good example of this is all loyalty programs in the retail industry. However, sellers tend to charge high prices to those customers who hold a better perceived value for the seller’s good or service. This difference between high and low prices leads to price dispersion between retailers and sales channels, or between the timing of sales (Smith et al., 2001). In summary, information asymmetry, price discrimination, and product differentiation strategies such as bundling equipment discounts (basic model plus optional accessories) to raise prices and promotional discounts to lower prices (Shankar & Bolton, 2004), all lead to price dispersion.
Determinants Influencing Price Dispersion
Many previous studies have explored the drivers of price dispersion, and here we provide a broad review of the literature on four categories of price dispersion determinants: market characteristics, seller characteristics, buyer characteristics, and product characteristics, as shown in Figure 1.

An overview of the price dispersion literature.
First, market factors that affect price dispersion include the number of competitors (Barron et al., 2004; Clay et al., 2001; Dahlby & West, 1986; Lewis, 2008; Venkatesan et al., 2007; Wang & Li, 2020), price levels (Brynjolfsson & Smith, 2000; Stigler, 1961), product popularity in the market (Lee & Gosain, 2002), and time (Baye & Morgan 2001; Brynjolfsson & Smith, 2000). Several empirical studies have investigated the link between the number of competitors and price dispersion (Lewis, 2008). Clay et al. (2001) find that greater competition leads to lower price dispersion, a result consistent with classic economic theory. Similarly, Dahlby and West (1986) suggest that more competitors in a market would result in less price dispersion in automobile insurance premiums. By contrast, Walsh and Whelan (1999) find that the price dispersion of the Irish grocery market increased with the number of competitors. Price levels are another important driver of price dispersion (Brynjolfsson & Smith, 2000), and Stigler (1961) shows that expensive products (such as an automobile) have less price dispersion than cheap products (such as anthracite). In addition, popular products attract greater attention and convey more information to consumers than other products, and thus price dispersion should be smaller for popular products than for non-popular products (Pan et al., 2003). Lee and Gosain (2002) also suggest that the degree of price dispersion depends on whether a product is popular or a niche product. Consistent with Brynjolfsson and Smith (2000), Lee and Gosain (2002) find that the prices of CDs on the Internet are generally lower than those of physical stores over time, whereas the prices of popular albums are comparable between the two channels. Price dispersion changes over time because the product lifecycle influences the number of competitors and the range of price dispersion (Baye & Morgan 2001; Clay et al., 2001).
Second, a number of empirical studies have addressed the issue of seller characteristics and price dispersion, such as service quality, retailer type (e.g., pure online, pure offline, or dual channel), brand, and reputation. Brynjolfsson and Smith (2000) and Pan et al. (2002, 2003) indicate that differences in e-retailers’ services (e.g., product information, shopping convenience, or retailer brands) might lead to differences in price. This result is consistent with the empirical observations of Venkatesan et al. (2007), who find that service quality has a positive impact on price dispersion across several product categories. In addition, the recent trend of multi-channel and omni-channel retailing has led to a more competitive market environment, with more retailers competing both online and offline, which directly affects price competition and price dispersion in online and offline markets (Zhuang et al., 2018). Ancarani and Shankar (2004) show that the average price is higher for multi-channel retailers than for pure-play e-tailers, regardless of whether the listing price or full price (including shipping costs) is considered. Furthermore, Brynjolfsson and Smith (2000) suggest brand, reputation, and product awareness as critical factors in the generation of price dispersion on the Internet. Similarly, Baye et al. (2004) use proxy variables to control differences in cost, reputation, awareness, and trust and find that these factors can explain approximately 17% of price dispersion.
Third, we review the impact of another important driver of price dispersion: buyer characteristics, such as price sensitivity, risk sensitivity, and consumer involvement. Lowering the search costs for price information could increase the price sensitivity of consumers and hinder high prices; richer non-price information could lower consumer price sensitivity and enable a wider range of prices (Degeratu et al., 2000). In an experimental study of wine, Lynch and Ariely (2000) show that as customers receive more information on product quality online, they become less price sensitive; by contrast, when cross-store price comparison becomes easier, shoppers’ price sensitivity increases. Shopping risk refers to the product of the customer’s perceived shopping risk and the uncertainty of the shopping transaction for a specific type of retailer (Zhuang et al., 2018). Shopping risk plays a crucial role in consumer shopping decisions (Kiang et al., 2011; D. J. Kim et al., 2008). In particular, potential financial risks due to fraud (e.g., sellers failing to deliver goods after receiving payment) and information privacy risks are major concerns for online consumers. As a result, shopping risk affects retailers’ pricing because consumers are willing to pay for more secure retailers (Dai et al., 2014; Gupta et al., 2004). Furthermore, consumer search behavior has been found to be related to the level of consumer involvement (Kujala & Johnson, 1993), as consumers with high involvement may exert more search efforts than consumers with low involvement, leading to differences in the perceived benefits of searching. In general, high involvement is associated with more expensive products, which encourage consumers to increase information search activities (Schmidt & Spreng, 1996). Therefore, Pan et al. (2003) show that expensive products have less price dispersion.
Finally, differences in uniqueness across a product category may affect the degree of price dispersion (Pan et al., 2004). Pan et al. (2003) and Ratchford et al. (2003) show that books have the widest price dispersion among eight categories, including CDs, DVDs, desktop and laptop computers, PDAs, software, and consumer electronics. Many empirical studies have tried to control for product/service differentiation using the hedonic price model (Clemons et al., 2002; Pan et al., 2002). For example, Clemons et al. (2002) examine price dispersion in airline ticket offerings by controlling for several sources of heterogeneity, such as matching requested departure and return times, minimizing the number of connections, and Saturday night stays. They note that price dispersion is still significant even after controlling product heterogeneity. In summary, different product categories may be associated with different levels of price dispersion, even after controlling for some factors.
Despite the abundant literature exploring the factors influencing price dispersion, few studies have investigated the impact of price dispersion on performance (W. G. Kim et al., 2014). Such a study would aid an understanding of consumer buying behavior and seller pricing strategies. The emergence and development of mobile commerce further underlines the importance of exploring the interaction and dynamics of price dispersion and sales performance. Accordingly, this study addresses the call by Pan et al. (2004) for additional research to further examine the relationship between price dispersion and sales. The next part explores the relationship between price dispersion and sales and highlights the unique contribution of this research.
Price Dispersion and Automobiles Sales
Imperfect information and search costs are important for online and offline pricing decisions, and competitive pricing choices often depend on whether the search cost is expensive or whether the product is distinctive. The latter may include price promotion strategies. Due to the increasing popularity of network technology and the rapid growth of online automobile websites, consumers are increasingly using the internet to search for information and compare product prices, thereby increasing price transparency and reducing price dispersion. Morton et al. (2001) find that customers who use online referral services (e.g., Autobytel.com) pay less for specific cars than those who do not. This is evidence that online information searches can be used to purchase a car or at least that the use of online referral services results in a better purchase price for a car. In recent years, the Internet has made the market more competitive, and low information search costs and associated easy price comparisons often result in reduced price dispersion (Bock et al., 2007; Morton et al., 2001; Tang & Xing, 2001).
Economists and marketing scholars frequently use two indicators, the percentage difference (PD) and coefficient of variation (CV), to describe and examine the price competition between various products or services to quantify price dispersion (Kocas, 2002; Zhao et al., 2015). Price dispersion reflects retailers’ pricing strategies and price competition (Ancarani & Shankar, 2004; Pan et al., 2002). In a recent study, Wang and Li (2020) find that transaction price dispersion on the Internet is large and persistent due to the strategic pricing behavior of sellers. In general, empirical evidence suggests that a greater density of competitors in the market will result in lower price dispersion (Clay et al., 2001; Dahlby & West, 1986). On the other hand, sales promotions are relatively easy to implement and have an immediate and substantial impact on sales performance (Hanssens et al., 2001; Pauwels et al., 2004). However, this competitive dynamic may also be affected by the company’s strategic orientation. For example, retailers with bundling strategies (e.g., car upgrades) might achieve better sales performance if they enter a market with a high percentage of high-end cars (e.g., luxury cars). Conversely, when entering a low-end market, discount promotion strategies may have a positive impact on sales. Regardless of the pricing strategy (e.g., EDLP, HILO, or bundling strategies), price dispersion will increase (Bolton & Shankar, 2003; Shankar & Bolton, 2004).
Previous research also shows that the presentation format of bundle prices and discounts influences consumers’ evaluations and choices (Arora, 2011; Hamilton & Koukova, 2008; Hamilton & Srivastava, 2008; Janiszewski & Cunha, 2004; Johnson et al., 1999). Generally, bundled products are attractive to consumers because they represent reduced search costs, contribute to reducing risk, and add value by integrating the components needed to create a valuable overall product experience (Harris & Blair, 2006a, 2006b). On the other hand, price promotion strategies are strongly related to lower competitor price levels. When competitors charge lower prices, retailers may use price promotion strategies to convey the relative attractiveness of their products, resulting in higher price dispersion (Bolton & Shankar, 2003; Shankar & Bolton, 2004). Johnson et al. (1999) show that both price bundling and price discounts affect customer satisfaction, the likelihood of recommending, and the likelihood of repurchasing. Drawing on the findings of these studies, an increase in price dispersion is more likely to come from a change in the price of cars sold with a bundle or discount strategy. In addition, retailers may also employ price discrimination (i.e., offering different prices to segments of consumers) as a key pricing strategy (e.g., Baltas & Saridakis, 2009; Brynjolfsson & Smith 2000), often leading to increased price dispersion (W. G. Kim et al., 2014). Based on these findings, we contend that an increase in price dispersion leads to more sales. Thus, we hypothesize that:
H1: The price dispersion of automobiles has a positive effect on automobiles sales.
With the proliferation of the Internet, consumers can easily compare product prices, making search costs virtually non-existent; however, price dispersion has not disappeared. Two main explanations have been offered. First, although consumers can obtain information about product characteristics at very low cost on the Internet. Relatively, sellers can also provide a large amount of information about products and services, which leads to the problem of information overload. In addition, service quality, such as product warranties, speed of delivery, and responsiveness to consumer questions and requests, can vary widely among retailers (Lindsey-Mullikin & Grewal, 2006). However, it is not easy for consumers to compare the service quality of different sellers. In general, sellers that provide high quality services can develop strong brands and charge higher prices (Waldfogel & Chen, 2006), which may lead to price dispersion of products. Second, sellers’ strategic behavior (i.e., product differentiation or price discrimination strategies) can lead to price dispersion (Clemons et al., 2002; Pan et al., 2002). In the context of this study, sellers may satisfy individual consumers’ needs by offering different product combinations, which further increases the chance of purchase. In other words, the same model vehicle may have different price levels due to the availability of different optional accessories. In addition, as part of customer value management, sellers may use price discrimination strategies to offer different prices to different segments of customers (Baltas & Saridakis, 2009).
From the seller’s perspective, this means more product differentiation competitive and price discrimination strategy, which enhances the seller’s opportunity to improve performance through potentially higher pricing. However, whatever the mix of product information or product options, it should be within the cognitive load of the consumer. Previous cognitive psychology-based research has shown that a broader scope of choices can negatively affect product selection (Iyengar, 2010). Notably, adding more combinations of options can lead to cognitive overload and uncertainty, which may actually reduce the likelihood of purchase (Iyengar & Lepper, 2000). Therefore, we expect a nonlinear relationship between the price dispersion and sales, modeled by including the price dispersion as both a linear term and a quadratic term. We expect the linear term to be positive and the quadratic term to be negative, indicating a concave-down-increasing relationship, implying that extreme price dispersion will be less helpful than moderate price dispersion. Thus, we propose hypotheses as follows:
H2: Automobiles sales exhibit a nonlinear relationship with price dispersion such that their sales initially increase and then decreases as price dispersion increases.
Data, Measurement, and Methodology
In this study, we use the panel data analysis method to explore the relationship between price dispersion and monthly sales in China’s automobile industry. We first examine the stability of each variable’s series using the panel unit root test. Then, we choose a suitable panel model based on the characteristics of the data and the corresponding parameters that must be estimated. In addition, we conduct a 1-month-lag model to examine whether price dispersion can predict sales for the next month.
Data Acquisition and Preprocessing
We use two main data sources in this research, namely, automobile sales and automobile characteristics, such as purchase price and consumer rating reviews. We collect monthly sales of each automobile from Gasgoo.com (auto.gasgoo.com), China’s largest automotive B2B marketplace. The automobile characteristic variables in our dataset are obtained from Autohome (autohome.com.cn), which was established in 2005 and is the most popular online automotive community in China. According to its financial report for the fourth quarter of 2016, this website has 24.7 million users, with an average daily staying time of 12.8 minutes. Web crawler technology was used to automatically extract online reviews from Autohome in April 2017. The raw dataset prior to preprocessing contained 740,993 reviews from September 2012 to March 2017.
The first step of data preprocessing is to remove reviews that are incomplete or have unusual purchase prices. Although reviews on Autohome can only be posted by formal members who have been verified through their mobile phone numbers, emails, or social media accounts, fake or incautious reviews cannot be avoided in this kind of public platform. For inclusion in this study, complete reviews must contain eight attribute evaluations, the purchase date, purchase price, posting date, and text comments. In addition, for each automobile, the purchase price listed in a review is considered an outlier if it is outside the specific range [Q1 − 1.5 × (Q3 − Q1), Q3 + 1.5 × (Q3 − Q1)], where Q1and Q3 are the first and third quartiles, respectively.
After setting the sample period from January 2013 to December 2016, we apply several filtering conditions to choose suitable automobiles for our empirical study. First, to exclude new car effects, automobile sales in the sample must be greater than zero in December 2012. Second, in the 48-month sample period, the sales volume per month is at least 10. In other words, the automobiles in our sample did not exit the market during the study period. Third, for each automobile, the total number of reviews is greater than 1,000, and the number of reviews with the purchase price is not less than five per month. Finally, a total of 59 automobiles meet all of the above filter conditions, and 222,592 price observations are used to estimate the corresponding cars’ price dispersion, the volume of WOM, the valence of WOM, and average purchase price per month. Since the characteristics of each automobile, for example, sales and the number of reviews, are observed every month, our research sample can be regarded as typical balanced panel data with 59 automobiles and 48 months.
Measurement and Sample Characteristics
Table 1 summarizes the definitions of the variables used in this study. The dependent variable, SALE, refers to the monthly sales of each automobile. As shown in Figure 2a, the distribution of SALE has a significantly positive skewness, so we use ln(SALE) as the natural logarithmic form of SALE in our analysis models. Although we only take 59 automobiles into consideration after data filtering, these automobiles in our sample have a critical influence in the China automobile market. Specifically, the total sales of these automobiles from 2013 to 2016 were 35.1 million, and the total annual sales of these automobiles in 2016 reached approximately 10.2 million, accounting for 43.4% of China’s annual new automobile sales. We use two indicators that are widely used in the literature (Ghose & Yao, 2011; Kocas, 2002; Zhao et al., 2015), the percentage price difference (PD) and coefficient of variation (CV), to measure price dispersion as the independent variable. PD is calculated as the highest transaction price minus the lowest transaction price, divided by the mean price in a month (Zhao et al., 2015). CV is calculated as the ratio of the standard deviation of the car’s price during a month to its mean price (Shankar & Bolton, 2004; Zhao et al., 2015). As shown in Figure 2b, the distributions of PD and CV approximate normal distributions.
Variable Definitions, Measurements, and Data Sources.

Gasgoo is the name of a website in China: http://auto.gasgoo.com.
Autohome is the name of a website in China: https://www.autohome.com.cn.

Distribution of monthly sales, percentage price difference, and coefficient of variation: (a) histogram of monthly sales and (b) histogram of price dispersion.
The control variables in this study include volume of eWOM (VOL), valence of eWOM (VAL), and product price (PRICE). The volume of eWOM is a signal of the existence and popularity of products. VOL is measured by the number of user reviews for a car in a month. VOL tends to attract more attention from consumers and strengthens sales (Elberse & Eliashberg, 2003; Tucker & Zhang, 2011). The valence of eWOM reflects previous consumer satisfaction with product quality and helps potential consumers predict a product’s quality (Li & Hitt, 2008). VAL is measured by the mean of user rating reviews for a car in a month. VAL captures positive or negative communication of eWOM and may also be positively or negatively correlated with product sales (Rosario et al., 2016; You et al., 2015). As another signal of product quality, PRICE is measured by the mean price of the car in a month.
Panel Data Analysis
Panel data analysis is employed in this study to examine the relationships between price dispersion (i.e., PD or CV) and sales. The panel data model is selected for the following three reasons: (1) it can be set to control individual heterogeneities; (2) by combining different values of different observation points in different cross-sectional units, the degree of freedom can be increased, the collinearity between explanatory variables can be reduced, and the effectiveness of the estimation results can be improved; (3) by repeatedly observing the same car, we can better analyze the dynamic changes in price competition and pricing strategies. Before establishing the panel regression model, we first conduct unit root tests and cointegration tests to confirm the validity of our research datasets and models. Next, Hausman tests are conducted to determine which type of regression model should be used. Finally, the parameters of interacting variables are estimated by using the panel regression model.
Due to the non-stationary nature of time series data, the stationarity of the variables must be examined before the regression models are established. In statistics, the unit root test examines whether variables are non-stationary when using an autoregressive model. A regression analysis conducted with non-stationary variables is called a “spurious regression” (Granger & Newbold, 1974). To avoid spurious regressions, the stationarity of the variables in this study are examined using two universally used unit root test methods: the LLC test (Levin et al., 2002) and the IPS test (Im et al., 2003). After the unit root test, Pedroni’s cointegration test is used to examine the long-term equilibrium relationships between panel data variables (Pedroni, 1999). The Hausman test is adopted to determine which form of panel model is more suitable for our research: a fixed-effects or random-effects model (Hausman, 1978). The null hypothesis is that the preferred model is random effects versus the alternative of fixed effects. If the p-value is significant (e.g., p < .05) then a fixed-effects model is used; if not, a random-effects model is used.
To identify the basic patterns of the consequences of pricing strategy in the automobile industry data, we use a panel regression model to determine if price dispersion (including PD and CV) has an effect on sales. Specifically, we allow sales to be a function of (1) the percentage price difference (PD) or coefficient of variation (CV), (2) the quadratic effect of PD (or CV), and (3) control variables including eWOM volume, eWOM valence, prices, and lagged sales. Thus, we establish our model as follows:


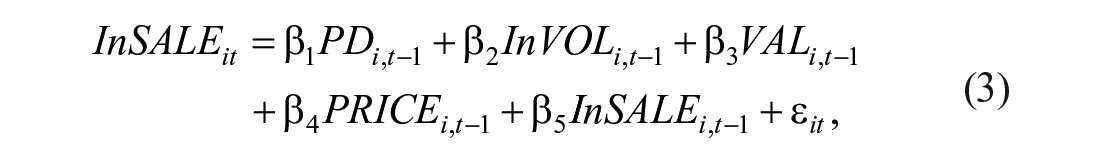

In equation (1), SALEit is the sales of car i at time t, and αi is the individual effect of car i. αi can change with time and is generally related to factors that cannot be directly observed or easily quantified. λt is the time effect. PDit is the percentage price difference of car i at time t; VOLit is the number of reviews of car i at time t; VOLit is the average review stars of car i at time t; PRICEit is the price of car i at time t, where β1, β2, β3, β4 are just mapped to their correlation coefficients; εi is the residual; and t refers to a specific time (i.e., time point after aggregation). Equation (2) adds PD2 it to the model. We consider the lagged effect of variables by including sales at time t − 1 in equation (3). Finally, we also add PD2i,t − 1 in the model in equation (4).
Empirical Analysis
Descriptive Statistics
The descriptive statistics including the correlations, mean, median, minimum, maximum, and standard deviations of all study variables are reported in Table 2. Our data cover 4 years from January 1, 2013, to December 31, 2016, 59 automobiles, and approximately 222,592 transaction price data. The typical balanced panel data include 59 automobiles and 48 months for a total of 2832 data. In this study, SALE is positively correlated with PD (r = .391, p < .001), CV (r = .257, p < .001), and VOL (r = .582, p < .001) but negatively correlated with VAL (r = −.052, p < .01) and PRICE (r = −.182, p < .001). We find that PD is also positively correlated with VOL (r = .378, p < .001) but negatively correlated with VAL (r = −.176, p < .001) and PRICE (r = −.141, p < .001). Similar results are obtained for CV. A positive correlation is revealed between CV and VOL (r = .136, p < .001). By contrast, CV has negative correlations with VAL (r = −.273, p < .001) and PRICE (r = −.139, p < .001). PRICE is negatively correlated with VOL (r = −.247, p < .001) but positively correlated with VAL (r = .440, p < .001).
Correlation Matrix and Descriptive Statistics for Related Variables of the Automobiles.

Note. SD = standard deviation.
Significant at 1%;
Significant at 0.1%.
Table 3 shows the sample observations, percentage price difference, coefficient of variation, and average price for different automobile characteristics. The average price of a sedan (14.462) is lower than that of a non-sedan (17.141), but the average PD and CV of a sedan are greater than those of a non-sedan. With respect to country of origin, for the car brands from the West, the average price is 16.417, and the average PD and CV are 3.306 and 0.541, respectively. The average price of car brands from Japan and South Korea is 15.639, and the average PD (CV) is 2.043 (0.364). The average price of domestic cars (i.e., the country of origin of the car brand is China) is 8.723, and the average PD and CV are 1.344 and 0.267, respectively. The average PD (CV) is smaller for cars produced by state-owned companies than for those produced by private companies, with PD (CV) values of 3.092 (0.442) and 3.832 (0.570), respectively.
Percentage Price Difference and Coefficient of Variation for Car Characteristics.

AVE. PRICE, average price in units of 10,000 RMB.
Figure 3a to f show how the price dispersion, as measured by the percentage price difference and coefficient of variation for different automobile characteristics, varies over time. From January 2013 to December 2016, Figure 3a and b show that PD (CV) is larger for sedans than for non-sedans. Figure 3c and d show that for the car brands from the West, PD (CV) is mostly greater than 3 (0.5), while for the car brands from Japan and South Korea, PD (CV) is between 1.5 (0.3) and 2 (0.4). PD (CV) is smallest for domestic cars, less than 1.5 (0.3). Figure 3e and f compare the changes in the PD (CV) of cars produced by state-owned companies and private companies over time. PD (CV) is smaller for cars produced by state-owned companies than for private companies.

Price dispersion (percentage price difference, coefficient of variation) and automobile characteristics over time: (a, b) sedan, (c, d) country of origin of car brands, and (e, f) produced by state-owned company.
Model Tests
Before the estimation, a stationarity test of the variables is conducted. The LLC and IPS tests are used to check the stationarity properties of the data. Table 4 clearly reveals that nearly all of the variables are stationary, since each of the null hypotheses of the unit root tests are rejected at the 5 percent significance level.
LLC and IPS Unit Root Test Results.

Note. The table examines whether a unit root exists for each variable. To avoid potential spurious regressions, two test statistics are applied to determine whether the variables in the model are stationary: (1) the LLC test (Levin et al., 2002) and (2) the IPS test (Im et al., 2003).
Significant at 0.1%.
In addition to the stationarity tests, the cointegration relationship in this model is examined using the Pedroni test. The results of the cointegration test shown in Table 5 indicate that most of the statistical tests reject the null hypothesis that a cointegration relationship does not exist.
Tests of Cointegration Between Sales and Other Variables.
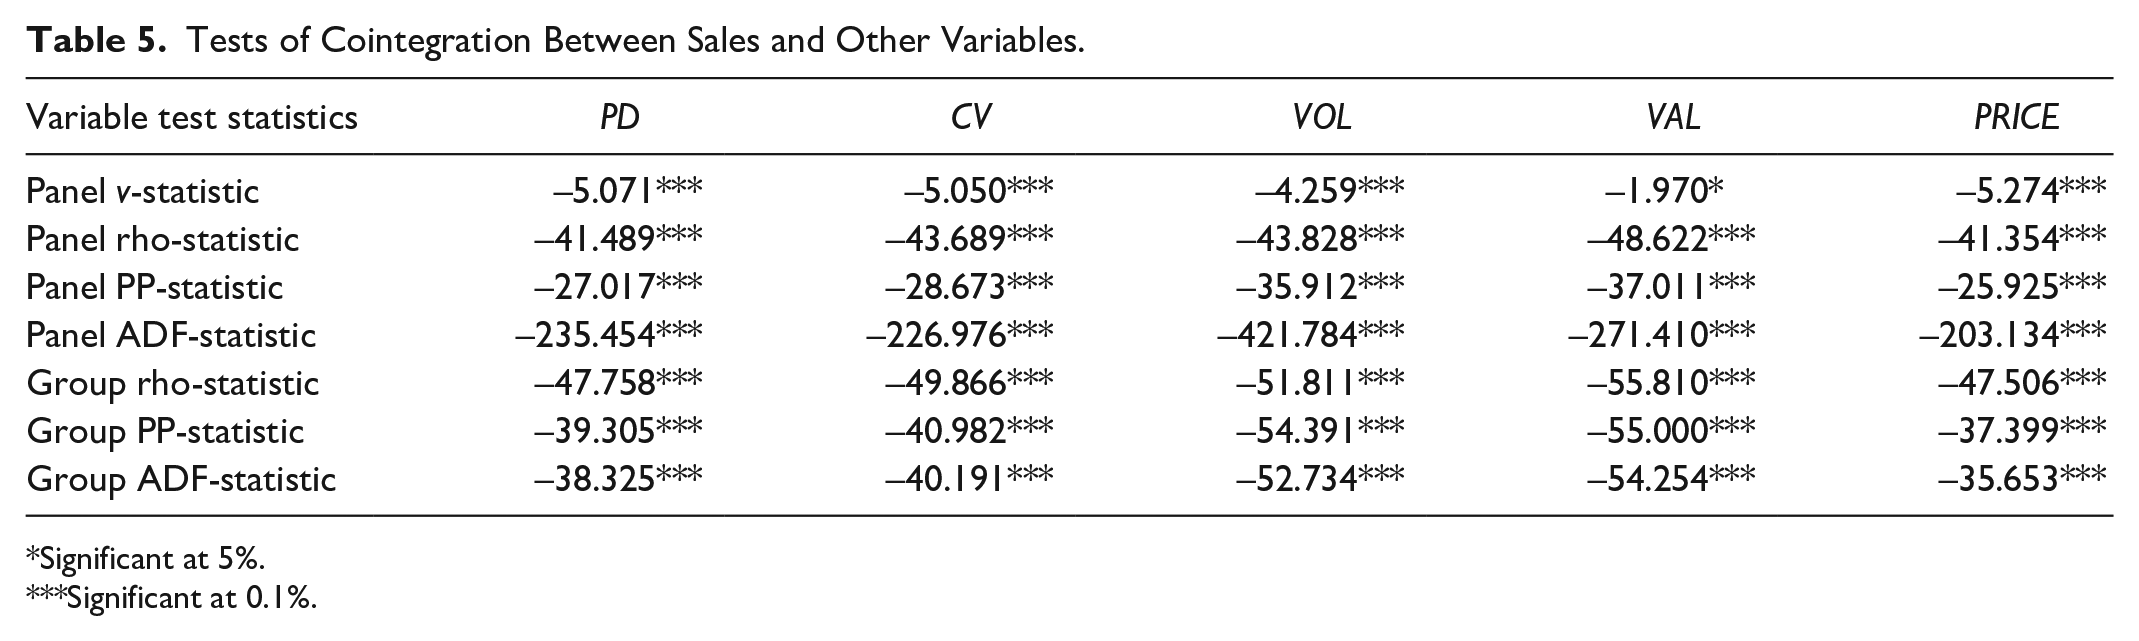
Significant at 5%.
Significant at 0.1%.
To estimate the panel data sample, the Hausman test is performed to choose whether a random-effects or fixed-effects model is more appropriate. The results in Table 6 reject the null hypothesis, and therefore a fixed-effects model is used in the following estimation.
Hausman Test Results.
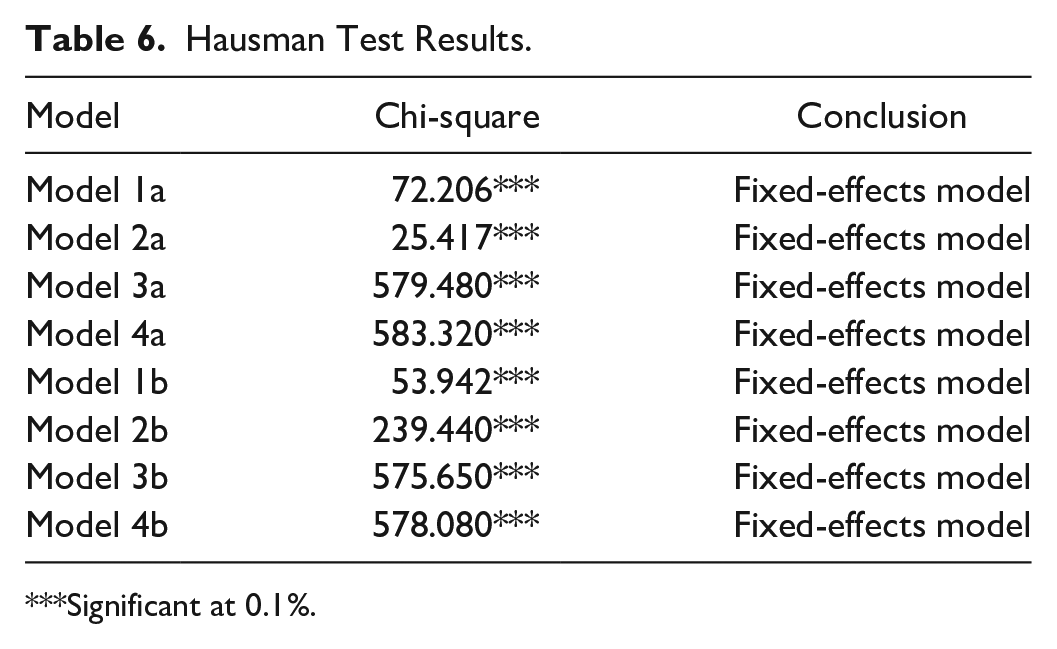
Significant at 0.1%.
Estimation Results: Relationship Between Price Dispersion and Sales
We conduct the regression analysis of our sample data according to our proposed fixed-effects model, and the results are shown in Table 7. We can see that PD has a significantly positive effect on automobile sales in Model 1a (β1PD = .884, p < .001). In addition, the number of reviews (VOL) is positively correlated with automobile sales, and the correlation coefficient is 0.483 (p < .001). The price is also positively correlated with automobile sales (β4PRICE = .452, p < .001). Similarly, CV has a significant positive impact on automobile sales in Model 1b (β1CV = 2.872, p < .01). The regression analysis results in Table 7 for Models 2a and 2b, which include the quadratic effect, show that compared to Model 1a (and 1b), the adjusted coefficient of determination increases from 0.144 (0.130) to 0.160 (0.160), indicating that the addition of the quadratic variables improves the original model.
Regression Results for the Fixed-Effects Model.

Significant at 1%.
Significant at 0.1%.
All price dispersion estimates in Model 2 are statistically significant (p < 0.01). The coefficient of the control variables are very similar to the results of Model 1. Turning to the effects of PD (CV), the main effect of price dispersion is significantly positive, with a coefficient of β1PD = 1.014 (β1CV = 3.578). More importantly, the quadratic effect of PD (CV) is significantly negative, with a coefficient of β22PD = –2.344 (β22CV = –33.583). Therefore, PD (CV) does not exhibit a linear relationship with sales. In particular, the positive main effect and negative quadratic effect imply a concave-down-increasing relationship between PD (CV) and sales. To further understand and verify this relationship, all price dispersions are grouped by PD (CV), and the mean value of the increment of PD (CV) is calculated for each group. The results are depicted in Figure 4a and b. The figure clearly illustrates that the main effects of PD (CV) are positive and that the marginal sales decrease with increasing PD (CV).
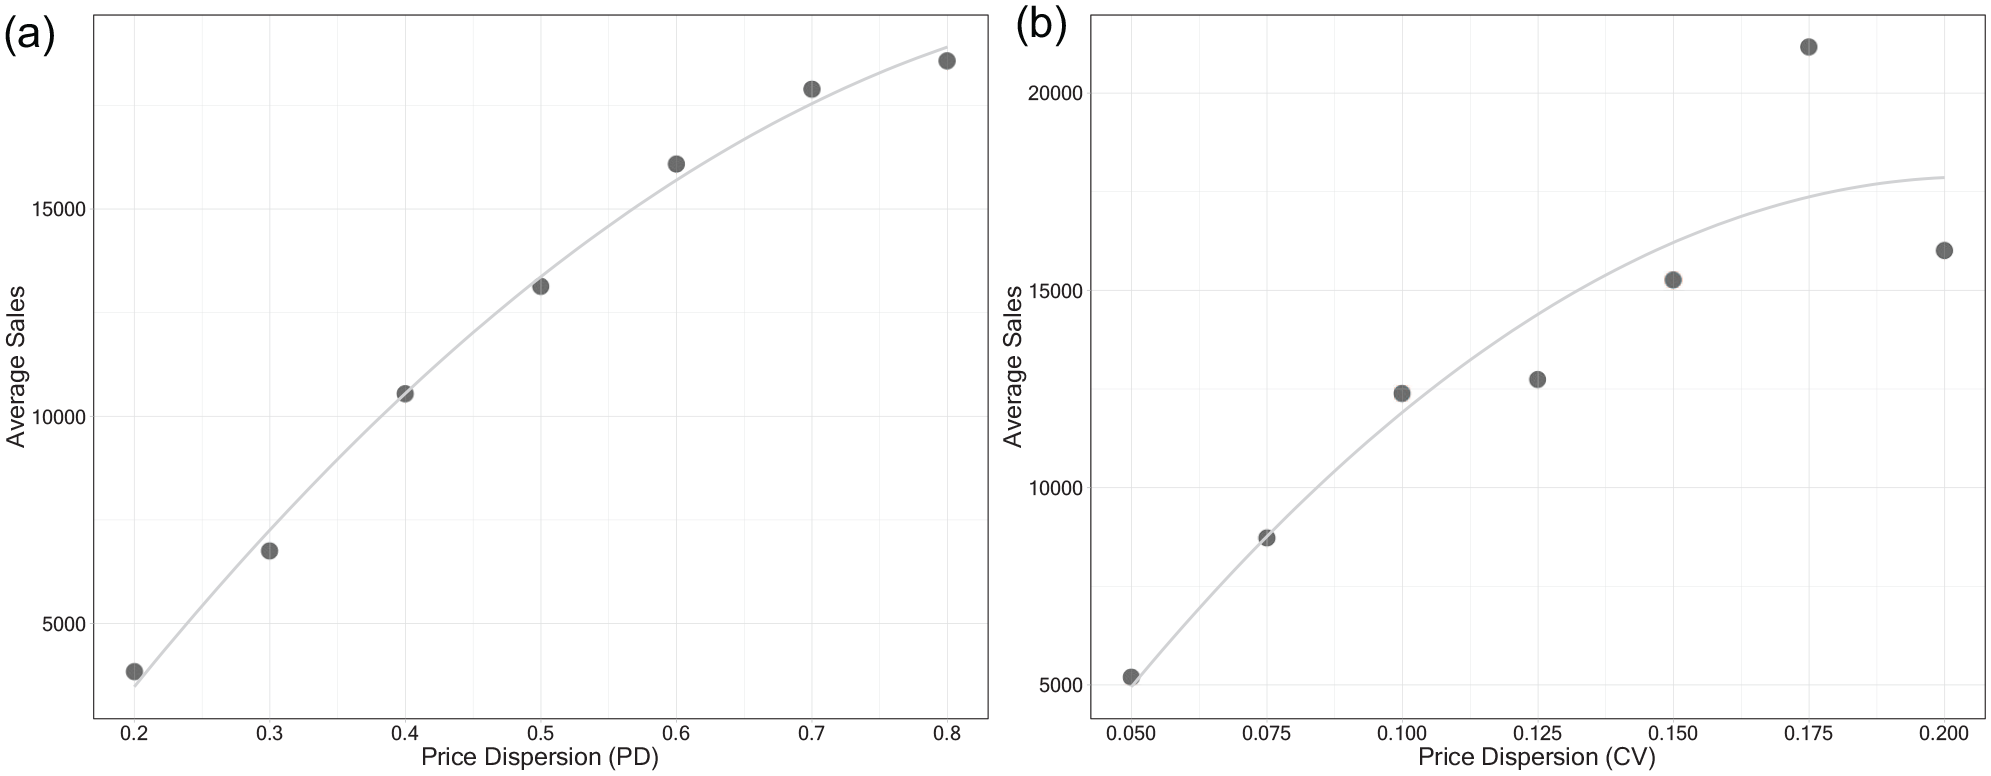
Impact of price dispersion on monthly sales: (a) percentage price difference (PD) and (b) coefficient of variation (CV).
We further consider the lagged effects of the variables on sales, which are shown in Table 8. We find that sales at time t − 1 have a positive and significant impact on sales at time t (β1SALE = .507, p < .001) in Model 3a. The results demonstrate the significant effect of PD on sales (β2PD = .289, p < .01). For the control variables, the results show that the number of reviews (VOL) and PRICE are positively associated with sales, whereas rating stars (VAL) are not significantly associated with sales. We also find a positive and significant relationship between CV and sales (β2CV = 1.388, p < .05) in Model 3b. The coefficients of the control variables are very similar to those in the results for Model 3a. In addition, in Model 4, the quadratic effects of PD are significantly negative (β22PD = –.650), whereas the quadratic effects of CV are nonsignificant.
Coefficients Estimated From Panel Data Analysis.

Significant at 5%.
Significant at 1%.
Significant at 0.1%.
General Discussion and Conclusion
Theoretical Contributions
Our study contributes to theoretical discussions of marketing/pricing in the following ways. First, most previous studies have used listing prices of products to estimate price dispersion (Clemons et al., 2002; Li et al., 2013; Pan et al., 2004), rather than the transaction price at which the good was actually purchased. Thus, using listing prices can lead to different estimates of price dispersion than using transaction prices (Ghose & Yao, 2011). This study is the first to use the transaction prices of a durable product (i.e., a automobile) to investigate price dispersion. We expand the scope of product categories examined in the price dispersion literature. Previous research focuses on product categories such as airline tickets (Chellappa et al., 2011; Clemons et al., 2002), books (Clay et al., 2001, 2002; Li et al., 2013), CDs (Lee & Gosain, 2002; Pan et al., 2003), consumer electronics (Baye et al., 2003, 2004; Ghose & Yao, 2011), and luxury goods (Zhao et al., 2015). Specifically, in our research context, the PD and CV of new car transaction prices are 43.4% and 9.9%, respectively. Second, we also find that the average PD and CV are greater for sedans than for non-sedans, for the origin of car brands from Western, Japan and South Korea than for the origin of car brands from China, and for cars produced by private companies than for cars produced by state-owned companies. Price dispersion research depends on context; as Baye et al. (2006) point out, “there is not a one-size-fits-all model of equilibrium price dispersion.” Therefore, we provide more insight into the empirical study of price dispersion under different automobile characteristics.
Third, most previous empirical studies have explored the factors that influence price dispersion (Chellappa et al., 2011; Ghose & Yao, 2011; Zhao et al., 2015); few studies have investigated the correlation between price dispersion and sales (W. G. Kim et al., 2014). A previous study by W. G. Kim et al. (2014) showed that price dispersion (as calculated by taking the difference between the maximum price and minimum price) is related to hotel performance. Their study found that online price dispersion has a negative impact on hotel performance, which is in contrast to the positive correlation between offline price dispersion and hotel performance. This study differs from previous studies both theoretically and methodologically. Theoretically, this study is the first to examine the effect of transaction price dispersion on sales. Our results show that price dispersion (i.e., PD and CV) has a significantly positive effect on sales. More interestingly, we examine multiple quadratic regression models. The positive main effects and negative quadratic effects indicate a concave-down-increasing relationship between PD (CV) and sales. In other words, to increase sales, extreme price dispersion is slightly less effective than moderate price dispersion. We also provide quantitative evidence in a new context as an empirical contribution to the pricing and marketing literature. Although the literature suggests that pricing decisions may exert a lagged or simultaneous impact on performance, a limited number of empirical studies focus on these effects. Methodologically, we construct a panel data set including the monthly price dispersion and monthly car sales. We further consider the lagged effects of these variables on sales. The results demonstrate that price dispersion still has a positive effect on sales after controlling for sales at time t − 1. According to our results, price dispersion positively affects sales, which means that sellers can adopt different pricing strategies that lead to an increase in price dispersion, which in turn enhances sales. For example, using price discounts to attract customers to increase sales, improving service quality and developing a strong brand to charge higher prices, implementing differentiation strategies to further increase the chance of purchase, and offering more product mix options to satisfy consumers’ needs to increase sales. However, because the quadratic effects of price dispersion are negative, when the price dispersion is too large, its impact on sales decreases.
Managerial Implications
With respect to the practical implications of this study, our findings provide insights on the impact of price dispersion on companies’ sales performance in an increasingly competitive automotive market and, more importantly, the role quadratic effects play in this setting. While the Internet facilitates consumers to obtain product and price information at low cost, the Internet also allows sellers to conduct various forms of information disclosure and promotion strategies. The amount of information can confuse consumers rather than help them make decisions. Our findings provide a more comprehensive understanding of the results of pricing decisions in ongoing concerns. From the perspective of the seller, a good pricing strategy is indispensable to maintain business profitability (Nagle & Holden, 2002). Previous research suggests that pricing strategies inevitably affect performance (Forman & Hunt, 2005; Shipley & Jobber, 2001). One of the most commonly used market penetration strategies is price adjustment (Indounas, 2020; Indounas & Avlonitis, 2011). For example, when a company aims to increase sales, lowering prices is an effective tactic to attract potential customers. Sellers can also differentiate by adopting differentiation strategies, such as bundling products, or improving the quality of services to establish their reputation and charge higher prices. For example, a sellers can offer two books as a bundle, an airline ticket and a room as a bundle, or automobile interior hardware and software as a bundle. Bundling makes the price comparison of component items difficult for consumers and may result in greater price dispersion.
Our results also provide two guidelines for distributors and automakers to follow. (1) Price dispersion is useful for sales, and price dispersion at time t − 1 remains valid for sales at time t even after controlling for sales at time t − 1. Generally, the more popular a brand/product is, the more likely a distributor will be to discount it to attract customers (Israeli & Zelek, 2020). Distributors can increase price dispersion through discounts, thereby affecting sales. On the other hand, distributors can also increase prices by bundling products, leading to higher price dispersion to increase sales. (2) To maximize sales, sellers should avoid providing too much information about the product and too larger price dispersion when using a pricing strategy. In other words, the effect on sales is greatest for appropriate price dispersion because marginal sales decrease as the level of price dispersion increases. Therefore, automakers should strictly control their pricing strategies. Appropriate promotion or bundling strategies can improve product differentiation and increase sales, but excessive promotion or bundling will reduce the impact of price dispersion on sales. When consumers observe that a seller provides price discounts continuously, these discounts may signal a poor seller image (e.g., low product or service quality, low reputation, or poor management), with the result that knowledgeable consumers start to question the seller’s strategic motivations (e.g., Biswas et al., 2013). As a result, it may weaken consumer purchase intention.
Limitations and Future Research Directions
Although this study provides useful empirical evidence for the effects of various types of price dispersion on sales, it is subject to limitations that also provide scope for future research. First, this study investigates the relationship between price dispersion and sales in the automotive industry. The time- and labor-consuming nature of the data collection process prevents us from collecting more data from a broader range of product categories. Many studies have revealed differences in the degree of price dispersion across product categories (Pan et al., 2004; Shankar et al., 2004). Future research can obtain sales data and explore the relationship between price dispersion and sales in other product categories to provide a more comprehensive understanding of the price dispersion phenomenon. Second, we only focus on the main and quadratic effects of price dispersion on sales. When searching for a product, consumers are exposed to multiple cues, such as price, customer reviews, and brand name (Wen et al., 2021). Although customer reviews were controlled for in this study, however, positive versus negative online reviews may have different effects on sales (Liu, 2006). In addition, brand names play an important role in price formation (Baltas & Saridakis, 2009). Further research can examine whether customer reviews (positive vs. negative online reviews) or brand names plays a moderating role in the relationship between price dispersion and sales. Third, this study focuses on the product-level dispersion of prices. A possible extension of this work would be to investigate market characteristics (Wang & Li, 2020), pricing strategies (Wang et al., 2021), and buyers’ characteristics (Wang & Li, 2020) in order to gain an in-depth understanding of market dynamics.
Conclusion
Price dispersion reflects the dynamic relationship between consumer purchase behavior and firm pricing strategies. This study employs a panel data model to investigate the interrelationship between automobile price dispersion and automobile sales while controlling for influential factors such as eWOM volume, eWOM valence, and product prices. This study examines the impact of price dispersion on sales in the unique Chinese automotive context. Based on 222,592 transaction price observations for 59 vehicle models collected over 48 months, we find that the price dispersion (i.e., PD and CV) of new automobile transaction prices are 43.4% and 9.9%, respectively. In addition, price dispersion is lower for non-sedan type, Chinese car brands, and produced by state-owned companies. This study extends the understanding of the context (i.e., durable goods) in the price dispersion literature. Moreover, price dispersion has a nonlinear relationship with sales, that is, the linear term is positive and the quadratic term is negative. This implies that extreme price dispersion is less helpful than moderate price dispersion. Therefore, we advocate that additional theoretical attention be given to the nonlinear effect of price dispersion. The results of this study provide guidance to managers in designing pricing strategies to increase sales.
Footnotes
Acknowledgements
The authors would like to thank the editor and anonymous reviewers for their helpful comments. They also would like to thank Dawn Schmidt for proofreading this article. The authors are listed in alphabetical order and contributed equally to the manuscript.
Declaration of Conflicting Interests
The author(s) declared no potential conflicts of interest with respect to the research, authorship, and/or publication of this article.
Funding
The author(s) disclosed receipt of the following financial support for the research, authorship, and/or publication of this article: This work was supported by the National Natural Science Foundation of China (NSFC no. 72103083).