
Abstract
In this study, we investigate the profitability of 10 well-known Japanese candlestick charting patterns using daily-based data on the component stocks of the Chinese SSE50 index, which involves a lengthy sample period from January 2000 to December 2018. The main contribution of this paper is that we conduct the first predictive power examination of Japanese candlestick patterns on the Chinese SSE50 stocks while taking into account trend and overbought/oversold conditions, and their profitability over different holding periods. Experimental results indicate that several bullish candlestick patterns such as Long White and Bullish Gap can produce a significant positive average return over certain holding periods. In addition, empirical results show that none of the bearish candlestick patterns we examined offers predictive power. However, without considering trend and overbought/oversold conditions, we find that the bearish pattern Gravestone Doji over a 10-day holding period has superior profitability if it is applied as a contrary trading signal. The robustness of our results is confirmed based upon a bootstrap analysis and an out-of-sample test. The findings of this study are beneficial for the market traders engaged in transaction of the SSE50 component stocks.
Keywords
Introduction
Technical analysts use historical market trading data such as price, volume, money flow, or turnover to predict movements of future prices (Gehrig & Menkhoff, 2006; Murphy, 1999). Proponents of technical analysis believe that such historical trading data contains crucial information about direction changes in future prices. However, according to Efficient Market Hypothesis (EMH), in the weak form of an efficient market, any information contained in past prices is therefore reflected in current prices, such that historical price data suggest no valuable information for forecasting future prices (Fama, 1970). Nevertheless, many researchers have proved that several technical analysis approaches could offer predictive power in financial markets (Brock et al., 1992; Chong & Ng, 2008; Deng et al., 2020; Fang et al., 2013; Fifield et al., 2005; Metghalchi et al., 2012; Trivedi, 2022).
Among the well-known technical analysis approaches, the Japanese candlestick is the earliest one that was initially applied to the Japanese rice market in the 1700s. Since Nison (1991) first translated the knowledge of the Japanese candlestick in English and introduced it to the western world, it has drawn considerable attention from not only financial market practitioners but also researchers from many western countries. Although there are many literature that have studied the profitability of the Japanese candlestick patterns on stock markets (Goo et al., 2007; Lu, 2014; Lu et al., 2012), few of them investigated the profitability of candlesticks on the Chinese SSE50 index in the Chinese market. Thus, in this study, we examine the profitability of several well-known Japanese candlestick patterns on the component stocks of the SSE50 index, which is regarded as a blue chip and an essential stock index of the Shanghai Stock Exchange. Since the component stocks of the SSE50 index represent the top 50 companies by capitalization, using those component stocks of the SSE50 index for profitability examination will be highly representative of the Chinese stock market.
Other than applying just the Japanese candlestick patterns, Goo et al. (2007) concluded that the profitability of Japanese candlestick patterns could be improved by employing other indicators simultaneously. Indeed, when market practitioners adopt the Japanese candlestick patterns for deciding if a buying or a short-selling signal is valid, they would generally also take into account the underlying stock conditions, such as whether the stock price is in an uptrend or a downtrend, or whether it has already been overbought or oversold, rather than just using the Japanese candlestick patterns. For instance, when a bullish candlestick pattern appears, professional market traders would generally also confirm the following two points before executing a long transaction: (1) The trading target is in an upward trend and (2) The trading target is currently not in an overbought area. Otherwise, it might imply an extremely high risk for trading. If either of those two conditions is not satisfied, it might not be appropriate to execute a long transaction at that time. Similarly, it would be more appropriate for market traders to execute a short-selling transaction when a bearish candlestick signal appears with condition confirmation that the stock price is in a downtrend and the stock is not in an oversold condition.
Literature Review
In the last decade, the profitability of Japanese candlestick patterns on stock markets has been investigated by numerous researchers. Lu et al. (2012) and Lu and Shiu (2012) examined the profitability of Japanese candlestick patterns on the Taiwan stock market, and they found that several candlestick patterns have predictive power. Among the literature that investigated the effectiveness of Japanese candlestick patterns on U.S. stock markets, many researchers found that only a small fraction of the candlestick patterns could provide correct direction predictions for market traders (Cohen, 2021; Lu et al., 2015; Lu & Shiu, 2016; Qiu & Liu, 2019). Apart from the investigation of stock markets in developed countries and areas (Naranjo and Santos, 2019; Xie et al., 2012), the profitability of candlestick patterns has also been examined in the stock markets of developing countries such as the Vietnamese stock market (Thanh et al., 2018), Thailand stock market (Tharavanij et al., 2017), Brazilian stock market (Prado et al., 2013), and Chinese stock market (Chen et al., 2016; Zhu et al., 2016).
However, in most of the related literature that examined the profitability of Japanese candlestick patterns, researchers generally did not consider the market conditions. Whereas, identifying whether a stock price is in an overbought or an oversold condition, or whether it is in an uptrend or a downtrend condition would be an critical part of establishing the trading risk. In the current literature, only a limited amount of them have considered the trend condition of stock prices (Batten et al., 2018; Heinz et al., 2021; Lu et al., 2015) or overbought/oversold condition (Tharavanij et al., 2017) when applying the Japanese candlestick patterns, few prior researchers considered the overbought/oversold condition for applying Japanese candlestick in the Chinese stock market. Nevertheless, market or stock conditions are essential for traders when they make a transaction in actual trading. Hence, in this study, we test the profitability of Japanese candlestick patterns with considering the uptrend/downtrend condition or overbought/oversold condition of stock prices. To identify the trend condition, a well-known trend indicator called moving average (MA), which is widely employed by lots of market traders and researchers, is employed in this research. In addition, to confirm the overbought/oversold condition, though there are several momentum oscillators that could be employed, one of the most common indicators called relative strength index (RSI) is employed by us in this research. Subsequently, we investigate whether Japanese candlestick patterns could create values for market investors with considering market conditions.
Additionally, Park and Irwin (2007) pointed out that it is important to take data snooping, out-of-sample problems, and transaction costs into consideration when examining the effectiveness of technical analysis approaches. Therefore, in this study, we also adopt a bootstrap analysis methodology adopted by Marshall et al. (2006). Meanwhile, an out-of-sample test is conducted, and transaction cost is considered in the experiments to examine whether Japanese candlestick patterns can create values for market practitioners. Moreover, except for the profitability test of Japanese candlestick patterns, we also conduct a simulation trading using the Japanese candlestick based trading strategies to examine their profitability. Compared with the profitability test of candlestick patterns, simulation trading results would be closer to actual trading.
The main contributions and innovations of this study could be summarized as follows. First, to the best of our knowledge, this paper is the first study that examines the profitability of Japanese candlestick patterns in the Chinese stock market with considering the overbought/oversold conditions, and we compared the difference between the trading strategy results of the following four groups: candlestick pattern only (unconditional), candlestick pattern appears in a trend, candlestick pattern appears with considering overbought/oversold condition, and candlestick pattern appears with considering both the trend and overbought/oversold conditions. Second, given the increased attention on the Chinese stock market from market traders and researchers all over the world, unlike most of the prior profitability test studies conducted on stock index of south Asian stock markets (Gunasekarage & Power, 2001) or European stock markets (Vasiliou et al., 2008), this study adopts the use of the individual component stocks comprising the SSE50 index. Since tests on index data are unable to be implemented and biased as a result of nonsynchronous trading (Day & Wang, 2002), investigations on the component stocks of a stock index would be more practical for market traders. Third, unlike previous studies that only researched the profitability test of candlestick patterns, we design the trading strategies based on candlestick patterns to test whether those Japanese candlestick pattern based trading strategies could make profits for traders who participated in the Chinese stock market.
The remainder of this paper is arranged as follows: a brief introduction to the candlestick charting, trend identification, and overbought/oversold condition identification are described in Section 3. In Section 4, we explain the research data, trading strategy, and research design adopted for this study. Empirical results of the profitability tests, bootstrap analysis results, and out-of-sample test results are reported in Section 5. Conclusions and future work are provided in Section 6. A description of the examined Japanese candlestick patterns is provided in Appendix A.
Methodology
Japanese Candlestick Pattern
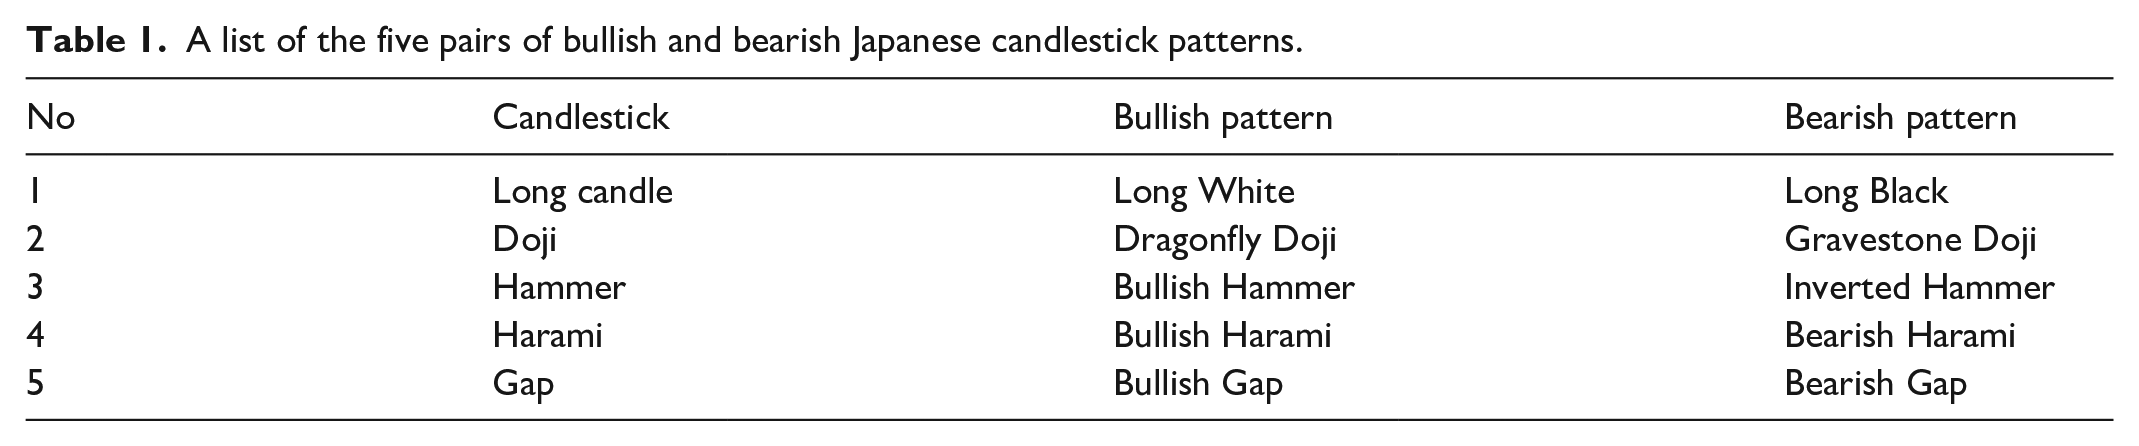
Candlestick charting was created by a Japanese rice trader named Munehisa Homma. He observed that the emotions of investors reflected in the price candlesticks might exert significant influences on the rice markets (Nison, 1991). A single Japanese candlestick line is created based upon four prices (open, high, low, and close prices) of a certain period, and one single line or several lines may then comprise one bullish/bearish pattern. There are many candlestick patterns to suggest a bullish signal, such as Long White, or suggest a bearish signal, such as Long Black. Five pairs of well-known candlestick patterns examined in this study are displayed in Table 1, and the real examples of the candlestick patterns that appeared in one component stock (Shanghai Pudong Development Bank) of the SSE50 index are provided in Figure 1. Details of the candlestick patterns are described, with their shapes being illustrated in Appendix A.
A list of the five pairs of bullish and bearish Japanese candlestick patterns.

Real examples of the 10 candlestick patterns appeared in historical data of Shanghai Pudong Development Bank.
Trend Identification
In this study, the market trend is measured and identified by a moving average (MA) rule (Kwok et al., 2009). MA is an average of time series prices over several consecutive periods. In this research, the MA is calculated using the close price of stocks. An uptrend is generally identified if a short-term moving average is above a long-term moving average, and the condition lasts for a certain period:

which implies an uptrend condition identification at time t + T. Similarly, a downward trend is identified if a short-term moving average is below a long-term moving average, and the condition lasts for a certain period:

which implies a downtrend condition identification at time t + T.
In the above equations (1) and (2), Pc(i) denotes the close price at time i; T represents the minimum length of lasting period, which is set to be three in this research; L and S, respectively denote the parameters of a long-term and a short-term moving average, and the values of L and S are set to be 20 and 10, respectively, as they have been widely used by traders in financial markets.
Overbought/Oversold Condition Identification
Relative Strength Index (RSI) is a momentum oscillator initially developed by Wilder (1978). It is a measurement of stock price change momentum, which is displayed as an oscillator (a line graph that moves between two extremes) that has a value range from 0 to 100. RSI is calculated based on prior sessions’ average gains versus losses. Traditional interpretation and use of the RSI is as follows: an RSI value of 70 or above indicates a stock is overbought, and it might be primed for a trend reversal or corrective pullback in price. In contrast, an RSI value of 30 or below indicates an oversold or undervalued stock condition. The calculation of RSI is as follows:
For each trading period t, an upward change U or downward change D is calculated as:

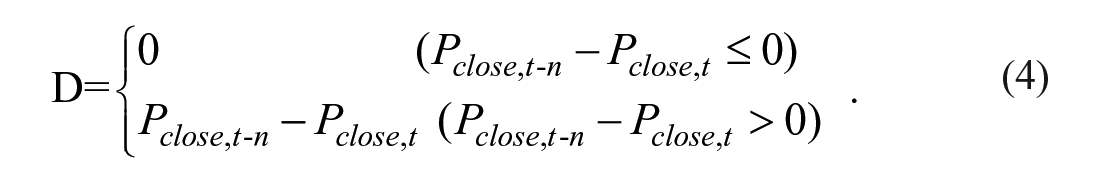
The ratio of these averages is the relative strength (RS) or relative strength factor:
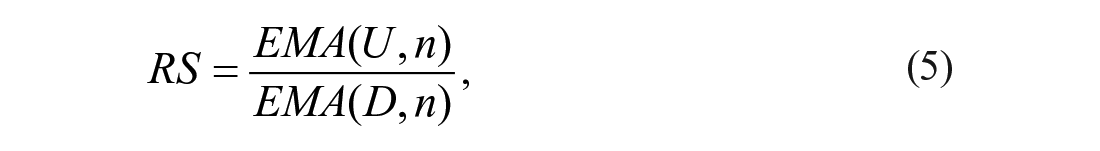


where n represents the period parameter for calculating the RSI, and EMA (Exponential Moving Average) is a type of moving average that places a larger weight and significance on the most recent data points. The relative strength factor is then converted to a relative strength index between 0 and 100:

In general, the greater/smaller the RSI value, the stronger and more protracted the bullish/bearish trend, whereas a more important usage is that it implies the trading target is at an overbought/oversold level. Thus, it would be extremely risky for traders to make a long/short-selling transaction. In the experiments, the parameter n of RSI is set to be 12 due to its popularity among traders in financial markets. Additionally, stocks are considered to be overbought when the RSI value is above 70 or oversold when the indicator value is below 30.
Data and Experimental Design
Data
The daily-based data on the 50 component stocks (see Appendix B) of the SSE50 index were employed to conduct profitability analysis, with the whole sample period ranging from January 2000 to December 2018. The trading price data of all component stocks are in four prices (open, high, low, and close) format. Among the 50 component stocks, 3 stocks that without data before 31 December 2014 were excluded. Thus, the resulting sample included a total of 47 stocks. In addition, since the out-of-sample test is important for investors, the robustness of research results was also examined. Subsequently, the whole sample period was divided into two sub-periods, which were the in-sample (Sub-period 1) and out-of-sample (Sub-period 2) periods with a length ratio of 3:1. The sample period before/after 1 January 2015 was employed as the in-sample/out-of-sample dataset. Subsequently, the sub-period 1 ranges from 2000-Jan-4th to 2014-Dec-31st, while the date from 2015-Jan-5th to 2018-Dec-28th is employed for sub-period 2.
Experimental Design
In practice, proponents of Japanese candlestick patterns also refer to the trend condition or overbought/oversold condition. For example, if a Long White appears in an uptrend, and the stock is not overbought simultaneously, it suggests a stronger signal for making a long transaction. Similarly, if a Bearish Gap pattern is formed in a downtrend, and the stock is not in an oversold condition simultaneously, it indicates an agreement with the short signal generated from the bearish candlestick pattern. Taking into account both trend condition and overbought/oversold condition might be beneficial for market traders to make a transaction in a relatively low-risk condition. In contrast, if the traders consider both of those two conditions to be satisfied when applying the Japanese candlestick patterns, the number of tradable signals are fewer, and traders may miss several great chances of trading. Therefore, it is necessary to examine whether or not the profitability of candlestick patterns could be improved by taking into account the trend or overbought/oversold condition since, indeed, many market investors tend to adopt additional indicators when using candlestick patterns to achieve superior performance. Therefore, this research investigates the profitability of Japanese candlestick patterns with considering trend condition and overbought/oversold condition.
Generally, Japanese candlestick patterns are used to capture short-term price movements, and the most useful time horizon is shorter than 10 days (Nison, 1991). Hence, in the experiments, we investigated the Japanese candlestick patterns with four different holding period lengths, which are 1-, 3-, 5-, and 10-day, for the profitability test. Note that the holding period is fixed when the period is decided, in other words, the opened position will be held until the expiration of the fixed period regardless of the daily candlestick recommendation during the position holding period. However, the profitability test considers all the subsequent candles during the period after the pattern’s occurrence.
In this study, we design four groups of trading rules based on candlestick pattern to identify their predictive power. The trading conditions of each trading group are shown in Table 2. Note that for the profitability test of each candlestick pattern based trading rule, there will be no trade at the time point where the conditions are not satisfied.
Long and Short-Selling Trading Signal and Conditions for the Four Groups.
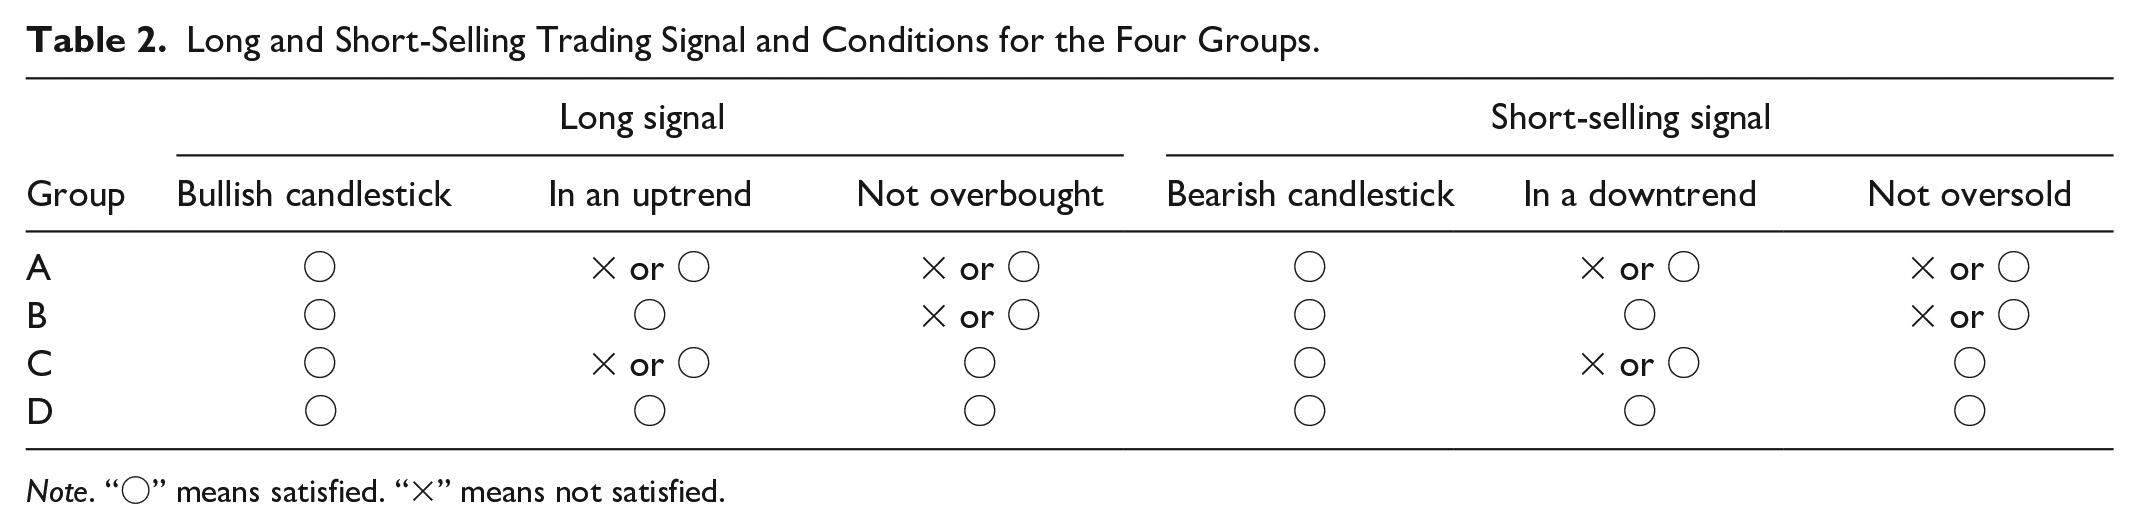
Note. “〇” means satisfied. “×” means not satisfied.
Regarding the profits generated by the candlesticks, the returns are calculated using the difference between the selling and buying prices, expressed as a percentage of the buying prices. It is assumed that the candlestick pattern is formulated on day t, then the n-day return Rb is defined as:

where Ps(t + k) refers to the close price for selling on day t + k, and Pb(t + 1) denotes the open price for buying on day t + 1. Note that for return calculation, we assume that market traders cannot make the transaction on the same day that the signal is generated since it is very difficult to determine the trading signal until the close price is known. Therefore, a more practical case is to enter at the open price of the trading day after the entry signal is generated. In addition, k represents the length of days for the holding period, which is comprised of 1- and 3-day (about half a week for business days), 5-day (1 week), and 10-day (about half a month) periods. Similarly, for short-selling transactions, the k-day return Rs is expressed as:

where Pb(t + k) is the close price for buying on day t + k; Ps(t + 1) denotes the open price for short-selling on day t + 1; k represents the length of days for the holding period, which is also comprised of 1-, 3-, 5-, and 10-day periods.
Experimental Results
Summary Statistics
Stock price data used in the experiments were derived from the Choice database (Database 1). Each candlestick line is constructed from four prices, which are open, high, low, and close prices. The summary statistics on the selected 47 component stocks (the period before 1 January 2015) are displayed in Table 3, with 102,184 observations of daily return. Note that the natural logarithm of these daily returns was utilized for analysis. The distribution characteristics were examined using five statistics: mean, standard deviation, skewness, kurtosis, and JB statistics. All four series were found to display positive mean and skewness, and the average returns of the time series have a near-zero mean. In addition, it should be noted that skewness and kurtosis were significantly different from 0 and 3, respectively, at the 1% significance level.
Descriptive Statistics of the Daily Returns.
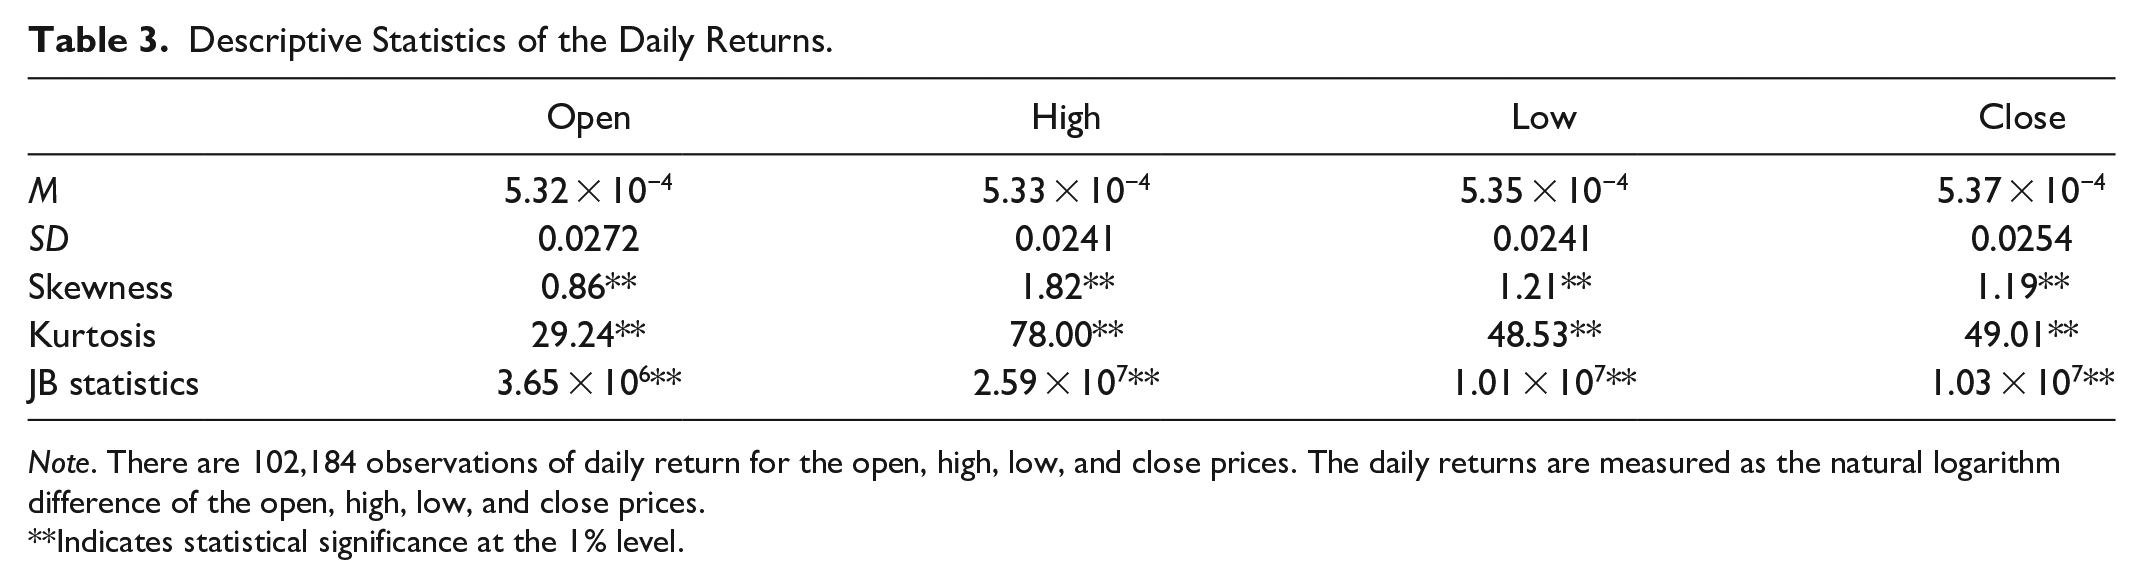
Note. There are 102,184 observations of daily return for the open, high, low, and close prices. The daily returns are measured as the natural logarithm difference of the open, high, low, and close prices.
Indicates statistical significance at the 1% level.
Candlestick Pattern Returns
Our analysis begins with a profitability examination of 10 candlestick patterns to examine their predictive power. The profitability test of Japanese candlestick patterns was conducted using a suitable test named the skewness adjusted two-tailed t-test (Mitra, 2011). On this test, the null hypothesis assumes that the average returns for the candlestick patterns do not differ significantly from zero:


where
Profitability Test of the Five Bullish Candlestick Patterns Over the Period 2000 to 2015.
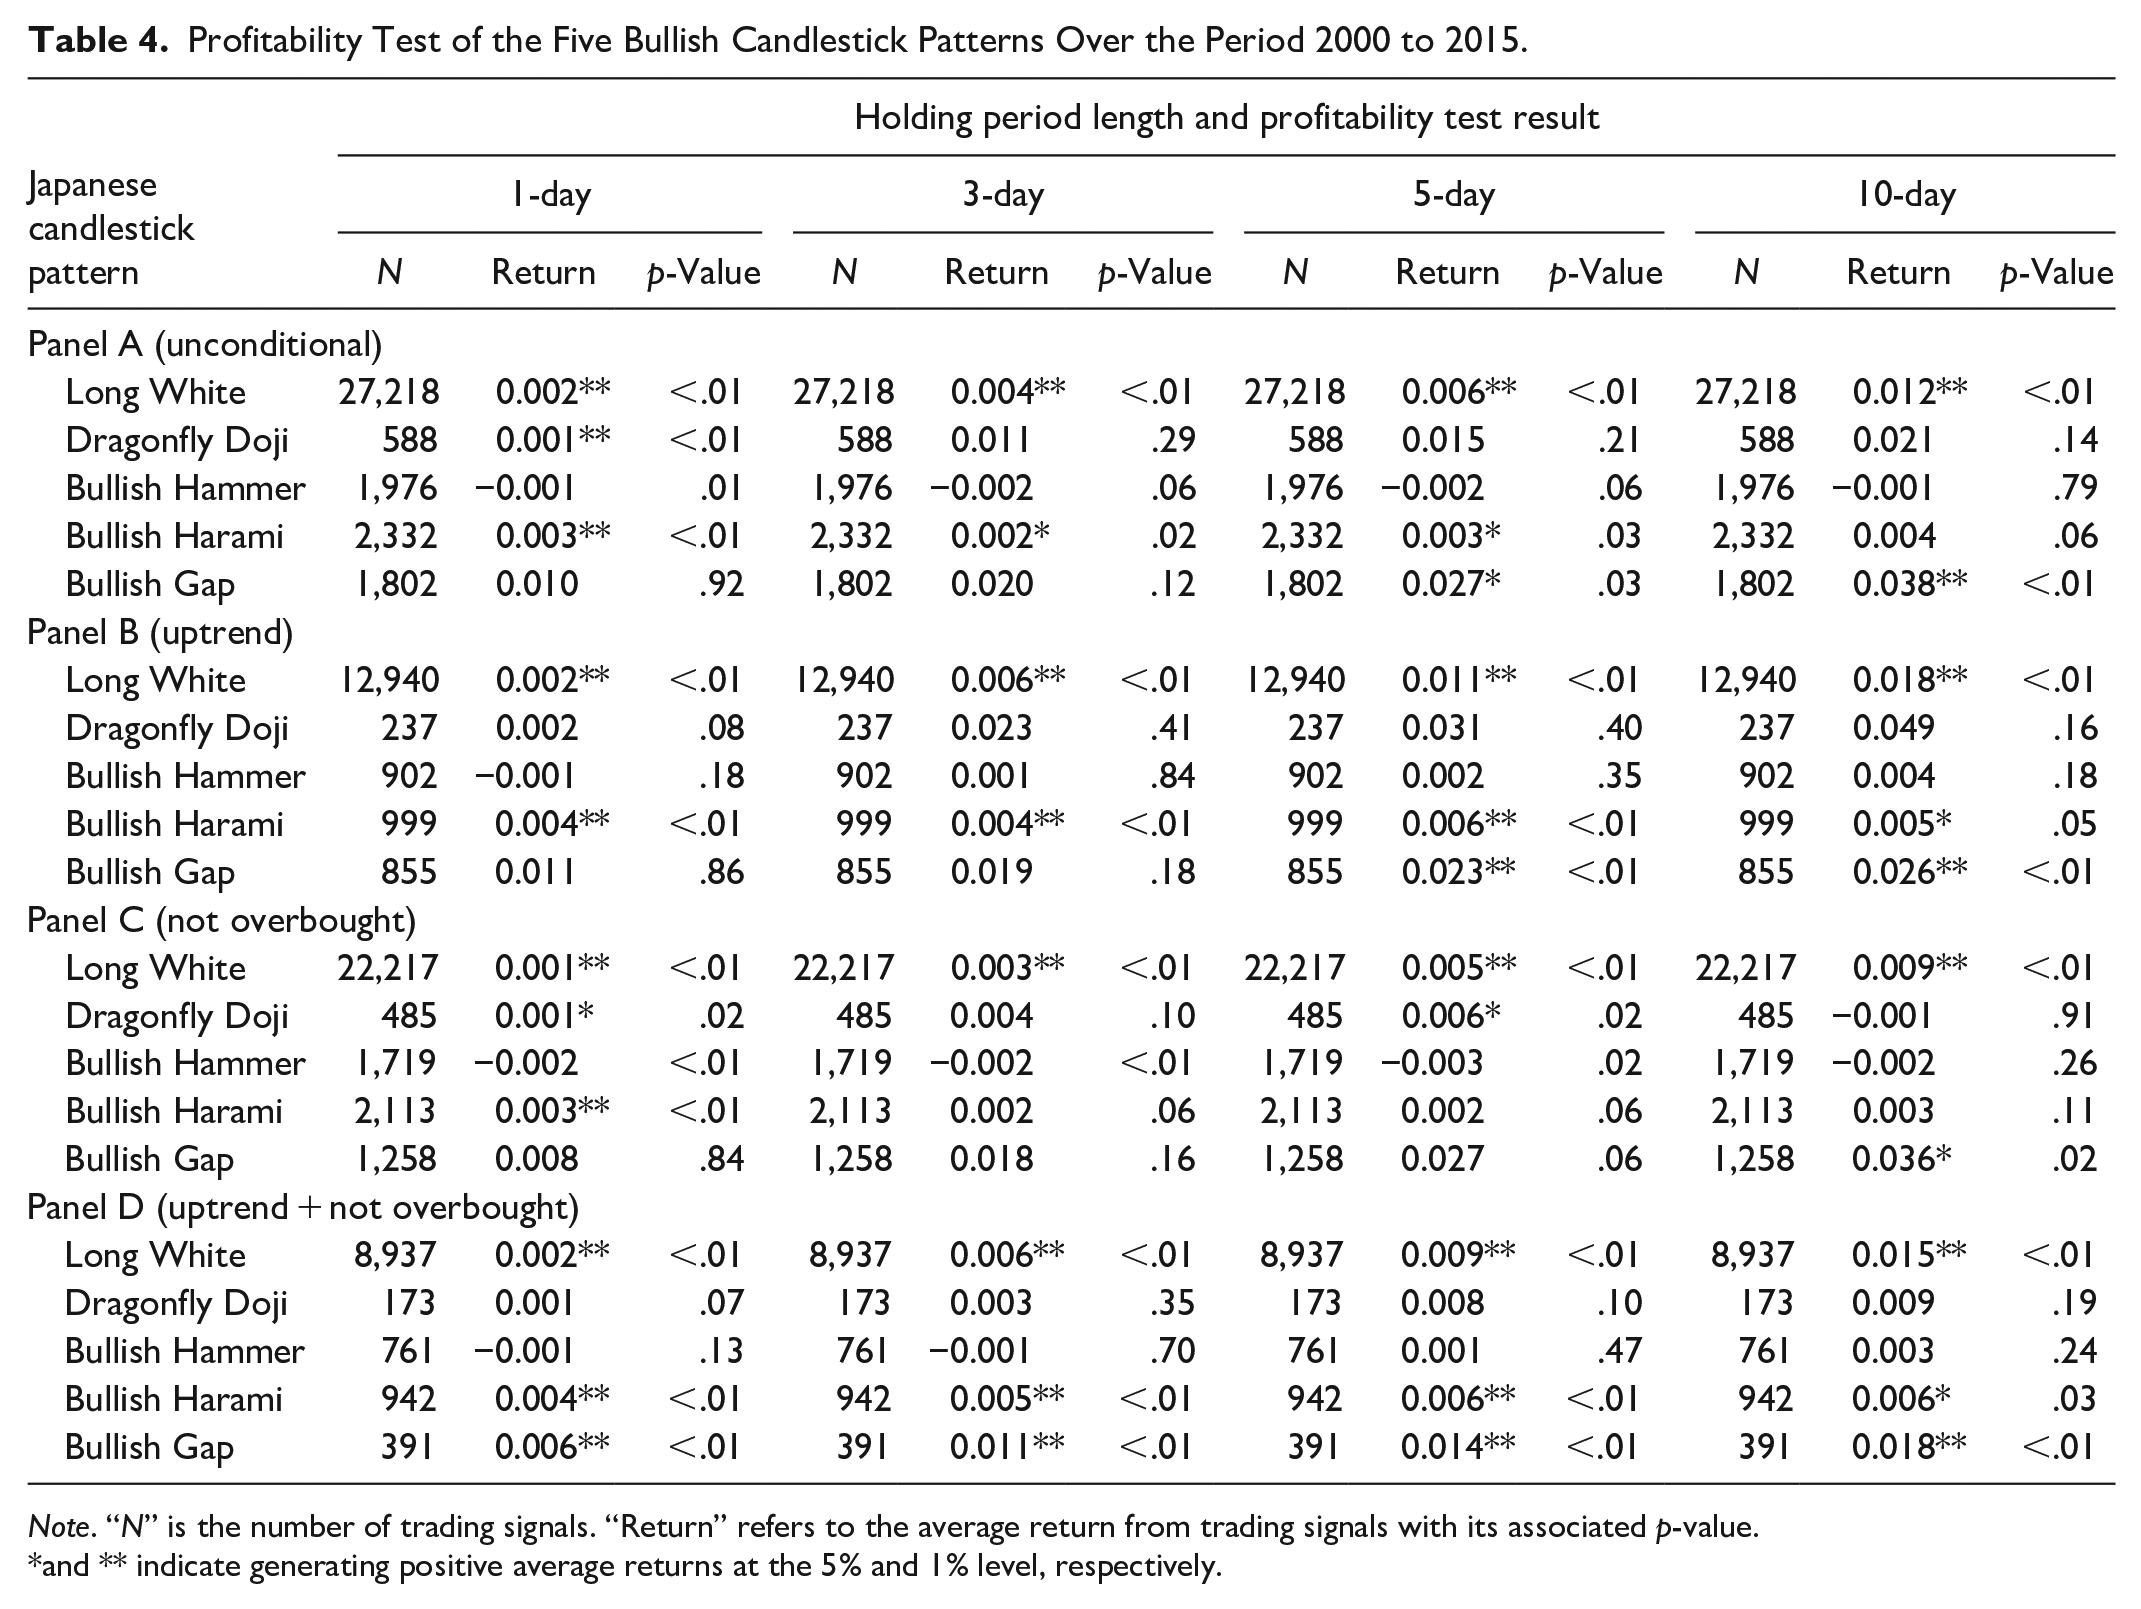
Note. “N” is the number of trading signals. “Return” refers to the average return from trading signals with its associated p-value.
and ** indicate generating positive average returns at the 5% and 1% level, respectively.
Profitability Test Results of the Five Bearish Candlestick Patterns Over the Period 2000 to 2015.

Note. “N” is the number of short-selling signals. “Return” refers to the average return from trading signals with its associated p-value.
and ** indicate generating positive average returns at the 5% and 1% level, respectively.
Returns of five bullish candlestick patterns without considering the uptrend and overbought conditions are presented in panel A of Table 4, from which we find that at the 5% level, Long White yielded positive average returns over all four holding periods, and Bullish Harami yielded positive average returns over the 1-, 3-, and 5-day holding periods. Bullish Gap produced positive average returns over the 5- and 10-day holding periods. Following the approach adopted in Caginalp and Laurent (1998), we then considered total transaction costs, including execution, liquidity, and slippage cost. Based upon our arbitrary assumption of a transaction cost of 1% per round trip, Bullish Gap (5- and 10-day periods) and Long White (10-day period) were found to yield positive returns and remain profitable even after deducting the transaction cost.
Panel B of Table 4 shows the profitability test results for applying the five bullish candlestick patterns in an uptrend condition. Compared with the results shown in panel A, in most cases for the candlestick patterns obtained positive average returns, after applying them in an uptrend, they were found to produce superior returns. In addition, after considering the uptrend condition, Bullish Harami (10-day holding period) yielded a positive average return at the 5% level, and Long White (5-day holding period) became profitable even after deducting the 1% transaction cost. These results reveal that the returns of those candlestick patterns were improved with considering the uptrend condition. For Bullish Gap, it was observed that its average return decreased from 2.7% to 2.3% over a 5-day holding period, and it decreased from 3.8% to 2.6% over a 10-day holding period, thus indicating Bullish Gap is more appropriate to be applied without considering the uptrend condition, while Long White and Bullish Harami patterns are suggested to be applied in the uptrend condition. Further, it also shows that for the profitable candlestick patterns Long White and Bullish Gap, when the holding period increased, their average returns also improved, thereby indicating that it would be better to hold the trading position for a relatively long period. While for Bullish Harami with a 5-day holding period, it produced the best return, demonstrating that it is suitable to apply it with about one week holding period.
Next, we applied these bullish candlestick patterns based signals with considering an overbought condition rather than in an up-trend condition. As reported in panel C of Table 4, after considering the overbought condition, all Long White (1-, 3-, 5-, and 10-day holding periods) remained to be profitable. While compared with the “Unconditional” trading signal group, all values of the average return decreased. In addition, Bullish Harami (3- and 5-day holding periods) became not profitable after considering the overbought condition. Dragonfly Doji with the 5-day holding period became profitable at the 5% level, while after taking into account the transaction cost of 1%, it was unable to generate positive average returns. The candlestick pattern Bullish Gap (10-day holding period) produced a positive average return significantly, and the average return value was larger than the transaction cost 1%. However, compared with the “unconditional” condition, the average return of Bullish Gap decreased from 3.8% to 3.6%, thus indicating that it was more appropriate to apply the Bullish Gap candlestick pattern without considering the overbought condition.
Then, we applied those five bullish candlestick patterns considering both the trend condition and overbought condition. From the results reported in panel D, it can be seen that the candlestick patterns yielded average returns over 1% (at the 5% level) were Bullish Gap (3-, 5-, and 10-day holding periods) and Long White (10-day holding period), thus demonstrating that buying signals generated by those candlestick patterns would on average produce positive returns. In addition, we also find that by considering both the uptrend trend and overbought conditions, Bullish Gap obtained a significant average return greater than 1% over a 3-day holding period. However, it produced a smaller average return over the 5- and 10-day holding periods than in the “unconditional” condition. Furthermore, we observe that all profitable candlestick patterns yielded superior returns than in the “unconditional” condition except Bullish Gap.
Finally, we focus on the best returns for each profitable candlestick pattern that yielded an average return greater than 1%. For Bullish Gap, the best trading signal was the “unconditional” condition over the 10-day holding period, in which it yielded an average return of about 3.8% before deducting the transaction cost. For Long White, it performed better in an uptrend condition with a 10-day holding period, which yielded an average return of about 1.88% before considering the transaction cost. These two trading signals were profitable on the transaction of the SSE50 component stocks. For Bullish Harami, it obtained the best average return of 0.6% (5- and 10-day holding periods) when considering both the uptrend condition and overbought condition. For Dragonfly Doji, it yielded the best return of 0.6% when considering the “not overbought” condition. However, none of these candlestick patterns was able to generate an average return greater than the total transaction cost assumed per round turn in this study. Therefore, it seems that these patterns cannot create value for trading on the component stocks of the SSE50 index.
Similar to the bullish candlestick patterns, we further examine the profitability of the five bearish candlestick patterns, and their results are reported in Table 5. The average return results without considering the downtrend or oversold condition are presented in panel A, from which we observe that under the “unconditional” condition over the 3-, 5-, and 10-day holding periods, none of their average returns was positive. Only Inverted Hammer, Bearish Harami, and Bearish Gap with the 1-day holding period produced positive returns. We then take into account the total transaction cost of 1% per round trip. Obviously, none of those candlestick patterns was found to create values for investors. This indicates that by using only those bearish candlestick patterns, none of them showed predictive power. Additionally, we find that over a 10-day holding period, for Gravestone Doji and Inverted Hammer which are generally regarded as the bearish candlestick patterns, they suffered losses of more than −1% at the 5% level, thereby indicating that although they are generally regarded as the bearish patterns to suggest short-selling signals, they could be used as contrary signals to generate bullish signals for executing long transactions.
Panel B of Table 5 reports the results for applying the Japanese candlestick patterns in a downtrend condition. Similar to the results of applying bearish candlesticks shown in panel A, none of these patterns was found to yield a significantly positive average return of more than 1%, thus indicating that although these candlestick patterns were applied with considering a downtrend condition, all of them remained no significant profitability. In addition, none of those candlestick patterns suffered an average loss of more than −1% at the 5% level, thereby demonstrating that there was no candlestick pattern that could be applied as a contrary indicator.
Next, panel C of Table 5 shows the profitability test results of candlestick patterns considering the “not oversold” condition instead of applying them in a downtrend condition. Over the 1-, 3-, 5-, and 10-day holding periods, none of these patterns was found to produce a significantly positive average return of more than 1%, thus indicating that even considering the “not oversold” condition when applying those bearish candlestick patterns. Still, none of those candlestick patterns offered predictive power, which is a finding similar to that of the research conducted by Tharavanij et al. (2017). They found that even with filtering by stochastic indicators, candlestick patterns are still not useful. However, it is found that Inverted Hammer over a 10-day holding period suffered a loss of more than −1% at the 5% level, therefore it reveals that although this candlestick pattern is generally regarded as a bearish signal, it could be used as a contrary signal for making a long transaction. We find it could be used to generate a buying signal to make profits even after deducting the transaction cost in the in-sample period.
Furthermore, from the results presented in panel D of Table 5, we find that by considering both the “downtrend” condition and “not oversold” condition, Bearish Harami pattern over a 5-day holding period produced a significantly positive average return. However, after deducting the 1% transaction cost, it became not profitable. It demonstrates that these bearish candlestick patterns could not make profits even though both the “not oversold” and “downtrend” conditions were satisfied. Additionally, from the results reported in panel D, none of these candlestick patterns suffered a loss of more than −1% at the 5% level. Therefore, none of these patterns could be used as a contrary signal for market investors.
Additionally, Figures 2 and 3 show how the length of the hold period impacts the profitability of Japanese candlestick patterns. In Figure 2, we observe that with the increase of holding days, the return rises in most of the bullish candlestick patterns. Several signals based on Hammer, Dragonfly Doji, and Harami are different from others, in which the largest or smallest return was produced by the middle-length holding period, such as Bullish Harami in panel A and Dragonfly Doji in panel C. On the contrary, the return falls with the increase of holding days in most bearish candlestick patterns. For several candlestick patterns, the average return fluctuates with the increase of holding days, such as Bearish Harami in panels B and D, and Inverted Hammer in panels B and D. Additionally, in some cases, the largest return is produced with the middle-length holding period, such as Gravestone Doji in panels A and C.

Average return results of the five bullish candlestick patterns over the period 2000 to 2015.
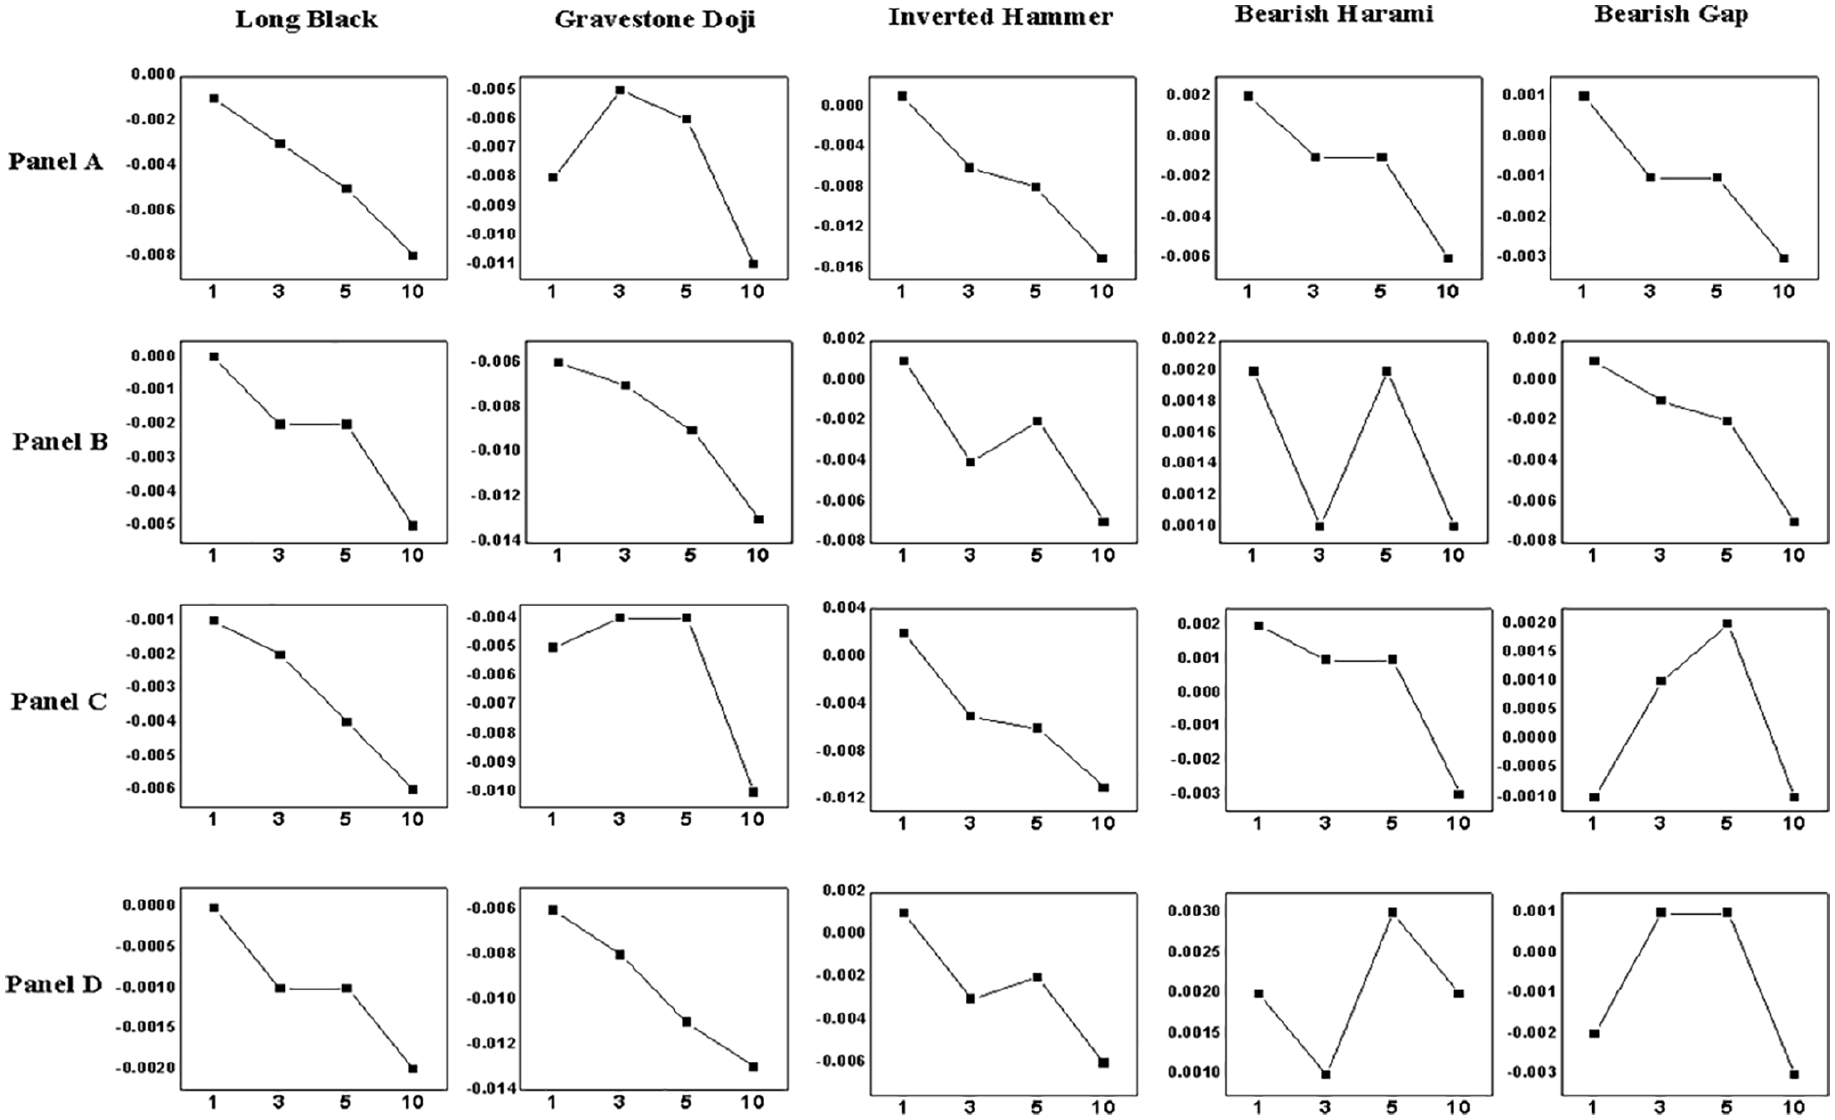
Average return results of the five bearish candlestick patterns over the period 2000 to 2015.
In summary, for those bearish candlestick patterns, average returns of all trading signals were insignificant with the exception of Bearish Harami with conditions in the “downtrend” and “not oversold” over a 5-day holding period, which yielded a significantly positive average return. However, we find evidence that Gravestone Doji and Inverted Hammer over a 10-day holding period and under the “unconditional” condition, as well as the Inverted Hammer over a 10-day holding period and under the “not oversold” condition, could create values for investors with regarding those bearish candlestick patterns as buying signals.
Bootstrap Analysis
To examine the robustness of profitability test results, we then employed the bootstrap method (Marshall et al., 2006) to address the common features of stock return data, such as autocorrelation, skewness, and leptokurtosis. Subsequently, a new dataset was generated while the characteristics of the original dataset for the SSE50 index component stocks were retained. We simulated 500 sets of open, high, low, and close price series, comparing the profits accrued from the actual data and the random series to identify whether the profitability of those candlestick pattern is statistically significant.
The bootstrap p-value is the percentage of simulated average returns that are greater than the actual average returns. Note that we only report returns of the candlestick patterns yielded significant average returns that over 1%. Among the candlestick patterns, 12 were found to generate significant average returns greater than 1% on the component stocks of the SSE50 index.
The “Return” column in Table 6 denotes the average return rates generated by each candlestick pattern on the bootstrapped and original series. As shown in panels A, B, C, and D, when transaction costs were taken into consideration, those candlestick patterns were not found to be profitable on the random bootstrap series. In all cases, the average returns on the original series were found to be greater than those on the bootstrap series, particularly for Bullish Gap under the “unconditional” condition over the 5- and 10-day holding periods, Bullish Gap under a trend condition over the 5- and 10-day holding periods, as well as Bullish Gap considering the overbought condition over the 10-day holding period. Our bootstrap results thus provide valuable evidence on the profitability of candlestick patterns.
The Bootstrapped Simulation Results for the Profitable Candlestick Patterns and Holding Periods.

Note. The “Number” columns refer to the number of patterns in the bootstrapped and original series. “p-value count” columns refer to the number of stocks for which the average return is larger on the original series than the 500 bootstrapped series; “Return” columns are the average return rates generated by each candlestick pattern on the bootstrapped series and original series.
Robustness Test
Despite the evidence provided on the profitability of technical analysis, Park and Irwin (2007) pointed out the importance of addressing the out-of-sample problem. Therefore, to examine the out-of-sample performance, a two-step procedure which is similar to the method proposed by Jensen (1967) is conducted, first selecting the best-performing candlestick patterns and then using these on new (i.e., out-of-sample) data. Based on it, we conduct an out-of-sample test on the data by selecting the profitable candlestick patterns and contrary candlestick patterns (with considering the transaction cost) in the in-sample period, and to investigate whether or not those successful candlestick patterns could remain their predictive power in the following out-of-sample period.
The return results of the profitable and contrary candlestick patterns in the sub-period 1 and sub-period 2 are reported in Table 7, in which we find that both datasets appeared to be consistent in most cases, thereby providing support for the conclusion that most of the profitable candlestick patterns have significant explanatory power for the component stocks of the SSE50 index. In addition, the bearish candlestick pattern Gravestone Doji (“unconditional” condition with the 10-day holding period) generated a negative average return lower than −1%, showing significant evidence that it could be used as a contrary indicator to generate a profitable buying signal. Inverted Hammer under the “unconditional” condition with the 10-day holding period produced a significantly negative average return, whereas the profit by using it as a contrary indicator was still unable to cover the transaction cost 1%. For Bullish Gap with considering the trend condition and not-overbought condition, we can observe that none of the trading signals created a significant average return over 1%.
The In-Sample (2000-Jan-4th to 2014-Dec-31st) and Out-of-Sample (2015-Jan-5th to 2018-Dec-28th) Profitability Results of the Best-Performing Japanese Candlestick Patterns.

Note. “N” is the number of trading signal for each candlestick pattern. “Return” refers to the average return from trading signals with its associated p-value.
and ** indicate generating positive average returns at the 5% and 1% level, respectively.
Simulation Trading Results
Except for the profitability test of candlestick patterns, we also designed the candlestick pattern based trading strategies in the experiments, and simulation trading was adopted to evaluate their trading performance. We introduced trading position management and transaction cost in our model. By designing the candlestick pattern based trading strategy, it is possible to calculate the profit per year of each candlestick pattern, and its trading performance can be evaluated and compared with other benchmarks. In the experiments, we adopted a “separation strategy” in position design, which means that we distribute the full position for each holding days averagely, and the daily position for each stock that appears the trading signal is also distributed averagely. By using this portfolio management, we can ensure that every satisfied stock could be traded by the designed candlestick pattern based trading strategy. For instance, if we adopt the 3-day holding period and there is a bullish candlestick signal appears in three stocks at the same date D, we will distribute 1/9 long position to each stock at date D + 1. Subsequently, the simulation trading return of each year is calculated for each candlestick pattern based trading strategy. Using the annual returns, it is possible to calculate the Sharpe ratio of each trading strategy, and the 1-year Yield of China’s treasury bond is adopted as the risk-free rate. Additionally, the buy-and-hold strategy and sell-and-hold strategy, which are two famous benchmarks, are used for comparing with the bullish and bearish candlestick based trading strategies.
The trading simulation results on the component stocks of the SSE50 index are shown in Tables 8 and 9. Compared with the previous results, all the trading strategies of Bullish Gap and Long White with 5- or 10-day holding periods could earn positive profits for investors. Since the Sharp ratio for sell-and-hold was negative, the trading results were compared with the buy-and-hold strategy. Considering the buy-and-hold strategy’s Sharpe ratio was 0.291, for Bullish Gap, most trading strategies based on it performed better than the benchmark except panel D. Possible reason could be that the frequency of transaction was too low for the condition of panel D, thus it might miss the trading chances to produce considerable profits. For Long White based trading strategy, only the 10-day holding length in panels A and B, as well as the 5-day holding length in panel B, performed better than the buy-and-hold. Some trading strategies produced positive annual returns, but they did not perform better than the buy-and-hold in terms of annual average return or Sharpe ratio. Additionally, for the bearish candlestick pattern based trading strategies, none of them could perform better than the buy-and-hold in terms of both average annual return and Sharpe ratio.
Trading Simulation Results of the Five Bullish Candlestick Pattern Based Trading Strategies Over the period 2000 to 2018 Using the Component Stocks of the SSE50 Index.

Note. “SR” refers to the Sharpe ratio of each candlestick pattern based trading strategy. “AR” refers to the average annual return. “SD” refers to the standard deviation of the annual returns.
Trading Simulation Results of the Five Bearish Candlestick Pattern Based Trading Strategies Over the Period 2000 to 2018 Using the Component Stocks of the SSE50 Index.

Note. “SR” refers to the Sharpe ratio of each candlestick pattern based trading strategy. “AR” refers to the average annual return. “SD” refers to the standard deviation of the annual returns.
Our further research used all the listed company data in the Chinese stock market. The results are shown in Tables 10 and 11, from which it is found that all Bullish Gap based trading strategies generated positive returns, and most of them performed better than buy-and-hold, which produced an average return of 11.22% and a Sharpe ratio value of 0.183. Unlike the previous results, Long White based trading strategy failed to perform better than the benchmark in terms of Sharpe ratio. Similar results as the trading simulation test on the SSE50 datasets, several Bullish Harami based trading strategies could yield positive returns, while they could not perform better than the benchmark. Among the bearish candlestick patterns, Bearish Gap based trading strategies performed better than the buy-and-hold strategy in terms of Sharpe ratio.
Trading Simulation Results of the Five Bullish Candlestick Patterns Based Trading Strategies Over the Period 2000 to 2018 Using All Stocks Data.

Note. “SR” refers to the Sharpe ratio of each candlestick based trading strategy. “AR” refers to the average annual return. “SD” refers to the standard deviation of the annual returns.
Trading Simulation Results of the Five Bearish Candlestick Pattern Based Trading Strategies Over the Period 2000 to 2018 Using All Stocks Data.

Note. “SR” refers to the Sharpe ratio of each candlestick pattern based trading strategy. “AR” refers to the average annual return. “SD” refers to the standard deviation of the annual returns.
Conclusion
Traditional research has done little to examine the effectiveness of Japanese candlestick patterns to the component stocks of the Chinese SSE 50 index when taking into consideration the overbought/oversold condition. In this study, we aimed to fill this gap, and comprehensive analysis has been conducted on the component stocks of the SSE 50 index to investigate the predictive power of 10 well-known Japanese candlestick patterns. For the experiments, daily-based data on the component stocks of the SSE50 index that covers the period from 2000 to 2018 was employed. In addition, to avoid data mining, we divided the whole dataset period into two sub-periods, in which the out-of-sample period was further examined to confirm the robustness of the results that whether or not the successful candlestick patterns in the in-sample period could remain their predictability in the out-of-sample period.
Our primary analysis results from the in-sample period revealed that certain bullish patterns were found to produce positive and significant average returns on the component stocks of the SSE50 index. The out-of-sample experimental results of the robustness test demonstrated that signals generated by Bullish Gap over a 10-day holding period under all four conditions were proved to be profitable for investors. Additionally, experimental results indicated that the typical use of the bearish patterns investigated in this research was not profitable on the component stocks of the SSE50 index over the studied period. Further, based upon a bootstrap analysis, the robustness of the experiment results was subsequently confirmed. Finally, we designed the candlestick pattern based trading strategies and examined their profitability on the component stocks of the SSE50 index, as well as all stocks in the Chinese stock market. Experimental results showed that most Bullish/Bearish Gap based trading strategies, as well as several Long White based trading strategies, not only generated positive average annual return but also performed better than the benchmark in terms of Sharpe ratio.
Overall, our results suggest that several candlestick patterns and candlestick pattern based trading strategies, particularly Bullish Gap and Long White patterns with 5- or 10-day holding periods, can create values for investors trading on the component stocks of the SSE50 index. Therefore, experimental results demonstrated that several candlestick pattern based trading strategies had significant predictive power, whereas investors need to consider different market conditions when employing those Japanese candlestick patterns. Future studies could test their profitability on the medium-market-value or small-market-value stocks in the Chinese stock market, or examine their profitability in other financial markets such as FX or commodity markets. Moreover, this research studied the profitability of candlestick patterns by using daily data, while other researchers could investigate the high-frequency financial time series data such as 2-hour, 1-hour, or 30-minutes in the future.
Footnotes
Appendix
A List of the Component Stocks for the SSE 50 Index.

| No | Company name | No | Company name |
|---|---|---|---|
| 1 | Shanghai Pudong Development Bank | 2 | China Minsheng Banking Corporation |
| 3 | Baoshan Iron & Steel | 4 | PetroChina Company |
| 5 | China Southern Airlines Company | 6 | Citic Securities Company |
| 7 | China Merchants Bank | 8 | Poly Developments and Holdings Group |
| 9 | China United Network Communications | 10 | SAIC Motor Corporation |
| 11 | Shanghai Fosun Pharmaceutical (Group) | 12 | Jiangsu Hengrui Medicine |
| 13 | Wanhua Chemical Group | 14 | China Fortune Land Development |
| 15 | Kweichow Moutai | 16 | Shandong Gold Mining |
| 17 | Anhui Conch Cement Company | 18 | Greenland Holdings Corporation |
| 19 | Haier Smart Home | 20 | Sanan Optoelectronics |
| 21 | Inner Mongolia Yili Industrial Group | 22 | Daqin Railway |
| 23 | Industrial Bank | 24 | Ping an Insurance (Group) |
| 25 | China Life Insurance Company | 26 | China Shenhua Energy Company |
| 27 | Bank of Beijing | 28 | China Railway Construction Corporation |
| 29 | Guotai Junan Securities | 30 | Agricultural Bank of China Limited |
| 31 | Bank of Communications | 32 | New China Life Insurance Company |
| 33 | 360 Security Technology Inc. | 34 | China Railway Group |
| 35 | Industrial and Commercial Bank of China | 36 | China Pacific Insurance (Group) |
| 37 | China State Construction Engineering Corporation | 38 | Huatai Securities |
| 39 | CRRC Corporation Limited | 40 | China Communications Construction |
| 41 | China Everbright Bank Company | 42 | PetroChina Company |
| 43 | China Tourism Group Duty Free Corporation | 44 | China Construction Bank |
| 45 | Bank of China | 46 | China Shipbuilding Industry Company |
| 47 | China Molybdenum | 48 | Foxconn Industrial Internet |
| 49 | Bank of Shanghai | 50 | WuXi Application Technology |
Acknowledgements
We thank the editors and anonymous referees for their insightful comments. All errors and omissions are our responsibility. Additionally, the scientific calculations in this paper have been done on the HPC Cloud Platform of Shandong University.
Data Availability Statement
Declaration of Conflicting Interests
The author(s) declared no potential conflicts of interest with respect to the research, authorship, and/or publication of this article.
Funding
The author(s) disclosed receipt of the following financial support for the research, authorship, and/or publication of this article: This work was supported by the Natural Science Foundation of Hubei Province [Grant Number 2021CFB175]; National Social Science Foundation of China [Grant Number 19BGL131]; and Innovation and Entrepreneurship Programs of China Three Gorges University [Grant Numbers S202111075045 and S202111075066X]. In addition, we are grateful to the editors and anonymous reviewers for their comments and discussions.