
Abstract
The primary objective of this study is to examine stock market manipulations, particularly pump-and-dump schemes, in South Asian emerging markets (India, Pakistan, and Bangladesh). This study makes a novel contribution by investigating the performance of the contrarian investment strategy during the crash periods of pump-and-dump manipulations. Using Supremum Augmented Dickey-Fuller (SADF) and Generalized Supremum Augmented Dickey-Fuller (GSADF) tests, the analysis identifies the occurrence and duration of these manipulations, confirming that they induce artificial price surges followed by sharp crashes. A key finding reveals that the contrarian investment approach, which involves betting against prevailing market trends, consistently generates superior returns during crash phases. Furthermore, the study demonstrates that the profitability of contrarian strategies is influenced by short-term return reversals of winning portfolios during market crashes, providing a profitable opportunity for investors under manipulating conditions. These findings are critical for investors and regulators, highlighting the risks of uninformed trading amidst manipulations and suggesting protective investment strategies.
Introduction
The relationship between stock market manipulation, investor behavior, and market efficiency has been intensely debated among scholars and market practitioners. A well-functioning stock market relies on the dissemination of reliable and valid information. However, persistent concerns arise regarding manipulating stock prices through unethical trading practices, often distorting market signals and undermining investor trust. Stock market manipulation is a significant challenge to trading regulations and efficiency, particularly in emerging markets (Caraiani & Călin, 2024). Early theoretical works, such as those by Allen and Gale (1992), framed manipulative tactics like “pump-and-dump” schemes. In these schemes, manipulators artificially inflate stock prices before offloading them to uninformed investors, causing prices to plummet and undermining market integrity. The central question is whether efficient markets, as described by Fama’s (1970) Efficient Market Hypothesis (EMH), can prevent or mitigate such manipulative behavior.
According to the EMH, stock prices fully reflect all available information, making it impossible for investors to achieve abnormal profits. However, critics argue that manipulation thrives in markets characterized by information asymmetry and weak regulatory oversight (Bharti et al., 2025; Cervellati et al., 2024). In these situations, informed investors have access to privileged information, whereas ignorant retail investors are more susceptible to deceptive, manipulative tactics. The information asymmetry theory suggests that the disparity between informed and uninformed investors creates fertile ground for price manipulation, particularly in emerging markets with lower transparency and investor protection (Boos & Grob, 2023; Irani et al., 2025). This dynamic makes emerging markets such as those in South Asia (India, Pakistan, Bangladesh) more susceptible to manipulative bubbles.
Recent empirical studies have provided divergent perspectives on the mechanisms of market manipulation. While some researchers emphasize the role of regulatory frameworks and transparency in mitigating manipulations (Boos & Grob, 2023), others highlight the persistence of manipulation in emerging markets, particularly in South Asia, due to structural weaknesses and a lack of investor protection (Alaminos et al., 2024). Another school of thought posits that information asymmetry among various investors leads to stock price manipulation. For example, Hackethal et al. (2019) argue that uninformed traders are mostly retail investors who consider high trading volumes and increasing price indicators of higher future earnings and thus fall prey to manipulations. The theoretical literature asserts that profitable trade-induced manipulations are not possible in inefficient stock markets because the participants in efficient markets know the true nature of manipulated stocks (Chowdhury et al., 2024). In that case, if the manipulators attempt to manipulate the stock market through excessive buying, an equal number of informed investors would be ready to sell or even short sell the stocks; thus, manipulators will bear loss through their manipulative tactics.
The motivation for this study stems from the persistent vulnerability of South Asian emerging markets to stock market manipulations, particularly pump-and-dump schemes, which undermine market efficiency and investor confidence (Azad et al., 2014; Bharti et al., 2025). These issues are compounded by structural factors, including regulatory failures, information asymmetry, and the unusual characteristics of raw and naive retail investors (Jareño et al., 2025). Because of these structural concerns, speculation and market anomalies are very common in these markets (Boos & Grob, 2023; Huang & Cheng, 2015). Besides the never-ending debate on the efficiency and manipulation of these stock markets, it is also possible to find a debate on trend trading techniques such as momentum and contrarian trading. Momentum strategy means that a good asset will be good, which means it will perform well in the future. On the other hand, a contrarian strategy supposes that if an asset has given good results in the past, the results will be lower. Grinblatt and Moskowitz (2004) posit that momentum is not profitable in emerging markets because misleading investors can easily game it. However, a contrarian approach has been postulated to be a more feasible approach that can yield even higher returns on investment in the likely manipulated markets (Woo et al., 2020).
Based on the above discussion, this study evaluates the efficiency of contrarian investment approaches during the crash phases of manipulations to assist investors in averting manipulative bubbles in South Asian emerging markets. Initially, the study uses econometric techniques such as Supremum Augmented Dickey-Fuller (SADF) and Generalized SADF (GSADF) to detect multiple bubbles. The study then validates the existence of pump-and-dump schemes and other market manipulations from published sources of sample emerging markets. The paper first documents the frequency and length of manipulative activities in the stock market and then explores the effectiveness of the contrarian investment strategy during the manipulation crashes. The current literature also points to the fact that contrarian strategies may be a rational strategy for making profits in inefficient and manipulative markets even though it is associated with market risk and the discovery of new manipulation strategies (Economou et al., 2023; Hackethal et al., 2019; Thanh et al., 2024).
The empirical analysis of the current study supports the existence of multiple bubbles and pump-and-dump manipulations in India, Bangladesh, and Pakistan’s stock markets through SADF and GSADF tests. The study finds that such manipulative actions, most notably pump-and-dump schemes, skew the stock price and cause problems for naive investors during a crash. The research also shows that contrarian investment strategies, whereby investors go against the market trend by investing in stocks that are being dumped, are also efficient during the dumping phases of these manipulations. The contrarian strategy offered higher absolute returns, and when reversing the winning portfolios after the crash periods, it demonstrated the strategy’s effectiveness in taking advantage of short-term inefficiencies. Furthermore, the panel regression analysis conducted in the study also corroborates the findings, suggesting that unsheltered investors can still employ contrarian strategies to exploit these manipulative settings, which would be helpful to the investment community and policymakers.
This research fills a gap in the literature on stock market manipulation in South Asian emerging markets by using sophisticated econometric methods to identify bubble-like patterns and examine the efficiency of contrarian investments. Unlike the prior research that mainly concentrated on general regulation or the momentum approach, this paper addresses the question of trade-related manipulations and how they can affect naive investors. Instead of mere detection of multiple bubbles, the supremum augmented Dickey-Fuller (SADF) and generalized SADF (GSADF) tests used in this study also identify the lengths of the bubbles, thus providing a new way of measuring market inefficiency. In addition, it offers valuable suggestions for unsheltered investors and fund managers, exposing that a countercyclical approach to manipulative practice generates superior market returns during market downturns. This research contributes to existing literature by answering questions like how manipulation distorts the efficiency of emerging markets and how unsheltered retail investors can survive under the weak governing environment of these markets. The study findings imply that investor protection in manipulative environments requires regulatory reforms to strengthen market integrity. Furthermore, the study provides practical implications of the identified investment strategies and empirical findings for investors and policymakers.
The rest of this paper is organized as follows. The Literature Review and Hypotheses Development section discusses the relevant theoretical background and reviews previous studies, leading to the development of the research hypotheses. The Research Design section provides data and methods for investigating the manipulation of the stock market and for analyzing the profitability of the contrarian investment strategy. The Empirical Results and Discussion section reports the main findings, discussion, and robustness tests. Finally, the Conclusion, Implications, and Sugesstions for Future Research section summarizes the study's key insights and offers practical implications as well as directions for future research.
Literature Review and Hypotheses Development
Market manipulation is an unlawful action that intends to increase or decrease stock prices through artificial trading (Caraiani & Călin, 2024; Hackethal et al., 2019). According to Allen and Gale (1992), stock price manipulations can be divided into three categories: Action-based, Information-based, and Trade-based. Action-based manipulation is where the intentional action of any party in the stock market influences stock value. Information-based manipulation refers to the spread of rumors or fake information that influences stock prices. Finally, trade-induced or trade-based manipulation, which is even more challenging to identify, is the manipulation of stock prices through activity that is created solely for such a purpose by stock market intermediaries. This type of manipulation is also called “pump-and-dump” schemes that are mainly prevalent in emerging stock markets. Zulkifley et al. (2023) argue that market manipulation has several dimensions, including trading activity, trading volume, order size, and magnitude of stock price fraction
Stock market manipulation is an obvious concern for market efficiency theory and trading regulations (Economou et al., 2023). Pump-and-dump tactics destroy the faith of investors who purchase shares on a misguided belief that some market innovation is causing an increase in prices (Bharti et al., 2025; Durston & McKeon, 2020). This loss of faith further influences the stock market credibility in the form of mistrusting information about remaining stocks (Cervellati et al., 2024). Securities regulators generally restrict market manipulation because such actions obstruct discovery, distort prices, and create substantial losses. These factors hinder the effective allocation of resources entirely, which, in turn, contributes to low market quality and inefficiency (Huang & Cheng, 2015; Thanh et al., 2024). Several empirical and theoretical studies have shown that inefficient capital markets offer opportunities for stock market manipulation due to information asymmetry among investors. Quang (2024) investigated the role of insider trading behavior before and after information releases, focusing on information-based stock price manipulation and manipulating companies using a logit approach. They found no evidence of insider trading or negative information-based manipulation in firms with high or low transparency. However, BOD and family members exploit positive information by buying shares before positive news, causing a sharp 5% price increase. Anelli and Patanè (2023) tested the challenged EMH by quoting “Boom-bust” as empirical proof against the EMH by emphasizing psychological and behavioral factors influencing stock prices in Taiwan. They found that during market exuberance or panic periods, psychological biases cause “gaslighting effects.” Outside these extreme episodes, market prices generally reflect fundamental values efficiently. Bashir et al. (2024) examined the impact of investor sentiment on stock price crash risk using data from Chinese A-Share firms. It explores the relationship between crash risk and investor sentiment, introducing analyst herding as a mediating factor. Analyzing 19,371 firm-year observations from 2004 to 2019, the study constructs an investor sentiment index and finds a significant positive relationship between investor sentiment and stock price crash risk. Analyst herding also positively correlates with crash risk, mediating the relationship between sentiment and crash risk. Zulkifley et al. (2023) demonstrated that stock market manipulation is a real issue that negatively affects the market. Due to the complexity of manipulation and the vast trading volumes, manual detection is nearly impossible. Their review paper offers various automated methods for quantifying market manipulation, including taxonomy and classification of different manipulation types.
Although many studies in the literature examine the role of disclosure and securities regulation in fostering market quality and capital market information (Rashid & Sabir Jaf, 2023), some basic questions regarding the investor's protection from market manipulations have yet to be explored in the literature (Caraiani & Călin, 2024; Hackethal et al., 2019). For instance, what measures or trading strategies can investors adopt to survive under the weak governing and manipulative environment? How do we design portfolios of individual investors that are less prone to damage caused by market manipulation?
To answer these questions, the current study investigates a suitable investment strategy that investors may choose in manipulative settings. The existing literature narrates that the cycles associated with capital market bursts and crises are deemed poor for the profitability of conventional return-based momentum strategies (Dagsland & Strandkås, 2023; Maddodi & Kunte, 2024). The higher degree of uncertainty is linked to the predictability of momentum returns during stock-market crashes. In contrast, returns can be forecasted with moderate uncertainty during a fundamental, political, or economic crisis (Jareño et al., 2025; Maddodi & Kunte, 2024). Furthermore, Dagsland and Strandkås (2023) argue that the uncertainty and return predictability of momentum strategies are higher during periods of stock market bubbles than in market crashes and normal conditions. Based on these findings in the recent literature regarding the failure of momentum investment strategy during the crash periods, the current study expects that contrarian strategy can generate superior abnormal returns during the dump or crash periods of pump-and-dump manipulations.
The existing literature illustrates that the effectiveness of conventional return-based momentum strategies is poor during the fundamental, political, or economic crisis. Momentum investing is a strategy that capitalizes on continuing existing market trends. It suggests taking a long position in stocks that show an upward pricing trend and shortening the assets with a downward pricing trend. The higher degree of uncertainty is linked to the predictability of momentum returns during stock-market crashes. For example, the market crashes of 1932 and 2009 were the worst periods for momentum profitability in the U.S. stock market history (Asness et al., 2015). Additionally, momentum strategies usually show weak or insignificant returns in the South Asian markets during a manipulative environment as it has been argued that uninformed retail investors suffer huge losses because of stock price manipulation (Azad et al., 2014; Munir, Sukor, et al., 2022; Singh et al., 2024). Li and Galvani (2021) stated that momentum traders in emerging markets lack timely access to key information, making them vulnerable to manipulative activities. Khwaja and Mian (2005) point out that market inefficiencies, particularly in emerging nations, allow manipulators to benefit at the cost of individual investors. Azad et al. (2014) argue that individuals easily abuse momentum strategies to manipulate stock prices in these situations. Munir, Shaharuddin, et al. (2022), and Khan (2024) demonstrate how ordinary investors frequently incur considerable losses when they carelessly follow manipulated pricing patterns, resulting in poor investment results. In the context of these findings in the recent literature regarding the failure of momentum investment strategy during the crash and manipulative periods (Khan, 2024; Maddodi & Kunte, 2024), this study expects that contrarian strategy can generate superior abnormal returns during the dump or crash periods of pump-and-dump manipulations. Therefore, this study forms the following hypotheses:
Research Design
Data
The study obtained the main data from Thomson and Reuters Datastream and the official websites of BSE, DSE, and PSX. The dataset consists of the closing prices of all the listed stocks. For bubble identification, the data relating to dividend yield and prices of market indices are also gathered from Thomson and Reuters Datastream. The sample period ranges from 1997 to 2018. The study analyzes various sub-sample periods for different manipulation incidents described in Section 3. To correctly detect and quantify trade-induced manipulations’ pump and dump periods, this study first applies SADF and GSADF bubble detection techniques suggested by Phillips et al. (2011) and Phillips et al. (2015). The study then cross-checks the periods of manipulations with each country's national newspapers and the Securities and Exchange Commission (SEC). Monthly stock returns data are used to form winner, loser, and contrarian portfolios during the formation period and subsequent holding periods to evaluate the contrarian strategies’ returns during dumping periods of manipulations. The monthly log return series of all the selected stocks and market indices are computed as follows:

Where,
Rt = represents the profit of an equity or index at time t
Pt = the dividend-adjusted close price of an equity or index at time t
Pt -1 = the dividend-adjusted close price of an equity or index at time t−1
Methodology
Rational Bubbles in Asset Pricing
This section presents the formal asset pricing model with a rational bubble. Following Campbell et al. (1997) and Cunado et al. (2005), the base model comprises the net returns of an asset described as follows:

Here,

Here,
While,

The log-linear estimation of log price to dividend ratio in Equation 2 can be further solved by taking expectations with forward iteration in the following manner:

We can decompose the right-hand side of Equation 4 into the following two components:

Where

And

is commonly known as bubble component of the price of an asset, which is the focus of interest in the subsequent section for bubble detection process.
According to Diba and Grossman (1988), the rational bubble is the deviation of a stock’s price from its intrinsic or fundamental value that leads to a useless variable. If the non-stationarity of dividends can be explained through the non-stationarity of asset prices, then there will be a cointegrated connection between asset prices and dividends. This cointegration relationship between asset prices and dividends can investigate the hypothesis of no bubbles. A cointegration between dividends and asset prices denies the existence of a bubble. In other words, the stationarity in the dividend-price ratio contains the same meaning.
Testing for Overall Stock Market Bubbles and Identification of Manipulative Bubbles
To identify multiple periods of stock market bubbles, this study uses SADF and GSADF tests. These are the most recent econometric tests for the bubble detection process suggested by Phillips et al. (2011, 2015). The most noteworthy advantage of applying these tests is that they detect the stock market bubbles through recursive and rolling ADF approaches and date-stamp the occurrence of these bubbles.
More specifically, the empirical model that considers the autoregressive explanation and measured with recursive least squares can be written as:

Where zt represents the variable in question (e.g., market index prices), μ is the intercept, p represents the maximum lag length, θi for i = 1 ……p is the lag differenced coefficient, and ε t represents error term. Using a unit root in the series of assets as the null hypothesis, these tests employ a right-tailed form of the ADF technique, while the alternative hypothesis states that there is a moderately explosive procedure. The current study formally tests the following hypotheses:


Phillips et al. (2011) correctly detected all the exploding bubbles in the NASDAQ stock exchange during the 1990s using the SADF approach. According to Homm and Breitung (2012), ADF’s right-tailed unit root tests are more effective in spotting numerous bubbles than traditional econometric tests. Furthermore, the GSADF approach employs an identical econometric detection procedure; however, according to the authors, the rotating window methodology of GSADF is more efficient than the successive date-stamping methodology of SADF. The SADF approach applies recursive computations of the ADF test statistic with the fixed beginning point and variable window breadth. For instance, if r1 represents the test’s initial beginning point and r2 is its final point, then rw = r2−r1 denotes the regression window’s length. The SADF approach needs repetitive values on a sample sequence extending forward, but the beginning point remains constant at r0. On the other hand, the ending point (r2) expands freely from points r0 to r1. The test statistic of the SADF measure can be written in the following manner:

Where,

GSADF test applies more flexible windows lengths, contrasting to SADF mechanism, the initial beginning point of r1 also changes within the limit of r1 and r2. Owing to the modified range of subsamples in the dataset, the GSADF approach is considered more effective in identifying multiple asset price bubbles than the simple SADF approach. The GSADF test statistic is formally written as:

Where

Both SADF and GSADF approaches employ the ratio of price-dividend to measure the asset price bubbles (Phillips et al., 2015). To compute the ratio of price-dividend, the current study collects data relating to monthly closing prices and dividend yield of all the market indices in our sample countries from Thomson Reuters Datastream.
To correctly detect the periods of stock brokers’ manipulations, this study first confirmed the periods from date-stamping (the originating and ending period of a bubble) procedures through SADF and GSADF tests. Then, it cross-checked the manipulation incidents from various published sources and the Securities and Exchange Commission (SEC) of each country. After identifying the multiple phases of market manipulation, this study examined the contrarian effect during the dumping or crash phases of pump-and-dump manipulations.
Evaluation of Contrarian Returns Under the Dumping (crash) Phases of Trade-induced Manipulations
The final section of this study examined the contrarian effect (loser minus winner portfolio returns) during the dumping or crash phases of trade-induced (pump-and-dump) manipulations. To achieve this objective, the study applied one-sample t-tests on various J–K (formation–holding period) combinations of contrarian strategies to examine the statistical significance of contrarian profits. The study applies the portfolio construction methodology of Jegadeesh and Titman (1993) with slight adjustments. Based on cumulative returns of prior J (J = 1, 2, 3, 4, 5, 6, and 12) month/s, the stocks are classified into winners and losers groups with monthly re-balancing. The top 20% of the stocks are treated as the winner portfolio, while the bottom 20% represent the loser stock portfolio. After forming the equally weighted losers’ and winners’ portfolios at the end of every month (t), this study calculated the holding period returns for K (K = 1, 2, 3, 4, 5, and 6) month/s’ by assuming the contrarian approach (i.e., by taking long positing in prior loser stocks and short position in prior winner stocks). Contrarian return denotes the difference of returns between equally weighted loser (

This procedure gave us 252 combinations of contrarian strategies tested during the dumping phase of each manipulation incident in all the countries. Following Hackethal et al. (2019), this study sets the length of the post-manipulation (crash) period as the month of manipulation and the following 2 months. It proposes the testing window presented in Figure 1.
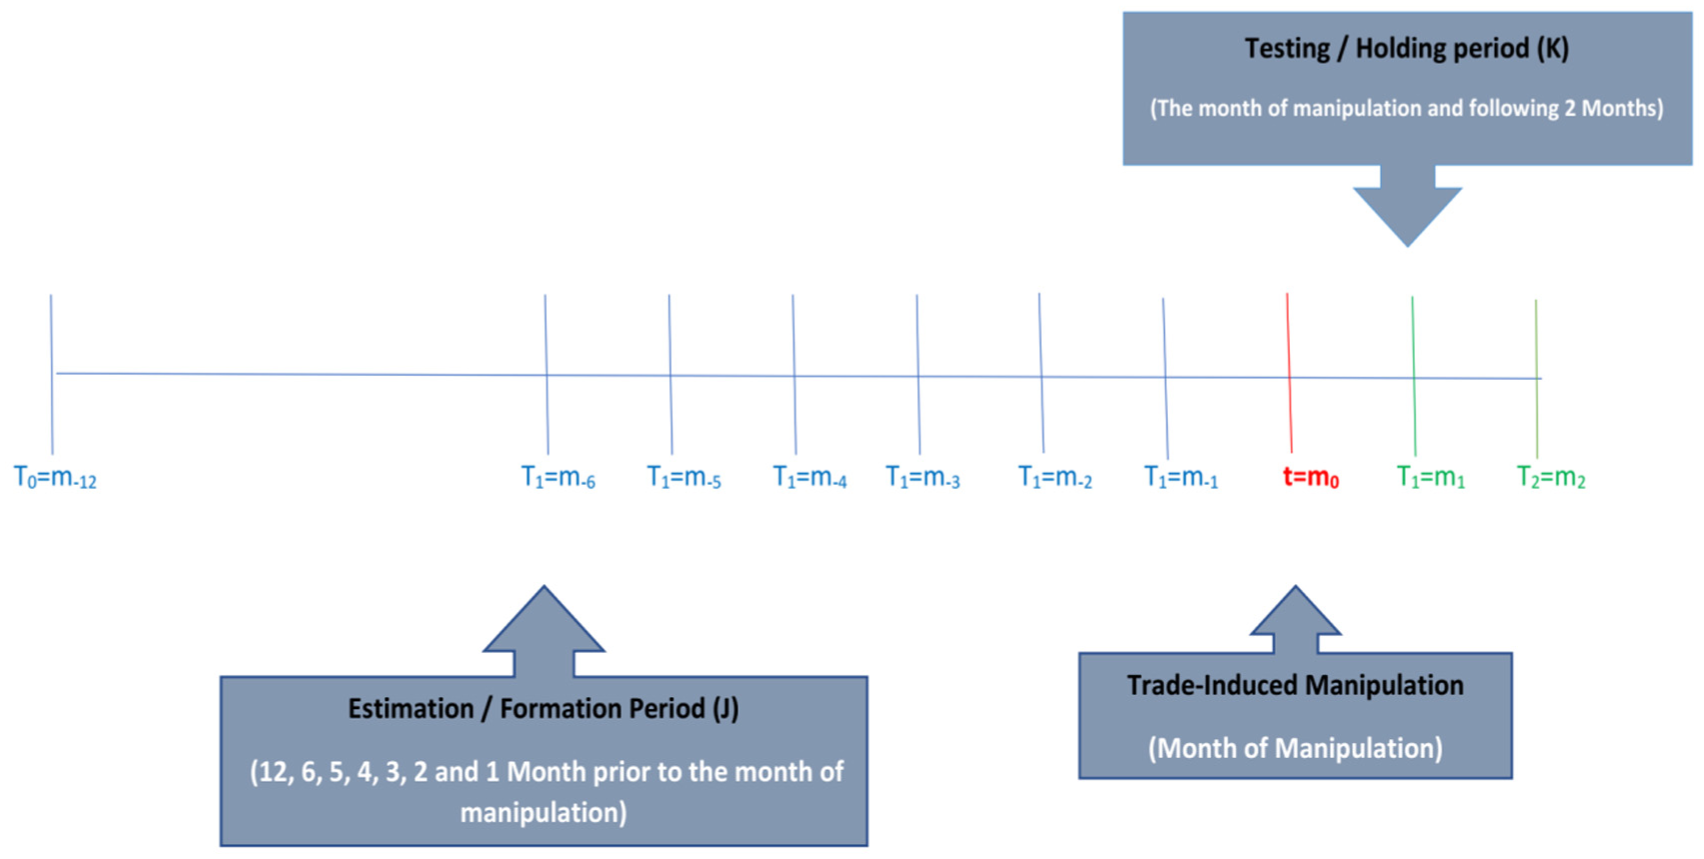
Testing window for examining contrarian effect during trade-induced manipulations.
Where t = m0 represents the actual month of manipulation, the estimation (formation) period consists of cumulative returns of prior J (J = 1, 2, 3, 4, 5, 6, and 12) month/s’. Although this study tested the contrarian strategy returns for K (K = 1, 2, 3, 4, 5, and 6) holding month/s’, its principal focus was on the returns of K = 1, 2, and 3 holding months because these months represent our event window, that is, the month of manipulation (K = 1) and following 2 months (K = 2, 3). In contrast, the remaining holding months (K = 4, 5, and 6) were tested only for comparison.
The methodology employed in the study demonstrates a comprehensive approach to detecting stock market bubbles and manipulative incidents through advanced econometric techniques such as SADF and GSADF tests. However, external market conditions, regulatory variations, and dividend payout policies across different countries may influence Price-dividend ratios, distorting study conclusions. Moreover, the contrarian technique also evaluates short-term results (1–3 months) without considering long-term market corrections or economic factors. Including long-term contrarian strategy returns in future research may incorporate the full impact of manipulative practices.
Empirical Results and Discussions
Evidence of Rational Stock Market Bubbles
This study examined the effect of key changes in South Asian emerging markets that can influence the macro-environment of the markets. This will further influence market efficiency through the profits of contrarian anomalies in these stock markets. Another focus of this research was on evaluating contrarian anomaly returns during pump-and-dump manipulative bubbles. For the first instance, to highlight the overall bubbles in selected emerging markets, Tables 1 to 3 report the results based on both SADF and GSADF approaches. The findings of this study reveal that the null hypotheses of no bubbles can be rejected for all the South Asian countries based on the conclusions of the GSADF method because the test statistics derived from the sample data are more significant than critical values at the significance levels of 1%, 5%, and 10%. According to the findings of the SADF approach, however, the rejection of the null hypothesis is observed for India and Bangladesh for all the significance levels. Still, for Pakistan, the results are significant only at a 10% significance level. The weak significance level for the Pakistani stock market suggests less pronounced bubble activity, possibly due to changing market dynamics, economic structure, or less speculative investment behavior than other South Asian emerging markets. The presence of rational bubbles over the whole sample period is more prominent and significant according to the GSADF approach as it covers more sub-samples from the data. Therefore, we can conclude that there is ample evidence regarding multiple stock market bubbles in selected South Asian emerging markets.
The SADF and GSADF Tests—Pakistan.

Note. Right-tailed ADF test, the sample period ranges from January 1997 to December 2018. There are 264 monthly observations. Critical values are based on a Monte Carlo simulation (run in EViews) with 1000 replications. The smallest window size has 32 observations. In parenthesis are the p-values of t-statistic.
and ***Denote the significance levels at 10% and 1%, respectively.
The SADF and GSADF Tests—India.

Note. Right-tailed ADF test, the sample period ranges from January 1997 to December 2018. There are 264 monthly observations. Critical values are calculated through Monte Carlo simulation (run in EViews) with 1,000 replications. The smallest window size has 32 observations. In parenthesis are the p-values of t-statistic.
Denotes the significance level at 1%.
The SADF and GSADF Tests—Bangladesh.

Note. Right-tailed ADF test, the sample period ranges from January 1994 to December 2018. There are 300 monthly observations. Critical values are calculated through Monte Carlo simulation (run in EViews) with 1,000 replications. The smallest window size has 30 observations. In parenthesis are the p-values of t-statistic.
Denotes the significance level at 1%.
The prime reason for applying SADF and GSADF tests is that these tests precisely date-stamp bubbles by recording their originating and terminating dates, which is further used at later stages for binary modeling analysis in panel regression. To highlight the multiple bubble periods, this study compared the forward ADF statistic with the ADF critical value sequence at the 95% significance level obtained from Monte Carlo simulations with 1000 replications. Figures 2 to 4 report the findings relating to the date-stamping procedure during the entire study period for each South Asian country. From Figure 2, we can observe six periodically bursting bubbles (i.e., the blue lines represent the forward ADF test statistics value sequence that crosses the 95% ADF critical value sequence represented through red lines) in the Pakistan stock exchange during the sample period ranging from January 1997 to December 2018. Likewise, two and four periodically collapsing bubbles can be observed in the stock exchanges of India and Bangladesh, as depicted in Figures 3 and 4, respectively. These results are consistent with Akhter and Yong (2019), who identified similar stock market bubbles in the Dhaka stock exchange through SADF and GSADF tests. Furthermore, Furthermore, Azad et al. (2014) highlighted similar incidents of stock market bubbles in Pakistani and Indian stock markets.

Date-stamping of bubble periods in Pakistan price-dividend ratio: GSADF test.
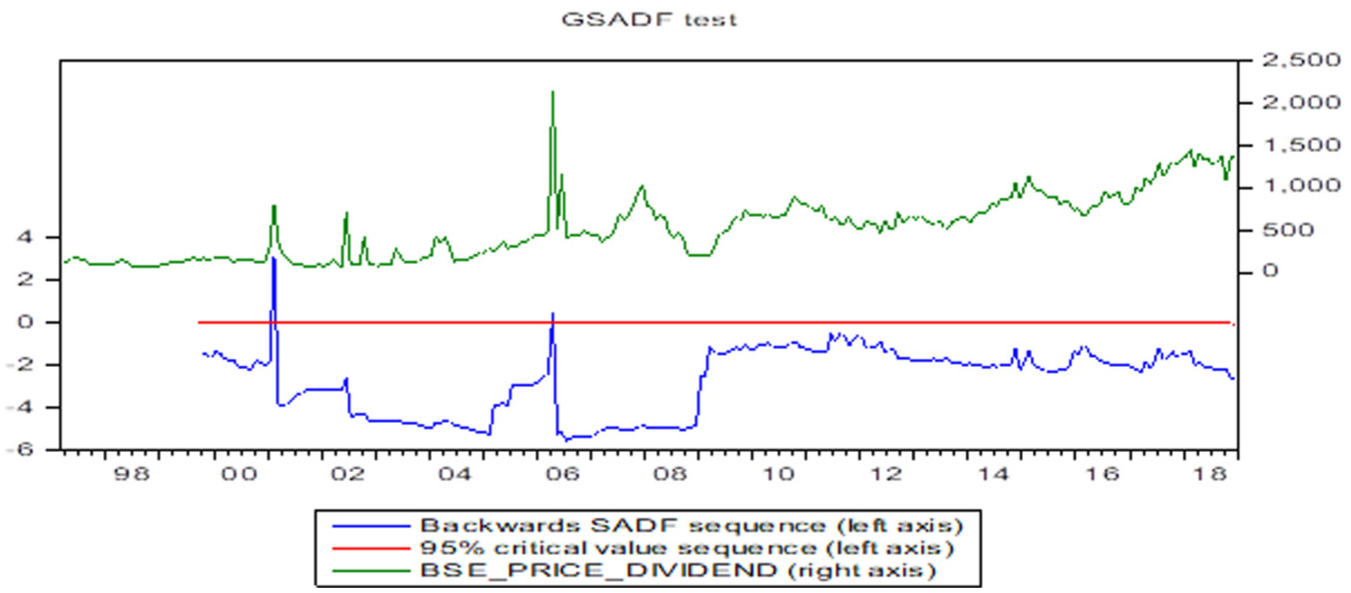
Date-stamping of bubble periods in India price-dividend ratio: GSADF test.

Date-stamping of bubble periods in Bangladesh price-dividend ratio: GSADF test.
As derived from Figures 2 to 4, GSADF tests successfully identified all the famous speculative bubbles in sample emerging markets. For instance, the Bangladeshi Stock Market experienced a notable bubble phase from October 2009 to February 2011, corresponding to the time when share market fraud was at its worst due to government incompetence. The market experienced an extraordinary price hike from 2009 to the start of 2011. The market index experienced a fall of 10% in January 2011 and then a further fall of 30% in February 2011. An analogous trend was observed in PSX from January 2017 to March 2017, when the KSE 100 experienced a significant surge and then a decline of 15%; this period was considered the worst period for PSX since the global financial crisis 2008. The KSE 100 index experienced an extraordinary rise of 23.45% and reached a record highest level of 52,874.46 points, then dropped to 40,471.48 points in May 2017 (Siddiqui, 2018). The possible reason behind this sharp increase in the market index and consequent decline was political unrest in Pakistan when the ruling prime minister, Mian Nawaz Sharif, faced disqualification, which caused the bearish run in the Pakistan stock market. The complete chronology of market bubbles over the entire study period in all the emerging markets can be seen in Table 4. As mentioned earlier, the date-stampings of all bubble periods are derived through SADF and GSADF tests with the help of Figures 2 to 4, respectively, for Pakistan, India, and Bangladesh stock markets.
Date-stamping of Stock Market Bubbles.

Note. This table provides the date-stamping procedures (the originating and ending periods) of multiple stock market bubbles during the entire sample period in selected emerging markets. The results are derived through GSADF test in EViews. Panel A, B, and C represent the stock market bubbles in Pakistan, India, and Bangladesh, respectively.
Identification of Manipulative Bubbles in South Asian Markets
It is pertinent to highlight here the difference between rational and manipulative bubbles. The rational bubble is the deviation of a stock’s price from its intrinsic or fundamental value, leading to a useless variable (Diba & Grossman, 1988). However, pump-and-dump manipulative bubbles represent the artificial increase and decrease in stock prices by unchecked stock market intermediaries. The current study initially highlights the overall periods of stock market bubbles through GSADF tests in the selected South Asian stock markets. Then, it verifies which of those bubbles represents the manipulative bubbles. Upon verification from various published sources in each country, this study found that the bubbles of 2000, 2005, and 2015 represent manipulative bubbles for the Pakistan stock market (PSX). Similarly, the bubble of 2001 represents the manipulative bubble for the Indian stock market (BSE). Finally, the bubbles of 1996 and 2005 were manipulative for the Bangladeshi stock market (DSE).
PSX’s most notable manipulation periods are May 2000, March 2005, and February 2015. Because of brokers’ trade-inducted manipulations, the primary index of the market (KSE 100) dropped by over 19% in May 2000 (SECP, 2000). The same incident happened in March 2005 when the main index dropped by around 25%. A similar manipulation incident occurred in February 2015 when the market's main index experienced a continuous decline from the second half of February 2015 till the end of March 2015. During the 2000 manipulation incident, the PSX experienced a consistent bull run in both the trading volumes and the KSE 100 price index, beginning right after the previous stock market crash in May 2000, which escalated toward the end of 2004. The KSE 100 index experienced an extraordinary rise of 65%, from 6,219 on 31 December 2004 to 10,304 on 15 March 2005, together with a massive increase in trading volume from approximately USD 300–400 million to USD 1–2 billion a day (Dawn, 2006). In mid-March 2005, the market started to decline, and by 12 April 2005, the index fell to 6,939 and registered a decline of about 32.7% from the peak (see Figure 2). Similarly, the KSE index started to rise in January 2015 but then experienced a continuous decline of 18.42% from February to March 2015. Any shift in the market fundamentals cannot justify the sharp increase in the market index. The consequent precipitous decline is a puzzle. Such an unprecedented increase in the index price and a subsequent collapse reflect the stock market’s classical speculative bubble. After this crash, the market took many months to rebound and restore investors’ trust.
In South Asia, India’s stock market has the highest market capitalization. The trading history of this market links back to the late 1800s when the “Native Stock and Share Brokers’ Association” was established. In India, there are presently 22 equity exchanges. The Mumbai-based BSE is one of the earliest markets in Asia, formed in 1875. It was established as per the Security Regulations Act of 1956. The current study mainly emphasized BSE because it reflects the overall stock trades in India. Several incidents of stock market manipulation have occurred in the past, including the famous crash of 1992. However, our study emphasized the manipulative incident of 2001, where the cartel of some market brokers influenced the prices, and the overall index experienced a fall of 21% alone in March 2001 (see Figure 3).
The dot-com bubble in information, entertainment, and communication stocks in the late 1990s around the world caused a bull run in BSE, which doubled the prices in a very short span of almost 2 years, that is, from January 1999 to January 2001. The speculative season led to over-extended positions and gave rise to several possibilities for manipulation and theft, personified by a Bombay bull. Ketan Parekh, a former stock broker from Mumbai, was considered the main villain in this whole manipulation episode. Through borrowing from numerous banks and companies using the stocks as collateral, he attempted to manipulate the illiquid stocks, referred to as the “K-10” stocks. His tactic worked fine in the bull market state but busted as the markets began collapsing in February 2001, led by a collapse in the BSE Sensex index. The BSE Sensex index crashed by almost 21% in March 2001, and K-10 shares declined by 67% (ICFAI, 2002).
Similarly, the nature of the Bangladeshi stock market is also speculative. During the 1990s, the market participants had little awareness regarding stock market operations. Upon being inspired by rumors, several investors pulled their money from banks and other portfolios to participate in the market. Even the citizens of Bangladesh serving abroad fueled the stock market through their foreign remittances. Therefore, the naive investors traded based on noise instead of market fundamentals. As a result, there were opportunities for speculators to influence market prices and earn huge profits. The stock exchange witnessed its initial manipulative bubble and subsequent crash from 1996 to 1997 (see Figure 4).
This major collapse in the market took place in December 1996. The large-scale foreign investment repatriation was the leading cause of this crash, which depressed the stock market. As per the statistics published by the Bangladesh Central Bank from 1992 to 1995, the purchasing of stocks by international investors surpassed the total number of stocks sold. The figures also reveal that over the period 1996 to1997, there was a large foreign investment outflow (more than 6 billion Bangladeshi Taka a year), in contrast to 0.6 billion Taka of foreign investors' investments over the comparable time that forced the overall stock exchange to collapse. The Securities Exchange Commission (SEC) probed the crisis because it was assumed that some individual investors and brokerage houses (foreign and domestic) had intentionally manipulated the stock market. In April 1997, the high court of Bangladesh ordered the arrest of 36 brokers, company executives, and dealers for triggering the December 1996 market crash. Evidence of pump-and-dump manipulation by brokers in DSE stocks was again found in March 2005, which caused the entire market index to fall by 23% within a short span of a few days (see Figure 4). All the manipulation incidents are being scrutinized under Section 7 of the ordinance.
Contrarian (Loser Minus Winner Portfolios) Returns During Pump-and-dump Manipulations
Tables 5 to 7 provide the mean returns of J-K contrarian strategies tested during each event window of pump-and-dump manipulations. Two hundred fifty-two contrarian strategies were tested during the dumping or crash phases of manipulations (the month of manipulation and 2 months thereafter, which is the event window). Most of the strategies indicate the existence of significant contrarian returns during the dumping period of manipulation in all the countries. In the case of the Indian stock market, for example (Table 5), all the strategies with formation period J (J = 1, 2, 3, 4, 5, 6, and 12) month/s generate statistically significant contrarian returns in holding period K (K = 1, 2, and 3 month/s).
Contrarian Returns During Dumping Phase of Trade-induced Manipulations: India (2001).

Note. This table provides the contrarian returns during dumping (crisis) phases of manipulation periods. Based on prior J (J = 1, 2, 3, 4, 5, 6, and 12) month/s cumulative returns, the stocks are sorted into winners’ and losers’ portfolios at the end of each month (t). The top 20% of the stocks form winner portfolios, while the bottom 20% form loser portfolios. Contrarian returns are the subsequent returns calculated as the holding period K (K = 1, 2, 3, 4, 5, and 6) month/s return difference between the equally weighted loser and winner portfolios (LMW). The event window consists of holding period K (K = 1, 2, and 3) month/s. In parentheses are the values of robust t-statistic that are adjusted for heteroskedasticity and autocorrelation based on Newey and West (1987).
Represent the respective levels of significance at 1%.
Contrarian (LMW) Returns During Dumping Phase of Trade-induced Manipulations in Pakistan.
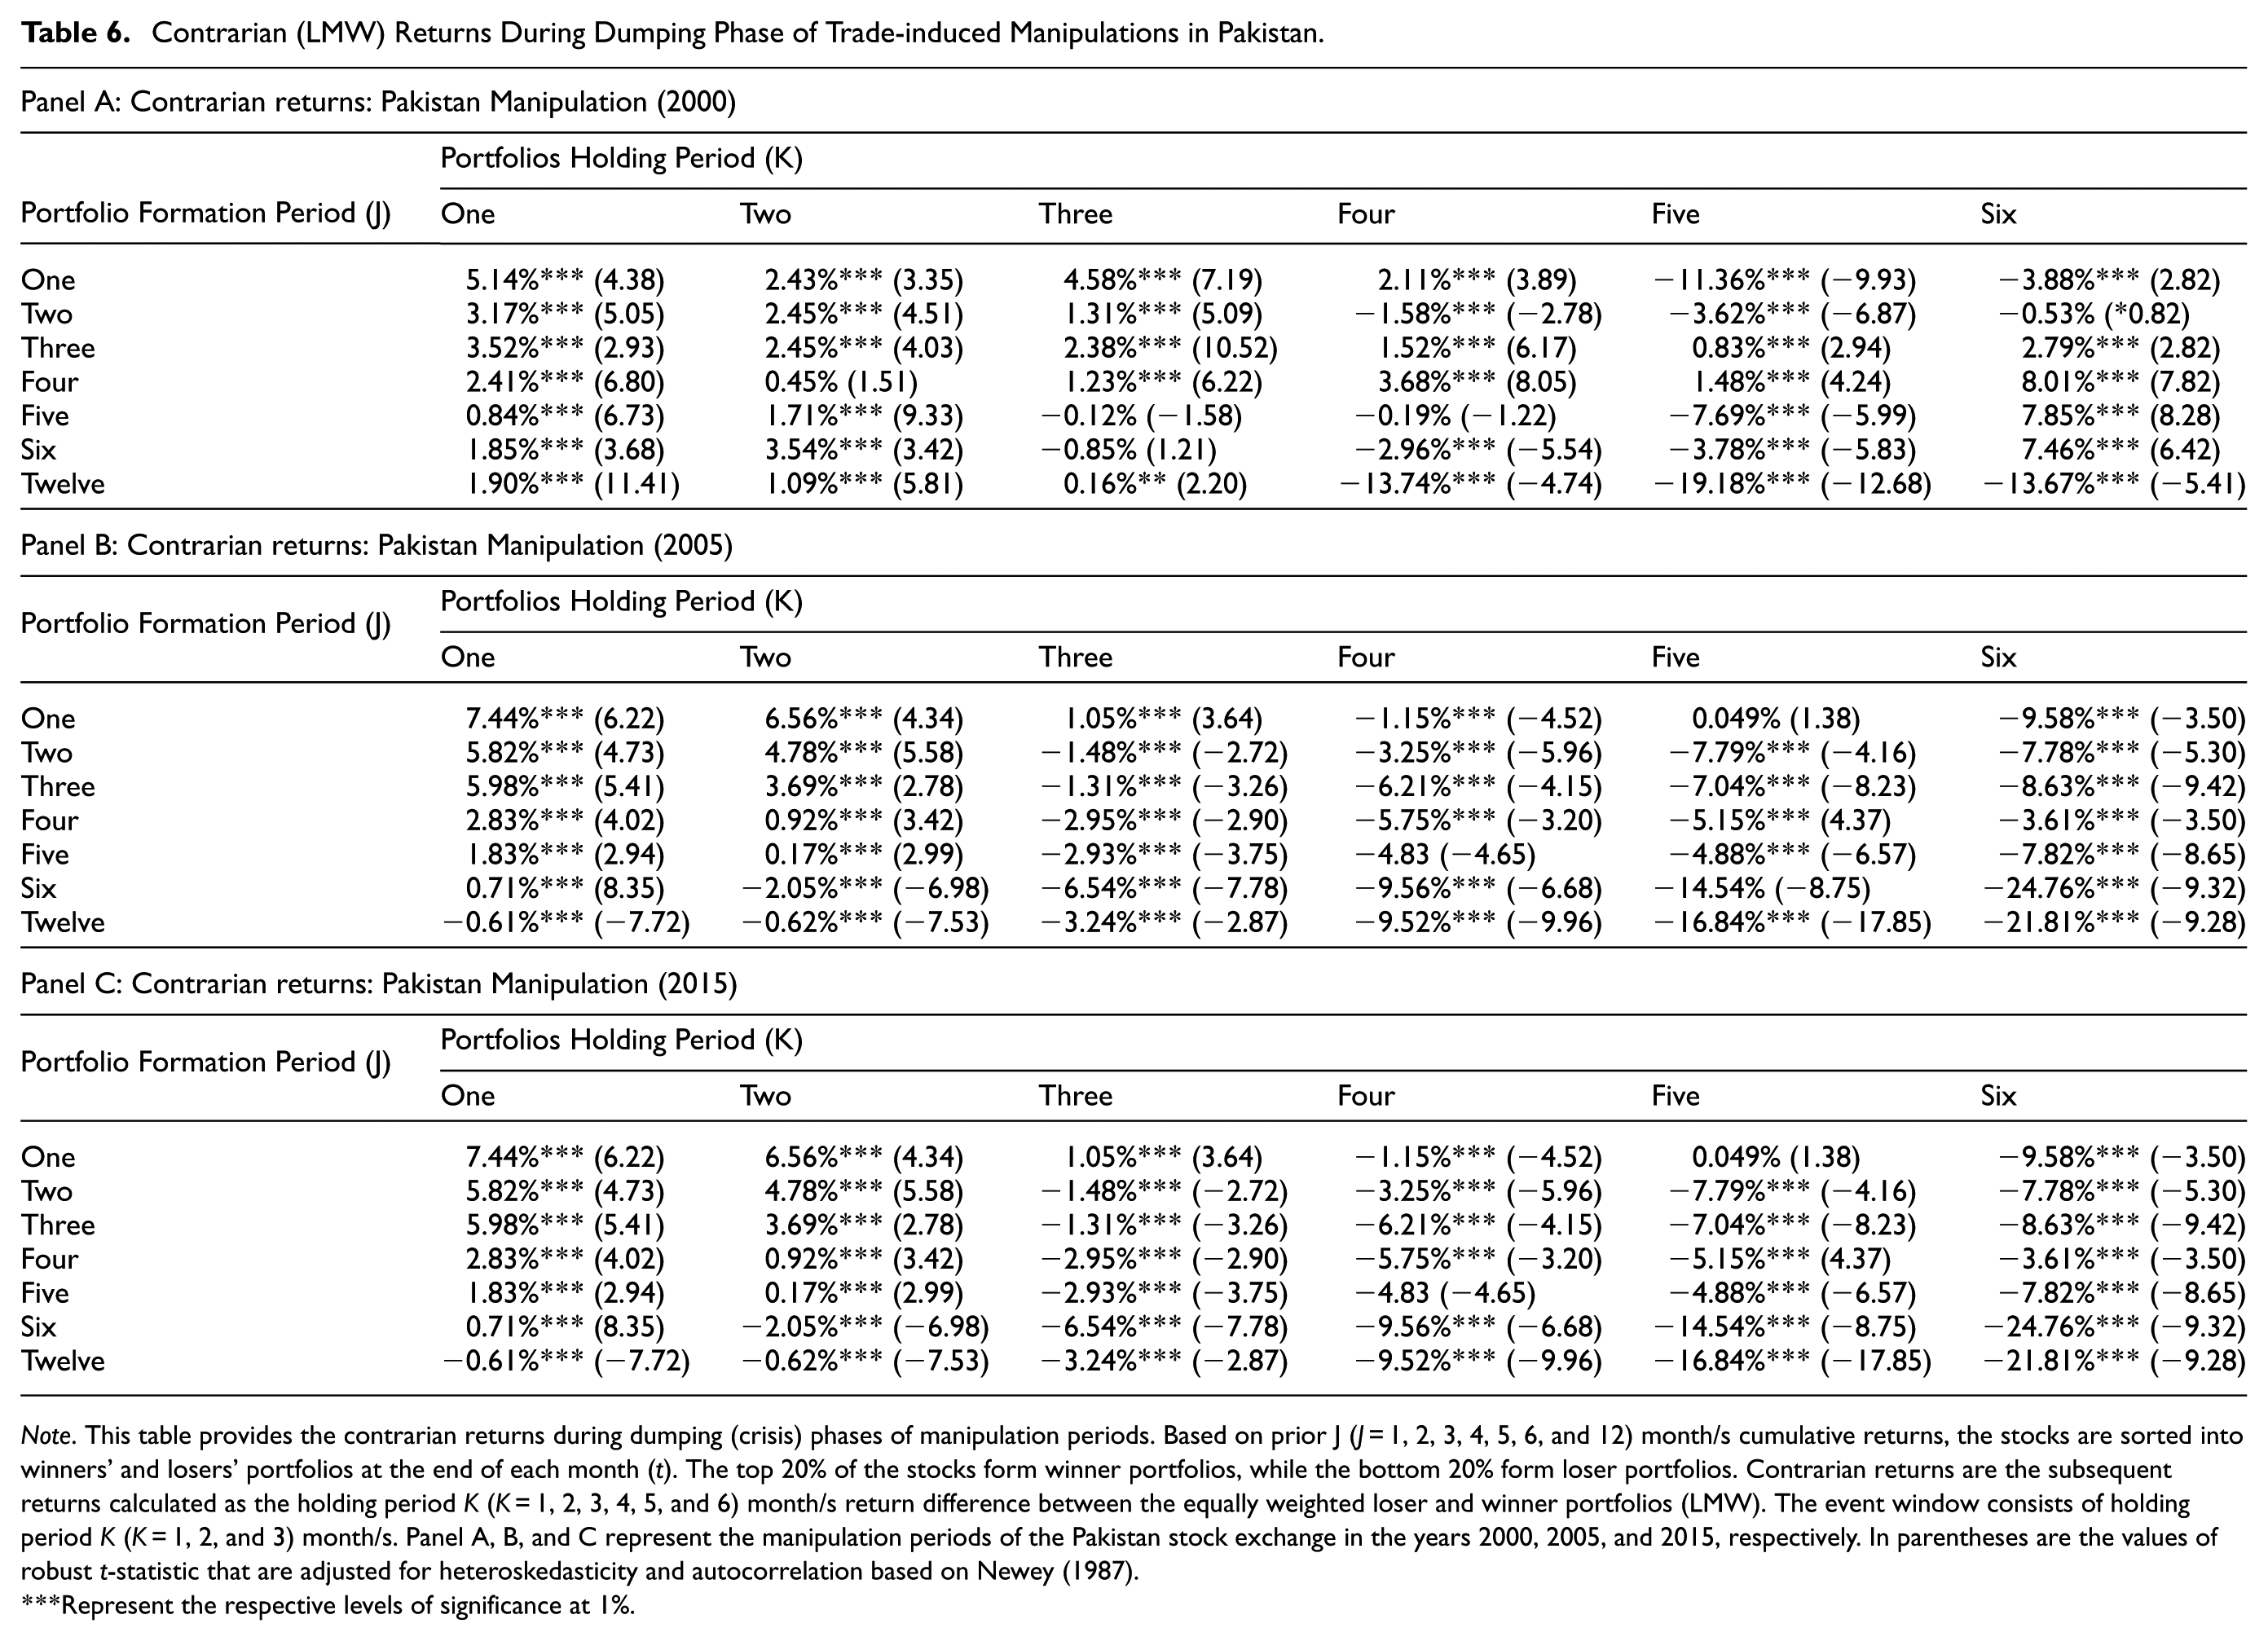
Note. This table provides the contrarian returns during dumping (crisis) phases of manipulation periods. Based on prior J (J = 1, 2, 3, 4, 5, 6, and 12) month/s cumulative returns, the stocks are sorted into winners’ and losers’ portfolios at the end of each month (t). The top 20% of the stocks form winner portfolios, while the bottom 20% form loser portfolios. Contrarian returns are the subsequent returns calculated as the holding period K (K = 1, 2, 3, 4, 5, and 6) month/s return difference between the equally weighted loser and winner portfolios (LMW). The event window consists of holding period K (K = 1, 2, and 3) month/s. Panel A, B, and C represent the manipulation periods of the Pakistan stock exchange in the years 2000, 2005, and 2015, respectively. In parentheses are the values of robust t-statistic that are adjusted for heteroskedasticity and autocorrelation based on Newey (1987).
Represent the respective levels of significance at 1%.
Contrarian (LMW) Returns During Dumping Phase of Trade-induced Manipulations in Bangladesh.

Note. This table provides the contrarian returns during dumping (crisis) phases of manipulation periods. Based on prior J (J = 1, 2, 3, 4, 5, 6, and 12) month/s cumulative returns, the stocks are sorted into winners' and losers’ portfolios at the end of each month (t). The top 20% of the stocks form winner portfolios, while the bottom 20% form loser portfolios. Contrarian returns are the subsequent returns calculated as the holding period K (K = 1, 2, 3, 4, 5, and 6) month/s return difference between the equally weighted loser and winner portfolios (LMW). The event window consists of holding period K (K = 1, 2, and 3) month/s. Panels A and B represent the manipulation periods of the Bangladeshi stock exchange in the years 1996 and 2005, respectively. In parentheses are the values of robust t-statistic that are adjusted for heteroskedasticity and autocorrelation based on Newey and West (1987).
and ***Represent the respective levels of significance at 5% and 1%.
Panels A, B, and C of Table 6 correspond to the contrarian returns during the dumping phases of PSX manipulation periods of 2000, 2005, and 2015, respectively. In panel A, similar to the Indian market, strategies with formation period J (J = 1, 2, 3, 4, 5, 6, and 12) month/s generate statistically significant contrarian returns in holding period K (K = 1, 2, and 3) month/s, while panels B and C confirm the statistically significant contrarian effects with formation period of J (J = 1, 2, 3, 4, and 5) month/s during 2005 and 2015 manipulations in Pakistan.
Panels A and B of Table 7 summarize the findings of contrarian returns during the crash phases of manipulations in the Bangladeshi stock market in 1996 and 2005. Panel A depicts the same picture as observed in the manipulation incidences of India in 2001 and Pakistan in 2000. All the strategies with formation period J (J = 1, 2, 3, 4, 5, 6, and 12) month/s generate statistically significant returns during the formation periods of K = 1, 2, and 3 months. The results in Panel B show contrarian returns under holding period J (J = 1, 4, and 5) month/s strategies. The main reason for a slightly lower contrarian effect in this manipulation phase could be that the duration of the pumping period was too short in this manipulation. The findings of this section corroborate the results of Daniel and Moskowitz (2016), who state that momentum strategy crashes during the crisis phases of stock markets. At the same time, the contrarian investment strategy outperforms the momentum strategy during these phases.
Interestingly, the magnitude of contrarian returns increases for strategies with a shorter formation period. The smaller the J-month formation period, the higher the K-month return during dumping. Notably, in most manipulative events, the highest return spread was observed to be associated with that combination of contrarian strategy whose formation period is similar to the length of the pumping (bubble) period. For example, in the case of Indian stock market manipulation in March 2000, the manipulation starts around January (2 months before the month of manipulation), while the contrarian strategy with J = 2 months (formation period) outperforms all other strategies. The same holds for Pakistan stock market manipulation in 2000, 2005, and 2015, as well as for the Bangladeshi stock market in 1996 and 2005. From an investment perspective, this important finding implies that those momentum investors suffer the most who get trapped into deceptive, manipulative signals right from the beginning of the pumping period of manipulation.
To examine the market overreaction during pump-and-dump manipulation periods, this study selected six strategies that generate the highest contrarian returns (J–K = 1–1, 1–2, 2–1, 2–2, 3–1, and 3–2) in all the countries. It analyzed the behavior of winner and loser portfolios during the (pumping) and post (dumping) phases of manipulations. Panels A, B, and C of Table 8 report the mean returns of losers and winners’ portfolios during the phases of pre- and post-manipulations for India, Pakistan, and Bangladesh, respectively. The analysis of mean returns to losers’ and winners’ portfolios in three panels reveals that the greater profits of contrarian strategy are driven primarily by prominent short-term reversals in past winner (overhyped) stocks, mainly during post-manipulation phases. However, the losing stocks generate positive returns during this period. These results indicate a clear picture of overreaction and prove our intuition about the pumping and dumping phases of trade-induced manipulations that the market intermediaries, through manipulative tactics, artificially create a bubble-like situation and attract the naive investors, who consider the higher trading volume and rising prices as an indication of increased future earnings. These investors overreact to these manipulative bubbles and suffer huge losses during the post-manipulation phases when the manipulators exit the market. Truong et al. (2023), and Mohanty and Mishra (2024) found similar overreaction effects during the crisis periods of stock markets in the Indian and Vietnam stock markets. Mohanty and Mishra (2024) provided risk-based explanations for the overreaction effect in the Indian stock market during crises like COVID-19.
Mean Returns of Winner and Loser Portfolios Following Pre- and Post-manipulation.

Note. This table provides the mean returns to winner and loser portfolios during pre- and post- manipulation phases. Panels A, B, and C represent the results for India, Pakistan, and Bangladesh, respectively. Based on prior J (J = 1, 2, 3) month/s cumulative returns, the stocks are sorted into winners and losers’ portfolios at the end of each month (t). The top 20% of the stocks form winner portfolio, while the bottom 20% form loser portfolios. Mean returns to winner and loser portfolios are the subsequent returns calculated as the holding period K (K = 1, 2) month/s return for equally weighted portfolios of stocks in each portfolio. In parentheses are the values of robust t-statistic that are adjusted for heteroskedasticity and autocorrelation based on Newey and West (1987).
, **, and ***Represent the respective levels of significance at 10%, 5%, and 1%.
Robustness Test: Evidence From Panel Regression
For the robustness of all the above findings, this study applied a panel regression with a binary formation of all the market macro environment-related variables (e.g., pre-manipulation, post-manipulation, market state, volatility, and crisis periods). This approach allowed us to examine the influence of all those market states on time-varying contrarian effects. The estimation procedure followed Umutlu et al. (2010), where the study regresses the series of contrarian payoffs (LMWit) on period dummies of pre-manipulation, post-manipulation, volatility, market state, Asian Crisis, Global Crisis, and country-specific fixed effects as per Equation 12:
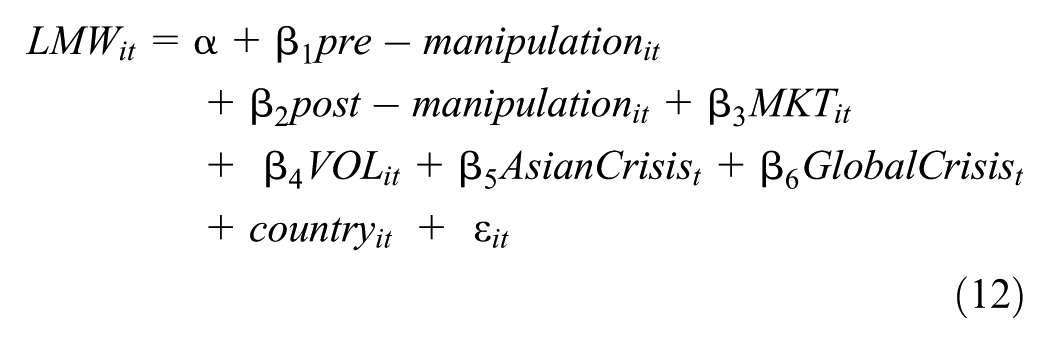
Where LMWit is the monthly series of contrarian payoffs for country i at time t. The pre-manipulation is a dummy variable of trade-induced manipulations that represents the value 1 for all months in pumping or bubble period for a country at time t and zero otherwise. To identify the pre-periods of manipulation, we employed the date-stamping procedure of market bubbles derived through the GSADF test. This test provides the starting and ending dates of a bubble period. Following Hackethal et al. (2019), post-manipulation is the dumping or crash period dummy, representing the value 1 in each country for the month of manipulation and 2 months thereafter. Following Cooper et al. (2004), Wang and Xu (2015), and Demirer et al. (2017), MKTit represents the dummy variable of market condition that takes the value 1 when the lagged 3-year return on market index is negative for country i at time t and zero otherwise. VOLit is the dummy factor of stock market volatility where the value 1 represents that the lagged 6-month volatility of the market index is higher than the lagged-12 months volatility for country i at time t, while zero otherwise. By following Umutlu et al. (2010), AsianCrisis denotes the dummy factor that represents the 1998–1999 Asian financial crisis and has the value 1 for all countries throughout that period, while zero otherwise. Following Munir, Sukor, et al. (2022), the Global Crisis dummy, which represents the global financial crisis that lasted from 2007 to 2009, assigns a value of 1 to every country from October 2007 to September 2009, while zero otherwise. The impact of country-specific fixed effect on contrarian strategy payoffs is controlled in the model through the dummy variable (
Table 9 provides the findings of regression Equation 12. As expected, the negative and significant coefficient of the pre-manipulation dummy reveals momentum profits at the start and during the pumping phase of manipulation. This is due to the artificial surge in prices, which attracts uninformed momentum traders who rush to buy a greater bulk of stocks by responding to the deceptive signal of brokers. In contrast, the positive coefficient of the post-manipulation dummy reflects that the dumping or crash periods of manipulation are associated with significant contrarian returns. This finding implies that the exit of the manipulators from the market during post-manipulation periods results in a sheer decline of buying volume, thereby causing high losses to winning stocks’ portfolios. The findings of pre- and post-manipulations corroborate with the results of prior studies. Cooper et al. (2004) revealed that the profitability of momentum profits is higher during market bubbles, while the predictability of momentum profits is at the lowest level during stock market crashes (Asness et al., 2015; Daniel & Moskowitz, 2016; Hao et al., 2018; Munir, Sukor, et al., 2022).
Results From Panel Regression With Binary Formation of Varying Market Conditions.
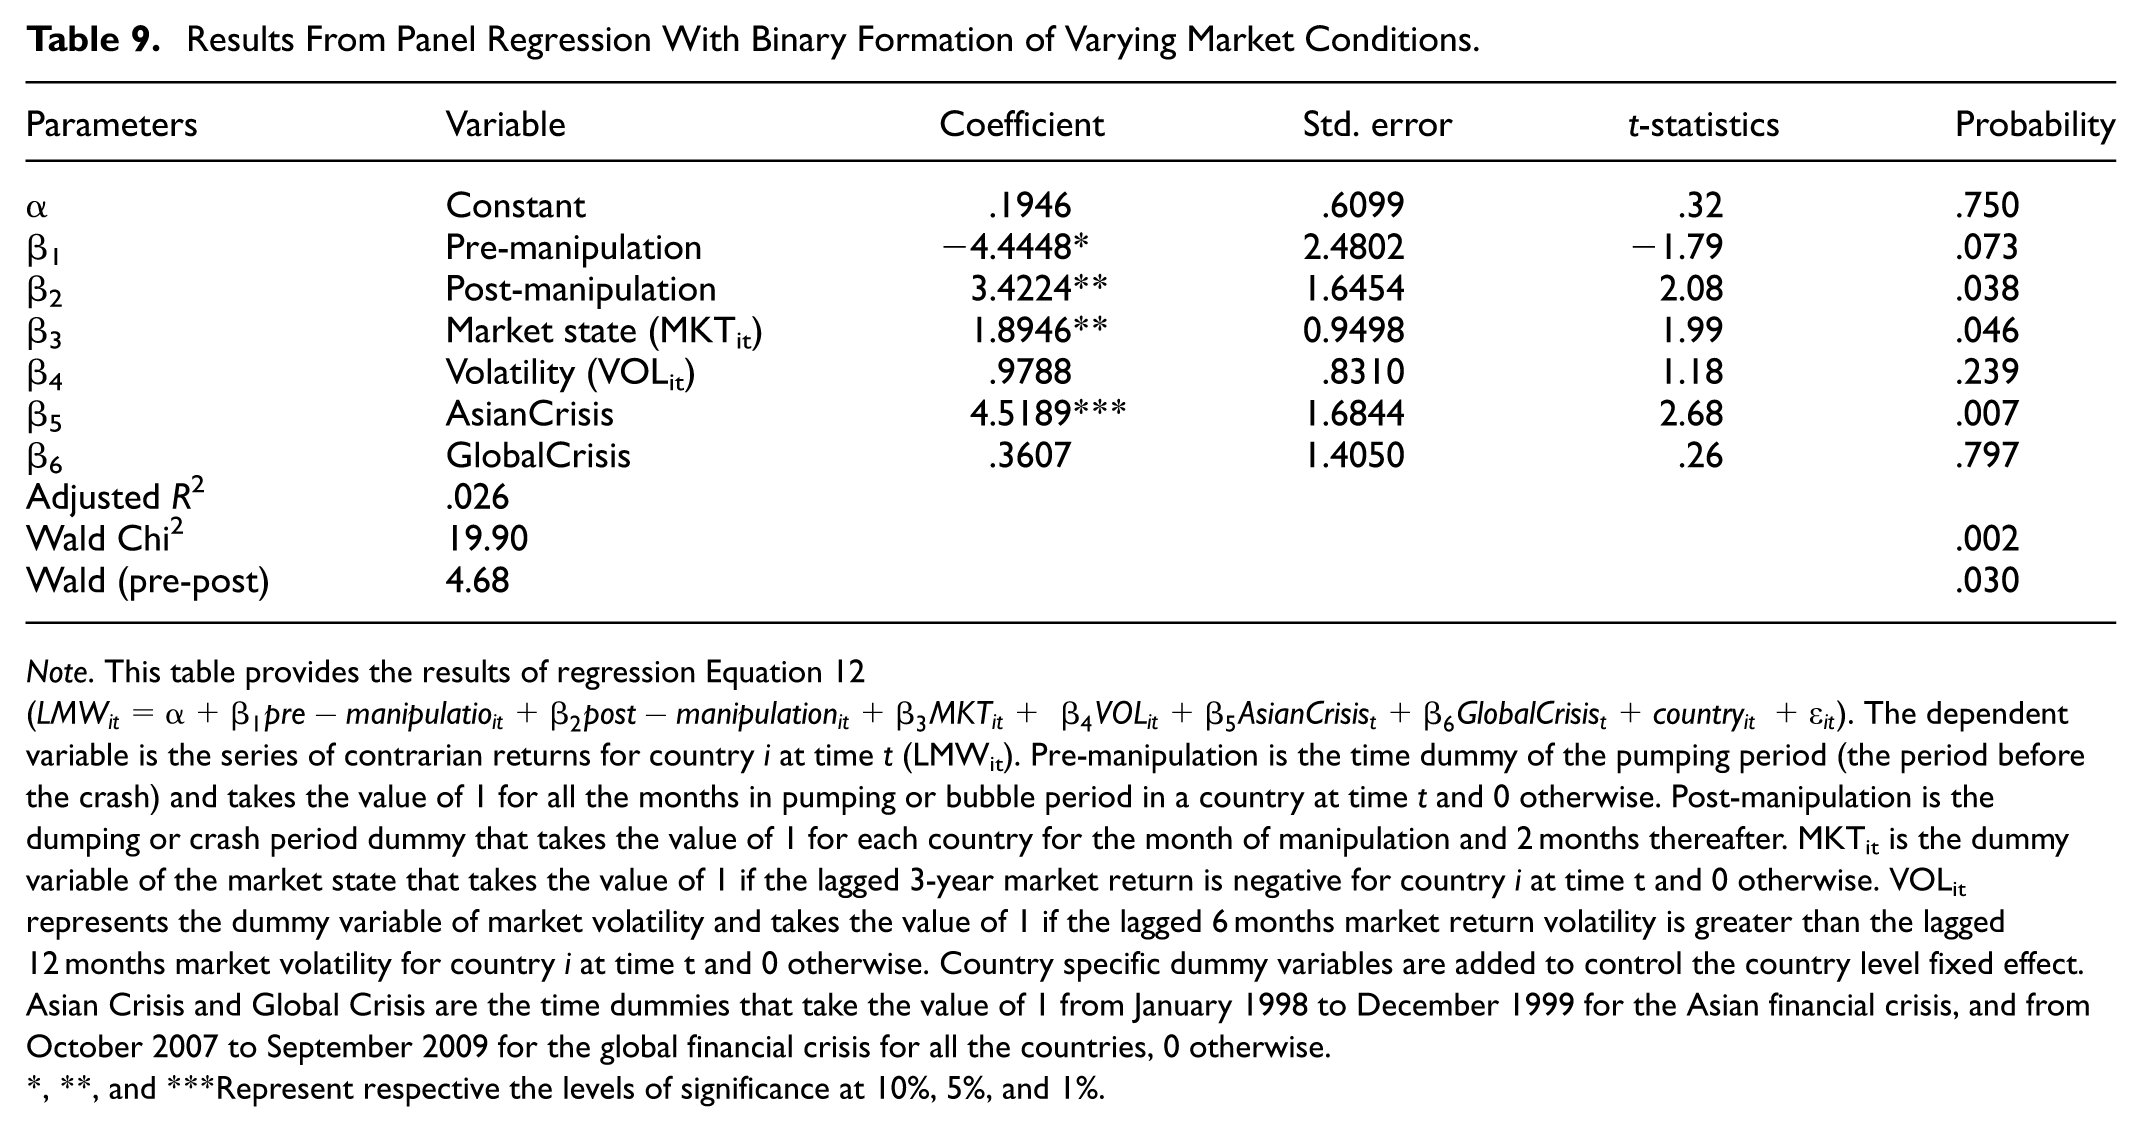
Note. This table provides the results of regression Equation 12 (
, **, and ***Represent respective the levels of significance at 10%, 5%, and 1%.
Furthermore, this study finds that contrarian profits are higher during adverse market conditions and higher stock market volatility as both MKTit and VOLit variables are positive. However, the large and significant coefficient of MKTit implies that it is most likely the state of the market that primarily drives contrarian strategy returns in emerging markets rather than market volatility. The direction of the relationship between market state and volatility also corroborates with the findings of prior studies (Demirer et al., 2017; Mittal et al., 2020; Munir et al., 2020; Wang & Xu, 2015). Consistent with the findings of Demirer et al. (2017), higher contrarian returns are mainly observed during adverse market conditions. Furthermore, along the lines of Wang and Xu (2015), volatility has a positive nexus with contrarian strategy returns. The Asian crisis dummy is significantly positive, suggesting that contrarian profits rose throughout the Asian financial crisis. However, there is an inconsistent association between global financial crisis and contrarian strategy payoffs, as the coefficient of the global crisis dummy is either small or insignificant. Compared to the global financial crisis, the Asian financial crisis has a more substantial effect on the market efficiency of selected emerging markets. Nevertheless, the post-manipulation or dumping (crash) period of manipulation is found to be the second-best period for contrarian returns, which implies that the market efficiency of South Asian stock markets also deteriorates during pump-and-dump manipulations. Finally, the results of Wald test statistics for the difference between pre-and post-manipulation coefficients further validate the significance of the shift in contrarian strategy payoffs from pre- to post-manipulation periods.
Conclusion, Implications, and Suggestions for Future Research
Stock market manipulation practices present significant challenges for practitioners and regulators in emerging markets. This paper sheds light on stock manipulation practices that have influenced the stock market efficiency of South Asian emerging markets for many years. By employing various advanced econometric tests, the study provides conclusive evidence of stock market manipulations in South-Asian stock markets. These manipulation incidents also confirm that the selected South-Asian markets are inefficient. In the second research phase, this study examines whether a contrarian investment strategy can yield higher returns for investors during manipulation periods. In the empirical analysis, the study specifically focuses on the emerging markets of India, Pakistan, and Bangladesh, as speculative profits and manipulative bubbles are common issues.
The study finds various incidents of pump-and-dump manipulations in South-Asian stock markets. Consistent with Azad et al. (2014), and Akhter and Yong (2019), most manipulation episodes share a similar pattern. During the pumping phase of manipulation, the manipulators (unchecked market intermediaries) artificially inflate stock prices through excessive buying. The uninformed investors show herd behavior and start buying the same stocks, hoping for higher returns. This allows manipulators to sell their stock positions and leave the market gradually. When manipulators leave the market, the stock prices experience a sharp decline, and consequently, the uninformed trades suffer huge losses. To devise a suitable strategy for investors during manipulation episodes, the current study tests the profitability of contrarian investment strategy during the dump or crash phases of pump-and-dump manipulations. Momentum and contrarian investment strategies are the two stock market anomalies that constantly challenge the efficient market hypothesis’ (EMH) validity. The current study’s findings reveal that the contrarian strategy yields average monthly returns of 5.72%, 10.18%, and 8.28%, respectively, for a 3-month post-manipulation or dumping period in the Indian stock market. Similarly, the returns of contrarian strategy are again higher during the post-manipulation phases of Pakistan and Bangladesh stock markets. Additional analysis reveals that higher contrarian returns during post-manipulation or dumping phases were primarily due to the short-term return reversals of winner stocks during these phases. The study reached similar conclusions by applying panel regressions through the binary formation of market manipulation and macro environment-related variables. These results are consistent with the findings of Daniel and Moskowitz (2016), who claim that momentum strategy crashes during the crisis phases of stock markets.
The findings of this study are helpful for analysts and researchers to support their claims that emerging economies have structural problems and that investor behavior is distinctive. These characteristics and issues of emerging economies make it easier for speculative and noisy trading to flourish, ultimately harming investors in the long run. Also, during times of manipulation and higher uncertainty, herd-like behavior and lack of knowledge among retail investors might result in a significant devaluation and destruction of the value of their portfolios. Long-term market inefficiencies brought on by manipulation may result in an unattractive market where potential retail investors will be reluctant to invest. Furthermore, the overall results imply that a contrarian investment strategy generally succeeds in the selected sample of South Asian emerging markets, which provide alternative assessment matrices to investors and fund managers.
Additionally, this study provides vital insight for regulators and policymakers to realize why emerging stock markets remain inefficient because of pump-and-dump manipulation and how unprotected individual investors might survive in the weak regulatory environment. The findings draw the attention of regulators to the need for prudent regulations to restrict manipulation in sample emerging markets. These manipulations undermine public confidence in the stock markets and obstruct further expansion. However, as emerging country models may not immediately apply to developed markets due to market dynamics and variations in economic circumstances, the authors emphasize the significance of rules specifically designed for these markets. Policymakers may create a hybrid regulatory framework that contains flexibility for local conditions while incorporating actual ideas from established markets to support their policy suggestions. This includes policies that may be adjusted to meet emerging countries’ particular difficulties, such as improved market monitoring, transparency standards, and strong investor protection.
If an unsophisticated investor follows the study’s recommendation, recognizing manipulated stocks and selecting where to invest would require awareness of trade-induced manipulation patterns, particularly during dumping or crash phases. While the study suggests that the contrarian strategy could work effectively in South Asian markets, it does not offer specific guidelines for identifying manipulated stocks. Instead, the contrarian approach relies on observing broader market trends, where investors buy underperforming stocks after a market downturn, expecting them to rebound as manipulative forces diminish. However, this requires a solid understanding of market signals and timing, which might not be easily accessible to unsheltered, unsophisticated investors. The investor would use the contrarian strategy to reverse “winner portfolios” during the dumping phase to achieve higher returns. This means that during periods of manipulation, when certain stocks are sold off aggressively (dumped), these stocks may become undervalued. Investors gain as the stock prices correct themselves by purchasing these underpriced stocks and holding them until the market stabilizes or recovers. As for manipulators, they may only succeed over time if enough unsheltered investors adopt contrarian strategies. By countering manipulative actions, these investors could effectively limit the success of manipulation schemes. However, manipulators may adapt and evolve their strategy, finding new ways to exploit market weaknesses. As a result, countermeasures like contrarian investing may become less effective unless continuously refined to adapt to changing market behaviors. In essence, while contrarian strategies can work in markets with observable manipulative trends, their long-term success is not guaranteed, significantly if manipulators change their tactics in response to countermeasures like those recommended by the study.
Finally, future studies can provide further insight into the topic by examining the success of some alternative investment methods, such as value investing or dynamic momentum investing, as seen mainly in more developed stock markets. Future studies may examine whether these investment techniques’ return predictability follows the same trend as reversals during pump-and-dump manipulations. Daniel and Moskowitz (2016) recently examined the dynamic momentum investment technique during periods of momentum crashes in a developed market, and they concluded that it produces more significant returns than a basic momentum strategy during panic states of the market. Additionally, institutional investors are assumed to play a significant role in capital markets, primarily in developing economies. In this regard, it may be possible that market manipulation is done by institutional investors, not by individual investors, who may have a much less significant portion of investment in the capital market. Based on data availability in emerging markets, further research may look into the proportion of investments owned by individual and institutional investors in each country, particularly before and after each bubble. The contrarian approach examined short-term returns (usually 1–3 months) while disregarding long-term market adjustments or economic influences. Incorporating long-term contrarian strategy returns and some economic indicators in future studies may provide further insights.
Footnotes
Funding
The authors disclosed receipt of the following financial support for the research, authorship, and/or publication of this article: The authors wish to express their gratitude to the Faculty of Business and Economics, Universiti Malaya, for the support provided through the Special Publication Fund.
Declaration of Conflicting Interests
The authors declared no potential conflicts of interest with respect to the research, authorship, and/or publication of this article.
Data Availability Statement
Data sharing not applicable to this article as no datasets were generated or analyzed during the current study.