
Abstract
Industrialization in China has faced severe problems such as resource depletion and environmental degradation. The Yangtze River economic belt (YREB) strategy is one of the essential strategies for the sustainable development of the Chinese economy. Maximizing economic benefits while using the least resources and the least pollution to the environment is critical for China’s sustainable development strategy. This paper proposed the DEA to measure industrial eco-efficiency in the YREB from 2009 to 2018. It analyzed its temporal evolution and spatial differentiation and adopted a spatial econometric model to study how interference in influencing factors affects industrial eco-efficiency. The results revealed that (1) the eastern area of YREB has the highest industrial eco-efficiency compared with the other regions. (2) The industrial total factor productivity in the YREB has been rising over the years, and its change trend shows an inverted “W” pattern of first rising, then falling, then rising, then falling. (3) By further analysis, we observed a statistically significant spatial difference in the Industrial eco-efficiency among the areas in YREB, which suggests that the change scale presents the rule of “downstream bigger than Midstream region and midstream region bigger than “upstream region.” (4) The level of economic development, science and technology innovation, and human resources have significantly positive effects on industrial eco-efficiency, and the effect of economic development is of most significant importance. The industrial agglomeration demoted the efficiency of industrial ecology; Science and technology innovations, on the other hand, had a positive spillover effect, while the industrial concentration had a negative spillover effect.
Introduction
China’s fast industrialization and urbanization have led to the country’s rapid economic development. Covering nine provinces and two cities, the Yangtze River Basin plays a pivotal strategic role in shaping a new pattern of coordinated regional development in China and has become known as the Yangtze River Economic Belt (YREB). In 2018, the YREB’s GDP reached 40.3 trillion yuan, accounting for more than 43.84% of China’s total GDP. YREB’s economic achievement comes, however, at a high cost that has affected the ecological environment. Under the new “economic normal,” which emphasizes environmental priority, this issue consequently hampered China’s efforts in “sustainable development” and the implementation of major development strategies (Zhao & Liu, 2016). In this context, the industry has become a critical breakthrough and one of the essential points for achieving China’s energy conservation and emission reduction targets. As a country with vast territory, china’s regional economic development level exhibited significant differences; to a large extent, the development of the regional industry correspondingly reflects unbalanced (B. S. Liu et al., 2015). Meanwhile, these differences also influence the industrial eco-efficiency and its influencing factors. Analyzing the influencing factors and defining the differences among the regions in industry efficiency is essential for the effective allocation of resources and the strategy implementation of balanced regional development of YREB.
The concept of “eco-efficiency” is valuable for sustainable development analysis. The term refers to the empirically driven relationship between economic activities and environmental costs (Mickwitz et al., 2006). To date, prior researchers have made much of theoretical and practical achievements in the field of Data envelopment analysis (DEA) method application and eco-efficient indicators. However, the current studies have primarily focused on a specific eco-efficiency and typically addressed eco-efficiency at the corporate-level, region-level, or city-level. Most previous research on the industrial eco-efficiency of the YREB has only applied cross-sectional data rather than panel data in the analysis of industrial eco-efficiency efficiency measurement and the influencing factors. In contrast, the research on the spatial-temporal evolution of Eco-efficiency in the region is relatively minor.
To fill this gap in the prior literature, the study answers three critical questions: (1) how do we establish the industrial eco-efficiency indicators system and evaluate their performance? (2) Does the industrial eco-efficiency of the YREB change dynamically based on the spatial pattern? (3) What are the influencing factors that have resulted in the regional industry’s differences in the industrial efficiency? We addressed these questions by measuring and evaluating China’s ecological efficiency from the perspective of multi-dimensional variables (governmental policy, economic growth, environmental impact, technology, industry structure, and social humanities). We examined nine provinces (Jiangsu, Hunan, Zhejiang, Hubei, Sichuan, Anhui, Jiangxi, Yunnan, and Guizhou) and two cities (Shanghai and Chongqing) of the YREB. We first used the super-efficiency DEA method to measure the industrial eco-efficiency of the provinces with the published data in the China City Statistical Yearbook and China Energy Statistical Yearbook for the years from 2009 to 2018. We then used the Malmquist index to compare the dynamic contrast and decomposition of industrial eco-efficiency. Second, we identified the spatiotemporal variation of the comprehensive industrial eco-efficiency of the nine provinces and two cities. Finally, we established the Spatial Durbin Model to explore the industries’ spatial and temporal influencing factors of industrial ecology efficiency and analyze the eco-efficiency results of these cities during the period.
Our research contributes to the growing literature on “entrepreneurial ecosystems,” it aims to track the industrial eco-efficiency of the YREB’s development and explore and discuss the factors that influenced industrial eco-efficiency. Moreover, our research tries to offer practical implications for policymakers to provide theory and recommendations for the formulation of the local industrial development policies of YREB.
The organization of this study is as follows. In Section 2, we introduced the primary research method and data. In section 3, we measured the industrial eco-efficiency (IEO) of the YREB using the super-efficiency DEA model and analyzed its changes across regions. Section 4 shows the Spatial Durbin Model findings and the influencing factors’ effect. Finally, in section 5, we discuss our findings and conclusion.
Literature Review
Ecological efficiency was first proposed in 1990 and defined as the ratio of economic benefits to environmental losses in economic development and is usually used to measure the ecological efficiency of economic activities (Schaltegger & Sturm, 1990). And then, it was formalized by the World Business Council for Sustainable Development (WBCSD) report in 1992. Ecological efficiency emphasizes the synergy between economic development and environmental protection, aiming to minimize the negative environmental impact while developing the economy. The European Environment Agency (EEA, 2014) defines ecological efficiency as “creating greater welfare with the least natural input.” While improving the efficiency of resource utilization, environmental efficiency is also enhanced. Since ecological efficiency plays an increasingly significant role in measuring the efficiency of economic activity concerning natural resources and services, the related term has begun to receive increasing attention from the research community. Industrial eco-efficiency is derived from ecological efficiency. And it was understood as the ratio of the total amount of products produced by industrial enterprises in a particular region to the resource consumption and environmental cost (Gao et al., 2011). At present, scholars’ research on Industrial eco-efficiency mainly focuses on measuring and influencing factors.
Up-to-date, industrial eco-efficiency research mainly focuses on the measurement method, object, and evaluation perspective. First, the industrial eco-efficiency measurement objects refer to its evaluation of different industries or different regions. Kuosmanen and Kortelainen (2005) selected the Finnish transport industry as a research object and took the DEA technique to measure its ecological efficiency. Picazo-Tadeo et al. (2011) adopted the bootstrap-DEA model to estimate the eco-efficiency of Spanish agricultural enterprises and analyzed the influencing factors that will lead to agrarian eco-efficiency change. Helminen (2000) used the environmental impact index to measure the ecological efficiency of the paper industry in Finland and Sweden. R. B.Zhang et al. (2017) measured the industrial eco-efficiency of urban agglomeration in the Yangtze River Delta. The results show that: the average industrial eco-efficiency of this area is continuously increasing, and the absolute difference also increased, but the relative difference appears not very significant. Based on the DEA-Malmquist model, Yang (2020) calculates the industrial eco-efficiency of 31 provinces in China and puts forward the main influencing factors for China’s industrial efficiency. The results indicated that the noticeable regional differences of industrial eco-efficiency appeared at the provincial level. The industrial eco-efficiency in the eastern region is superior to the central and western areas.
Secondly, current scholars mainly adopt a ratio method (Meng et al., 2016), the index system method (Xie & Liu, 2016), the ecological footprint method (G. J. Li et al., 2005), the energy analysis method (Wang et al., 2008), and so on to measure the industrial eco-efficiency. Prior research widely applied the traditional Data envelopment analysis (DEA) in the field of efficiency evaluation. Still, the conventional DEA does not consider the influence of input and output slack variable defects. So the study adopted the super-efficiency DEA model to measure the industrial eco-efficiency of nine provinces and two cities in the Yangtze River Economic Belt from 2009 to 2018 to evaluate the development status of the Industrial eco-efficiency of the YREB more scientifically and reasonably. Finally, the current scholars have made many outstanding achievements from different lenses of industrial eco-efficiency evaluation. For example, some scholars explored the regional difference-based comparative analysis (J. Li et al., 2015) from static perspectives. Others analyzed spatiotemporal differences in regional industrial eco-efficiency and its dynamic evolution trends (Z. Zhang, 2020) from a dynamical perspective. Our research combines the two dimensions of time and space and integrated static and dynamic views to explore the characteristics and spatial differences of industrial eco-efficiency in YREB.
The current research methods concerning influencing factors of industrial eco-efficiency mainly involved multiple linear regression, the limited dependent variables model (Durbin), and the spatial panel regression techniques (Guan & Xu, 2016). The Tobit regression model is the most widely adopted by researchers; it is often used to test different countries (Díaz-Villavicencio et al., 2017; J. Zhang et al., 2016) and specific areas (Chen & Jia, 2017) eco-efficiency influencing factors. Besides the selected input-output indicators, the Industrial eco-efficiency is also affected by economic development, industrial structure, research and development(R&D) intensity, foreign direct investment(FDI), environmental regulation, and so on (Bhattarai & Hamig, 2001; Grossman & Krueger, 1994; H. Li et al., 2013;J. Zhang et al., 2016). Prior scholars put forward various views on this research domain: based on the measurement of industrial eco-efficiency of Xinjiang province in China, Zhou and Lv (2019) explored the relationship between Industrial eco-efficiency and economic development, scientific and technological innovation, industrial structure, and environmental regulation by using a regression model. Zhang and Liu (2019) adopted the three-stage DEA model to study the eco-efficiency of different industries in China. Then the effects of industry profit rate level, FDI, R&D input intensity, and market structure worked on the industrial eco-efficiency were discussed. X. L. Zhang et al. (2020) studied the spatial effect of fiscal decentralization, opening up, scientific and technological innovation, and industrial agglomeration, and explored their influence on industrial eco-efficiency. These prior research achievements indicate a linkage among industrial inputs, economic development, environmental performance, and social welfare.
YREB is one of China’s most strategic industries cluster regions, and its eco-development level is highly relevant to the process of China’s high-quality economic development. What’s more, it will affect the Industrial eco-efficiency of neighboring regions while affecting the local Industrial eco-efficiency. However, few types of research refer to the Industrial eco-efficiency of the Yangtze River Economic belt based on the lens of high-quality development; thus, our research has significant strategic importance to the YREB industry’s high-quality development.
Methodology and Data
Research Method
Super efficiency DEA model
Although the traditional DEA method has certain practicability, it still has defects. The range of measure values is commonly between 0 and 1.But when there are multiple decision-making units (DMUs), the situation that multiple measure values are 1 May occur. Scholars have postulated various improvement methods to remedy its defects: Banker and Gifford (1985) defined the concept of super efficiency. Andersen and Petersen (1993) improved the traditional DEA method before putting forward the super-efficiency DEA method. The super-efficiency DEA method moves back to the production front of the effective DMU. Under the condition that the efficiency value is unchanged, the input increases proportionally, and the increased ratio is the super-efficiency evaluation value. In this way, if the measured efficiency value is greater than 1, we will carry out further research on the effective decision-making unit with an efficiency value of 1. The production front is invariable for the invalid decision-making units, and the measured value is consistent with the traditional model. The production front is invariable for the invalid decision-making units, and the measured value is consistent with the traditional model. The super-efficiency DEA model is expressed as follows:

Where θ stands for the value of DMU; X and Y respectively represent the output and input set of the DMU. λj is the decision variable; S− represents the inputs’ slack variable; S+ indicates the outputs’ slack variable. When the θ < 1, it suggests that the DMU does not reach optimal efficiency. When the θ > 1 is present, the DMU achieves optimal efficiency.
Malmquist–Luenberger index model
Sten Malmquist (1953) first proposed the Malmquist index. Caves et al. (1982) applied the index to estimate the change in production efficiency in 1982, which attracted great attention in academia. Färe et al. (1994) combined this theory with the DEA in 1994, which can offer a better understanding of the composition of productivity. The Malmquist index can be expressed as follows:

Equation (2) can be divided into:

TFP represents the change degree of productivity of a DMU during the period of t ~ t + 1. When TFP > 1, productivity shows a rising trend; when TFP < 1, productivity shows a downward trend. The TFP is composed of integrated technical efficiency (EC) and technical progress (TC), among which integrated technical efficiency (EC) is composed of pure technical efficiency (PE) and scale efficiency (SE).
Spatial autocorrelation model
Spatial autocorrelation analysis is a spatial data analysis method used to estimate and analyze spatial dependency and heterogeneity among objects (Rey, 2001). Spatial autocorrelation was divided into global spatial autocorrelation and local spatial autocorrelation. The former describes the clustering degree of the attribute in the whole space, and the other further analyzes the clustering degree of specific local unit attributes and neighboring Spaces, commonly indicated by Moran’s I, taking values from −1 to 1. Global Moran’s I give a whole measurement of spatial autocorrelation, providing a formal indication of the degree of linear association between one unit and its neighbors. The global Moran’s I index is

Where I is the global Moran’s I index; n refers to the number of measurement regions; xi indicates the attribute value of region I; xi is the attribute value of region j; x indicate the mean value of attributes in each region, wij means space weight matrix, and the value range of Moran’s I index is [–1, 1], the sign of positive and negative indicates relevant attributes. In contrast the value of 0 indicates no spatial correlation. Statistic Z is used to test the significance level of Moran’s I:

In the equation: E(I)is the theoretical expectation; Var (I) indicates the theoretical variance.
The global autocorrelation assumes that the space is homogeneous and cannot reflect the local clustering characteristics. In contrast, the Local Moran’s I measure the degree of spatial autocorrelation at each specific location and is proportional to Global Moran’s I. The local spatial Correlation index (LISA) is a local form of Moran’s I index. The study uses LISA to analyze the agglomeration effect between districts and surrounding counties and find the aggregation point. Local Moran’s I index is

Where I indicates the province or city i “local Moran’s index; Zi refers to the ecological efficiency value of province or city i, and Zj represents the ecological efficiency value of the province and city j.
Durbin regression model
As we mentioned before, industrial eco-efficiency, which the super-efficiency DEA model calculated, will also be affected by various external factors apart from the influence of the selected input and output index. Based on the research perspective of the Chinese industry’s high-quality development evaluation index system, our research took regional industrial eco-efficiency as an explained variable. It adopted factors that may affect industrial eco-efficiency as the defined variable to establish a regression model, to explore the influence factors of Industrial eco-efficiency and the degree of the effect. The regression coefficient of explanatory variables judges the influence direction and intensity of the influencing factors on environmental efficiency. The regression model is as follows:

Where i represents the province; t represents the year; IEO it represents Industrial eco-efficiency; ρ represents the spatial autocorrelation coefficient; W represents the spatial weight matrix; Xit represents the influence factors; β and θ are the regression coefficients; λi represents individual fixed effects; µt represents time fixed effect; εit is the random error term.
Selection of Evaluation Indexes and Data Sources
Our research evaluates the Industrial eco-efficiency of nine provinces and two cities in the Yangtze River Economic Belt, using the panel data from 2009 to 2018. Each province or one of the two cities is considered a decision-making unit (DMU), including input and output variables. We selected the evaluation index of regional industrial ecology efficiency based on three aspects of resource factors, environmental factors, and economic factors. Therefore, the electricity consumption and waste gas, wastewater, and solid waste (environmental pollutants) were adopted as input index, and the industrial added value was used as output indicators. The study constructs the evaluation index system of Industrial eco-efficiency (see Table 1). We obtained Input-output index data from the China Statistical Yearbook (2010–2019) (National Bureau of Statistics of China, 2020), China Environmental Statistical Yearbook (2010–2019), and statistical Bulletins of national Economic and Social Development of provinces and cities (2009–2018) (National Bureau of Statistics of China, 2021) in relevant years, and supplement the rest of the vacancy values by the residual method.
Evaluation Index System of Industrial Eco-Efficiency.

When measuring the target region’s industrial eco-efficiency influencing factors, our research considers the relevant elements of China’s manufacturing industry’s high-quality development evaluation index system (Huang & Li, 2020). Also, it feels like previous studies of other scholars (Z. Zhang, 2020). We adopt six factors to analyze the impact of factor changes on Industrial eco-efficiency from six aspects: (1) Industrial agglomeration (IA). It was measured by the ratio of regional industrial added value to the national industrial added value and the proportion of regional GDP to the national GDP. (2) Environmental regulation(ER). It was expressed as the proportion of investment in GDP completed by industrial pollution control. (3) Level of economic development (LED). It was represented by per capita GDP. (4) Industrial structure (IS), the secondary industry in the proportion of GDP, is selected. (5) Scientific and technological innovation (STI), choose the ratio of R&D expenditure in GDP of each region. (6)Human capital (HC). It was calculated as follows: (primary school education number × 6 + secondary school education number × 9 + high school education number × 12 + junior college and above education number × 16)/total number. These six indexes have important practical significance for measuring the regional industry’s high-quality development and sustainable development.
Analysis of Empirical Results
Static Analysis of Industrial Eco-Efficiency
The results set out in Table 2 indicate the results of Industrial eco-efficiency values of provinces and cities in the Yangtze River Economic Belt from 2009 to 2018.
Industrial Eco-Efficiency Results of the YREB From 2009 to 2018.

Results show that, from the point of time scale, the industrial eco-efficiency of the YREB as a whole generally decreases after rising at first and then increasing, which depicts the “N” type of relatively stable development trend. From 2009 to 2015, the average of Industrial eco-efficiency DMU generally remained less than 1, which stays in the scale of diminishing returns stage. Since 2016, every DMU industrial eco-efficiency mean has become more significant than 1, which in the background of scale increasing returns, and the total average reaches 1.032. This result shows that although the industrial eco-efficiency of the YREB rose from 2009 to 2015, the overall level was still low. From the point of space dimension, the industrial eco-efficiency of Shanghai is 1.423, which is the highest value in the YREB. Its weight of industrial eco-efficiency remained more significant than others from 2009 to 2018, suggesting that the Shanghai industrial development level is higher than other regions in YREB. Then the Jiangsu province and Hunan province, Zhejiang province was ranked fourth. It is likely because the four areas stay in the critical industry transformation and upgrading period. The government implemented a more stringent environmental regulation policy, leading to a relatively slow speed of economic development. The bottom of the list is in Guizhou; the economic development level of Guizhou is relatively backward compared with other provinces of the eastern and middle part of YREB, leading to a big gap between Industrial eco-efficiency and other provinces and cities.
Firstly, due to the large gap in economic development levels among provinces and cities in the YREB, the overall level of Industrial eco-efficiency in the YREB is not high. Thus the general trend appears steady development, and the rising momentum is insignificant. Even though the YREB is undoubtedly one of China’s most economically developed regions, the development of some provinces and cities in this area’s upper and middle reaches is relatively backward.
With the advantages of superior geographical transportation, an excellent industrial base, and national strategic support, Shanghai has undoubtedly grown into the region with the highest level of economic development along the Yangtze River. The Industrial eco-efficiency is also in the first place. Also, Jiangsu and Hunan provinces are more ecologically efficient than other provinces due to their central transport arteries. To sum up, Figure 1 shows the evolution trend of Industrial eco-efficiency values in various provinces and cities in recent years has two significant features: first, it presents an overall trend of rising, specifically manifested as the transition from increasing return to decreasing return to scale; Secondly, there is a process of first increasing, then falling, and then increasing. The specific performance is as follows: from 2009 to 2011, it was in the stage of continuous growth; from 2012 to 2015, it started to decline; in 2016, it picked up, but the recovery trend is not apparent.
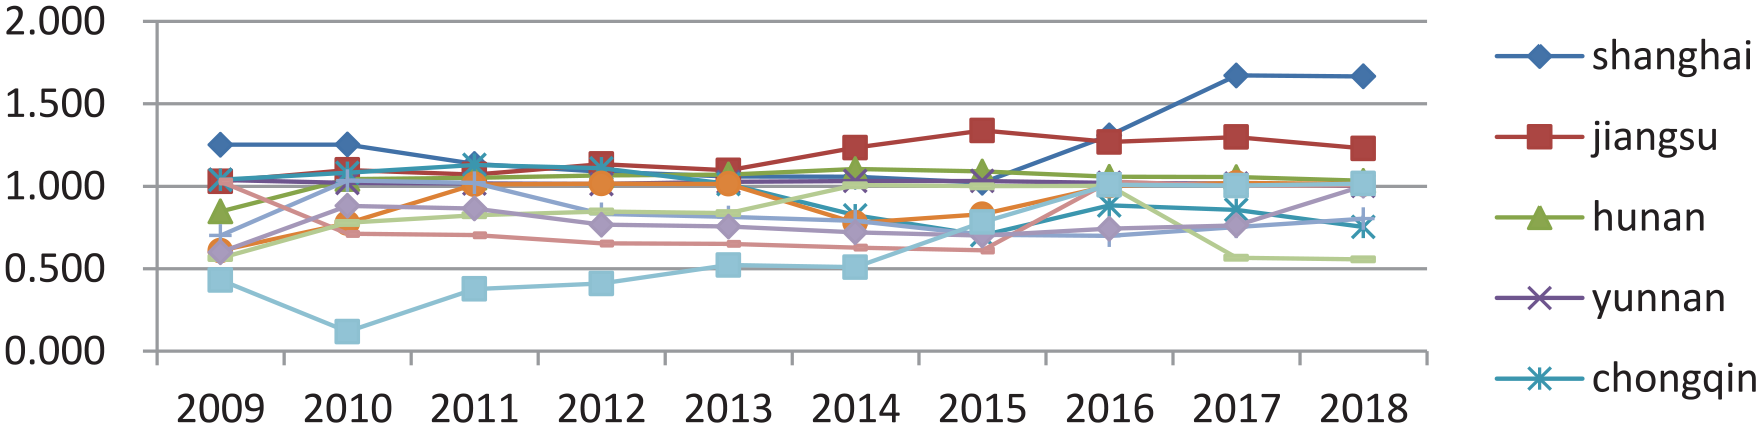
The industrial eco-efficiency index change trend in YREB from 2009 to 2018.
Secondly, significant differences exist in the industrial eco-efficiency among different regions of the YREB. To analyze and judge the needs for industrial eco-efficiency changes and regional differences in YREB, we divided the YREB into the lower, middle, and upper reaches. The upper reaches include Sichuan, Guizhou, Chongqing, and Yunnan; the middle includes Anhui, Jiangxi, Hunan, and Hubei, a total of four provinces; and the lower reaches include Shanghai, Jiangsu, and Zhejiang. Figure 2 reveals that the average industrial eco-efficiency is .852, .923, and 1.092 respectively in YREB, the highest in the lower reaches, followed by the weakest in the middle and upper reaches, showing a tremendous regional difference. We believe the reasons for the above phenomena are closely related to the regional level of economic development, factor endowment, location advantage, and social development level. As we mentioned above, the lower reaches of the Yangtze River, which is located along the eastern coast, is in the forefront area of China’s opening, so its geography position is relatively superior. It is helpful to absorb foreign advanced technology, and the transformation process undertook more smoothly, so resource consumption and pollution emissions in industrial production are relatively small. The middle reaches provinces are inland areas, so they do not have enough advantages to attract foreign investment compared with the lower reaches. Additionally, they encountered severe problems, such as a weak foundation of the economy, relatively backward production technology, low independent innovation ability, and low environmental protection. Its economic development was affected by the severe long-term prevalence of local protectionism, which even led to market segmentation. Consequently, its production factors cannot integrate with advanced technology effectively than to achieve cross-regional cooperation, so they paid a high price for resource consumption and environmental damage during industrial growth. Consequently, its production factors cannot integrate with advanced technology effectively than to achieve cross-regional cooperation, so they paid a high price for resource consumption and environmental damage during industrial growth.

The average industrial eco-efficiency change trend in YREB, 2009 to 2018.
Thirdly, there exist significant inter-provincial differences in the Industrial eco-efficiency of the YREB, and the economic development level of each province is in direct proportion to the Industrial eco-efficiency. Table 2 lists the Industrial eco-efficiency levels of the provinces and cities in the Yangtze River Economic Belt. The average industrial eco-efficiency of Shanghai, Jiangsu, and Hunan is greater than 1, while that of other provinces is less than 1. And the level of economic development is closely related to Industrial eco-efficiency. Among them, Yunnan and Guizhou are the regions with a low level of economic growth, and their Industrial eco-efficiency is also at the bottom.
Dynamic Analysis of Industrial Eco-Efficiency
According to equation (2) analysis, the Malmquist index model can decompose the Industrial eco-efficiency into five indicators: comprehensive technical efficiency, technical progress, pure technical efficiency, scale efficiency, and total factor productivity. Table 3 shows the Malmquist index decomposition results of Industrial eco-efficiency. Table 4 shows the Malmquist index decomposition of the average Industrial eco-efficiency of YREB each year. Except for Zhejiang, Jiangxi, and Chongqing, Table 3 indicates the total factor productivity of other provinces and cities is greater than 1, and the average total factor productivity is 2.86%. The US financial crisis of 2008 greatly influenced the domestic economy, so the growth step of YREB has slowed. Due to the government’s fiscal policy, the YREB promoted the urbanization and industrialization process. Meanwhile, YREB enhanced regional synergies and finally boosted the steps of high-quality economic development.
Malmquist Index Decomposition of the Average Annual Industrial Eco-Efficiency of YREB, 2009 to 2018.

Malmquist Index Decomposition of the Average Industrial Eco-Efficiency.

But it is noteworthy that the industrial total factor productivity changes varied among the 11 provinces and cities in YREB. The industrial total factor productivity of Shanghai, Jiangsu, Anhui, Hubei, Hunan, Sichuan, Guizhou, and Yunnan are more significant than 1; it indicates that the industrial total factor productivity has improved. While the industrial total factor productivity of Zhejiang, Jiangxi, and Chongqing is less than 1, it explains its industrial total factor productivity fell. To sum up, the industrial development level of all provinces and cities in the region is highly uneven, and the economic development level needs to be further improved. This paper further analyzes the regional differences in total factor productivity of industries in YREB and finds that the variation in rules of total factor productivity of industrial provinces and cities along the YREB appear as “downstream regions better than Midstream region, while the upstream region appears lowest.” Precisely, the industry averages of total factor productivity in the upstream region are 1.005, and the value is 1.023 for the middle area, while it reaches 1.033 downstream.
So, compared with other regions, it shows that downstream development tends to be more balanced between industrial and resource environments. Still, the industrial development of the upstream region shows a bit more imbalances in resources and environmental issues. Therefore, from another perspective, the higher the level of economic growth, the higher the industrial total factor productivity.
Table 4 list the total factor productivity (TFP) of the YREB; the results show it has been on the rise over the years, except for the two intervals of 2009 to 2010 and 2010 to 2011, which are less than 1; the rest of the zones are all greater than 1. The changing trend shows an inverted “W” pattern of rising, falling, and rising (see Figure 3). It indicates that the environmental pollution caused by industrial production has, to a certain extent, inhibited the improvement of a total industrial factor in all provinces and cities of the YREB. Therefore, the Yangtze River Economic Belt needs to strengthen environmental protection while improving industrial total factor productivity. Overall, the Yangtze River Economic Belt has been one of China’s critical industrial development areas, with its gross industrial product accounting for nearly half of the national total. Still, we knew that the Yangtze River Economic Belt sacrificed the environment in the past at the cost of rapid economic development, limiting the region’s environmental bearing capacity (Figure 4).
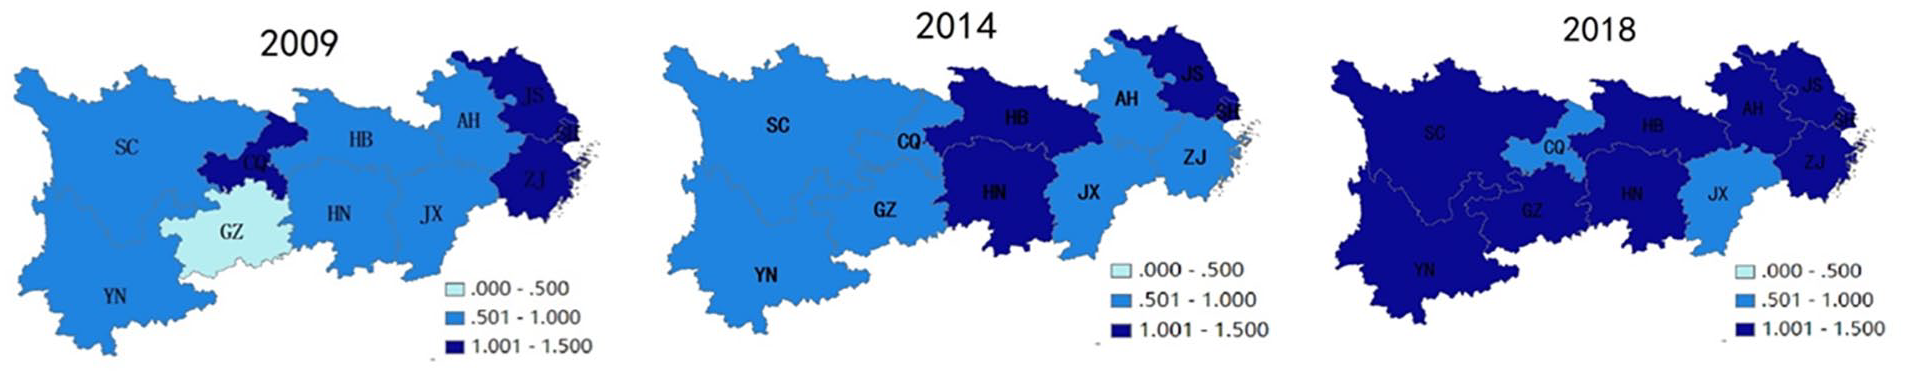
Spatiotemporal patterns of industrial eco-efficiency average of YREB.

The variation trend of Malmquist index of industrial eco-efficiency.
Spatial Autocorrelation Analysis
Global spatial autocorrelation
Based on the industrial eco-efficiency of the YREB from 2009 to 2018, the study calculated the Moran’s I index by Geoda based on the first-order Queen Space matrix. Table 5 shows that the global Moran’s I index of YREB the Industrial eco-efficiency from 2009 to 2018 is positive; the values range from 0.177 to 0.278. The result indicates that the Industrial eco-efficiency of YREB has a global spatial agglomeration effect, and the symptom of Moran’s I index is a “W” shape. It suggests that the agglomeration degree of the 11 provinces and cities’ industrial ecology efficiency in YREB fluctuated over time.
Local Moran’s I index of Industrial Eco-Efficiency of YREB, 2009 to 2018.

Local spatial autocorrelation
To examine industrial eco-efficiency considering spatial effects, we applied Local Moran’s I. from 2010 to 2018. The Moran scatterplots of targeted provinces and cities’ eco-efficiency in 2010, 2014, and 2018 are shown in Figure 5. These figures describe the local spatial correlation of industrial eco-efficiency geographically. Provinces and cities of YREB located in the HH clusters are mainly concentrated in the east, such as Shanghai, Jiangsu, and Zhejiang, indicating a relatively positive spatial autocorrelation. With time, spatially, the HH (high-high) clusters generally appeared in the low and middle streams, while the LL (low-low) groups were mainly in the upper stream, such as Guizhou and Yunnan provinces. The figure depicts that the eastern and western regions show similar spatial correlation (“high-high” and “low-low”), which indicates that the areas and cities of the Yangtze River Economic Belt show solid spatial dependence.

Local Moran’s I scatter graphs of industrial eco-efficiency.
Factors Influencing Eco-Efficiency
Unit root test
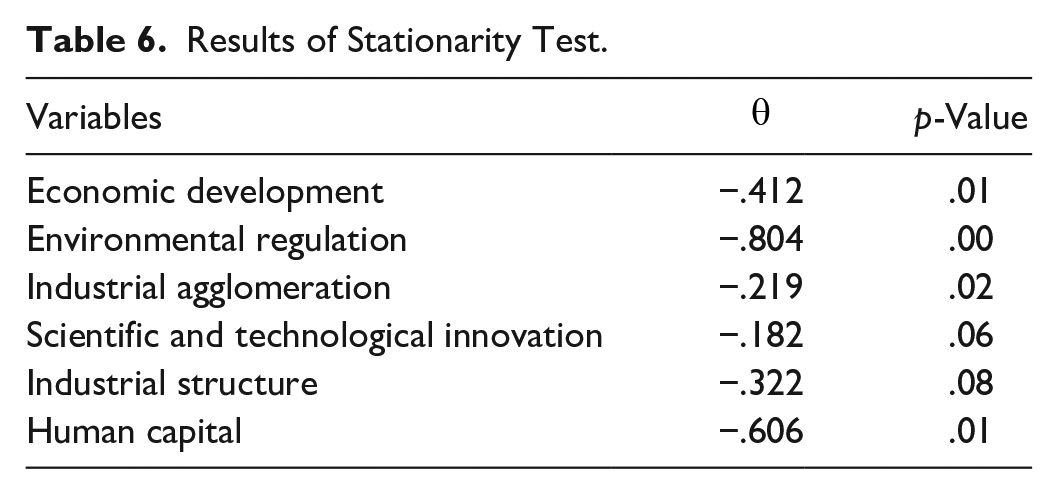
To avoid pseudo-regression and improve the credibility of regression results, it is necessary to carry out a stationarity test for each variable. The method of the Standard panel unit root test includes the IPS test (Im et al., 2003), Breitung test (Breitung, 2001), MW test (Maddala & Wu, 1999), etc., but the above methods do not apply to this study. Since we use the panel data of areas in YREB from 2009 to 2018 in this paper, we adopted the panel unit root (Levin et al., 2002) test to judge the stationarity of variables (Tables 6 and 7).
Results of Stationarity Test.
Spatial Dupin Model Test Results.

The selection of spatial econometric model
Spatial econometric models include the spatial error model, spatial lag model, and spatial Durbin model. Based on the results of the Hausman test, the fixed-effect model is superior to the random effect model and the Wald and LR test results respectively reject the original model. Therefore, this paper finally chooses the spatial Dubin model to explain the spillover effect of environmental regulation and technological innovation on the high-quality development of the manufacturing industry and simultaneously controls the time and individual.
Spatial Dubin model regression analysis
Table 8 shows the spatial regression results of equation (7). It indicates that the spatial autocorrelation coefficients of China’s IEO under the assumption of the two spatial weight matrices are all less than zero. And both the geographical proximity matrix and geographical distance matrix pass the significance level test of 5%, suggesting a noticeable siphon effect in China’s IEO. That is, the IEO of a province is negatively affected by the IEO of neighboring regions. The general regression coefficients of the economic development level passed the significance test under the assumption of the two spatial weight matrices. And the regression coefficients were .012 and .022, respectively, indicating that the level of economic development has a direct positive effect on the industrial ecological efficiency in the geographical proximity matrix and geographical distance matrix.
Spatial Dubin Model Regression Results.

, **, and *** are significant at the levels of 10%, 5%, and 1%, respectively.
Z. Zhang (2020) believes that the impact of economic development level on industrial ecological efficiency is mainly manifested in two aspects: on the one hand, the traditional extensive development pattern not only brings rapid development of GDP but also leads to the massive consumption of fossil energy. As such, the environmental cost of economic development keeps increasing and the characteristics of high energy consumption are significant; On the other hand, with the continuous development of the economy, new energy and energy-saving technologies are emerging, and the negative environmental externalities in the early stage of development are gradually offset.
From the existing regression results, the positive effect of economic development has been entirely appearing due to the government’s continuous incentive policies. These policies encourage enterprises to improve energy saving and environmental protection technologies in the production process through research and technological transformation and provide a prerequisite for enhancing IEO. The general regression coefficient of environmental regulation fails to pass the significance test under the two spatial weight matrix assumptions, which indicates that environmental law has a weak impact on IEO. It differs from the research results of Jiang Shuoliang et al., who believe that environmental regulation significantly affects industrial ecology. The main reason may be that the policies related to industrial pollution control and ecological law led by the government have not been effectively implemented, leading to the failure of environmental regulation.
The general regression coefficient of industrial agglomeration passed the significance test under the assumption of two spatial weight matrices. It shows that industrial agglomeration directly inhibits IEO in the geographical proximity matrix and geographical distance matrix. Industrial agglomeration is the inevitable choice of industrial development. The technology spillover effect between industries at the initial aggregation stage brings new cooperation opportunities for enterprises. Urbanization and good infrastructure attract a large number of enterprises to agglomerate. However, with the continuous expansion of agglomeration, problems such as resource shortage and environmental pollution are becoming increasingly severe. The impact of industrial agglomeration on IEO changes from promoting to inhibiting.
The general regression coefficient of technological innovation level passed the significance test under the assumption of two spatial weight matrices, which indicates that technical innovation level has a direct promoting effect on IEO in the geographical proximity matrix and geographical distance matrix. The general regression coefficient of industrial structure fails to pass the significance test under the two spatial weight matrix assumptions, which indicates that industrial facility has a weak impact on industrial ecological efficiency. The general regression coefficient of human capital passed the significance test under the assumption of two spatial weight matrices, which shows that human capital has a direct promoting effect on industrial ecological efficiency in the geographical proximity matrix and geographical distance matrix.
Spatial spillover effect decomposition
Because the coefficients of the SDM model do not directly reflect the marginal effects of the corresponding explanatory variables on the dependent variable (LeSage & Pace, 2010), it needs to verify spatial results from the total impact, the direct effects, and indirect effect (Table 9). As indicated in Table 9 show, the full impact of economic development and scientific and technological innovation is positive. They are both a vital driving force to promote the improvement of industrial eco-efficiency in various regions. The direct effect of economic development and scientific and technological innovation is significant, and economic growth’s immediate effect value is the highest. Still, industrial agglomeration is the main reason to restrain the improvement of Industrial eco-efficiency in YREB. The indirect effect of scientific and technological innovation is significantly positive, indicating a positive external spillover effect. The indirect effect of industrial agglomeration is negative, showing a negative external spillover effect. It is noteworthy that the impact of environmental regulation and industry structure is not significant for industry eco-efficiency.
Spillover Effect Decomposition Results of Spatial Dubin Model.

Note: The t-test value is in parentheses.
, **, and *** are significant at the levels of 10%, 5%, and 1%, respectively.
The significant positive direct effect and the total effect of the economic development level indicate that the industrial eco-efficiency level increases with the improvement of the financial status. The economic development level can significantly improve the essential quality, technical level of local staff, and local infrastructure environment, contributing to industrial eco-efficiency. However, the insignificant indirect effect of economic development proposes that its promotion effect on the Industrial eco-efficiency of adjacent areas was limited, which again verified the viewpoints of prior researchers (X. L. Zhang et al., 2020). Therefore, it is of great significance to enhance regional industrial eco-efficiency to strengthen regional cooperation and communication, promote the development of backward areas with developed areas, and jointly improve economic growth.
The direct and total effects of industrial agglomeration are significantly adverse. Some prior research shows that industrial agglomeration has a “siphon effect” and negative externality of the Environment (Sun et al., 2018), which can attract investment, technology, talents, and other resource elements in neighboring regions, and then lead to the decline of Industrial eco-efficiency in this region (Peng et al., 2020; Ren et al., 2018). So the industrial agglomeration negatively affects the Industrial eco-efficiency of this region. Therefore, to avoid the negative impact of industrial accumulation on Industrial eco-efficiency, the government should make a reasonable plan to accumulate relevant enterprises in a particular area.
All the effects of scientific and technological innovation are significantly positive. The enhancement and improvement of scientific and technical innovation capacity are conducive to accelerating industrial transformation and upgrading. Advanced technology can improve resource utilization efficiency and reduce environmental pollutant emission; what’s more, it can enhance environmental governance capacity. From the empirical results, we know that scientific and technological innovation promotes the improvement of Industrial eco-efficiency in the targeted region and promotes the advancement of Industrial eco-efficiency in neighboring areas; it indicates that it has a positive spatial spillover effect. Therefore, enhancing the ability of scientific and technological innovation plays a vital role in improving Industrial eco-efficiency.
The positive effect of human capital shows that it significantly promotes the improvement of industrial ecology. The reason lies in that the progress of human capital provides academic support for improving scientific and technological innovation ability, speeds up industrial transformation and upgrading process, and reduces industrial pollution emission. At the same time, it enhances the production efficiency of industrial enterprises. It reduces their production costs conducive to improving enterprise profits and promotes the coordination between economic development and environmental protection of YREB. Additionally, the positive indirect effect result shows that the higher the level of human capital in a particular area, the more promising it is to promote the progress of Industrial eco-efficiency in neighboring provinces.
Industrial structure and environmental regulation do not pass the significance test. Commonly speaking, the more significant the proportion of the heavy industry, the more pollutants discharged, and the more serious the pollution happens to the environment. However, the effect of industrial structure is not significant, which is consistent with the view of most scholars (J. Liu, 2015; Lu & Yuan, 2017). It is likely due to the reason that heavy industry creates great economic value while causing significant environmental pollution. So, to some extent, the two cancel out. Additionally, environmental regulation has not passed the test of significance. It shows that our research keeps consistent with prior research (S. L. Li et al., 2014; H. F. Zhang et al., 2009). The possible reason is that the government-driven industrial pollution control policies and measures have not been effectively implemented, leading to the failure of environmental regulation. Therefore, the environmental regulation can’t effectively correct the production behavior to bring negative externalities to the ecological environment.
Conclusions and Discussion
This study used the super-efficiency DEA model with Moran’s I index to measure the Industrial eco-efficiency in the YREB from 2009 to 2018. We draw the following conclusions: firstly, From the perspective of spatial dimension, the average Industrial eco-efficiency of all provinces and cities in the Yangtze River Economic Belt presents a relatively stable development trend of the “N” type, which rises first, then declines, and then rises within a small range; Individually, the average industrial eco-efficiency of Shanghai, Jiangsu, Hunan, and Yunnan is greater than 1, while that of other provinces and cities is less than 1. secondly, From the perspective of the time dimension, the total factor productivity of the YREB has been staying the rising trend on the whole over the years, except for the two intervals of 2009 to 2010 and 2010 to 2011, which are less than 1, the rest of the intervals are all greater than 1. The changing trend of the total factor productivity of the Yangtze River Economic Belt shows an inverted “W” pattern of first rising, then falling, then rising. From an individual perspective, except for Zhejiang, Jiangxi, and Chongqing, the total factor productivity of other provinces and cities is greater than 1. Further analysis of regional differences in total factor productivity of provinces and cities along the YREB reveals that the variation pattern presents “downstream regions better than Midstream, and midstream better than upstream region.”
The spatial econometric of SDM analysis indicates that the total effect of economic development, scientific and technological innovation, and human capital is positive, which is a vital driving force in promoting the overall regional Industrial eco-efficiency improvement. Among them, the direct effect value of economic development is the highest. However, industrial agglomeration harms the advancement of Industrial eco-efficiency; it indicates that is the main factor that inhibits the improvement of Industrial eco-efficiency in this region. Scientific and technological innovation has a positive external spillover effect, while Industrial agglomeration has a negative impact.
Discussion
This study raised several implications based on theoretical and empirical analysis with solid practical significance at the policy level. First, considering the significant spatial difference of industrial eco-efficiency in the targeted region, we need to provide and adopt different measures to improve the industrial eco-efficiency for other areas of YREB. For upper reaches regions with relatively high industrial eco-efficiency, it should implement an industrial green development policy; strengthen the crucial role of science and technology innovation in industry. For the middle reaches, it should support the weak spots of industry, arrange the appropriate transfer of Mature industries to the upper reaches, and promote the region’s dislocation development and coordinated development (Yang, 2020). For the downstream areas with relatively backward Industrial eco-efficiency, the government should explore a more suitable industrial development mode based on regional resource endowment and re-planning.
Our results show that there exists the spatial spillover effect of industrial eco-efficiency. It is not only affected by local factors but also affected by other regional factors. So, we suggest the government make a reasonable plan for the influencing factors in this region and consider the influences of different elements in neighboring regions when formulating relevant countermeasures and suggestions. First, we suggest using the multi-indicator assessment mechanism for local governments. The criteria for assessing local government performance from the viewpoint of “GDP only” need to be changed radically. Secondly, giving full play to the potential of science and technology to improve Industrial eco-efficiency, promoting local governments and enterprises to increase investment in science and technology, and strengthening scientific and technological cooperation among various regions are urgent. Thirdly, because the increase of industrial aggregation is not conducive to adjacent areas to promote the efficiency of industrial ecology, the government should adopt reasonable plans and policies to guide local industries transferring in different regions. It can help prevent the high regional industry aggregation spillover effects caused by the negative spatial effect. Therefore, it is of great practical significance to form reasonable regional industry aggregation, reduce the negative impact on other areas, and promote industrial ecology’s efficiency with the adjacent room.
With the deepening of the research, the studies of IEO are not limited to the measurement evaluation, influence factors of research. Improving the coordinated development level of the IEO, economic growth, and ecological civilization construction will be the future direction of the study, that is, whether there is a coupling relationship among them and how the synergy degree is a valuable and exciting topic in our further research.
Footnotes
Declaration of Conflicting Interests
The author(s) declared no potential conflicts of interest with respect to the research, authorship, and/or publication of this article.
Funding
The author(s) received no financial support for the research, authorship, and/or publication of this article.