
Abstract
Beer is popular worldwide and it is considered the oldest and most consumed alcoholic beverage in the world. At the global production level, most of the market is dominated by a few multinational companies, but in recent years, craft beers have gained market share. In addition to being independent and produced on a smaller scale, the main characteristic of craft breweries is their broad differentiation capacity, attracting consumers who demand products that are more committed to sustainability and the environment, as well as being willing to pay higher prices for goods in line with their life philosophy. Their great popularity aroused the interest of researchers throughout the world, leading to the proliferation of a large number of scientific articles that address the production and consumption of craft beer. This research aims to identify and analyze the scientific production that addresses Craft Beer. A bibliometric analysis is used as the methodology to obtain the following information regarding the subject over the years: growth and coverage, article citations (quality indicator), the most relevant authors, etc., which will be useful information for researchers. The two main international databases, WoS and Scopus are used for document tracking and 137 articles are identified. The results show that this is a recent area of study, since researchers only started showing interest in the subject in 2015; 90% of the documents have been published in the last 5 years. Most of the authors are transient with a single authorship, so the production is low (productivity index 1.18). Therefore, the study area is incipient and is considered of great potential for researchers.
Introduction
The popularity of beer is worldwide and is considered the most consumed alcoholic beverage in the world (Piron & Poelmans, 2016). It is made from water, cereal, hops, and yeast, and the brewing techniques and styles have changed over the years (Hornsey, 2003). Thanks to the Industrialization that took place during the 19th and 20th centuries, beer refining experienced a great boom and little by little large beer companies began to dominate the market. According to Swinnen and Garavaglia (2018), there are several factors that led to strengthening this industry worldwide: an increase in production and a decrease in manufacturing costs by using innovative manufacturing methods, which results in maximizing profits. All these factors resulted in oligopolies emerging in many markets.
At the global production level, a few multinational companies share most of the market. Neverthless, in the last few years, independent craft beers have steadily gained market share, both in areas where the brewing industry had a strong influence and in those where there was no established tradition. These breweries which have a craft approach and were at the beginning very few and geographically isolated, are achieving the transformation of the global brewing industry.
The terms “craft brewery,” “microbrewery,” “independent brewery,” “specialized brewery,” and “local brewery” define small companies producing traditional beer, which are independent of large multinationals (Garavaglia & Swinnen, 2017). Production does not exceed six million barrels of beer per year, using non-traditional ingredients with innovative fermentations (Fish, 2015), which enable them to have a broad differentiation capacity (flavor, production techniques, etc.; Biancolillo et al., 2014), attracting young adult consumers who demand products that are more committed to sustainability and the environment, which they are willing to pay higher prices for, as they are goods in line with their philosophy of life (Holtkamp et al., 2016).
This boom in craft beer was reflected by the emergence of a large number of research papers that delve into both the demand and supply side. Due to the proliferation of articles, an analysis of the published academic literature is required, whose aim is to synthesize existing knowledge in a reproducible way (Tranfield et al., 2003) and predict research trends (Bornmann & Mutz, 2015; Fahimnia et al., 2015).
Within this context, the aim of this document is to obtain a clear picture of current research on Craft Beer from the academic literature indexed in the international databases Web of Science (WoS) and Scopus and answer the following research questions:
Q1. How did scientific production evolve in this scientific field?
Q2. Who are the authors with the greatest production and the most cited? What are the most cited documents?
Q3. What are the magazines that have the highest frequency of articles on the subject?
Q4. Which countries are concerned about the issue?
The methodology applied to the identified scientific literature is bibliometrics, part of scientometrics, and its bibliometric indicators in order to study and analyze scientific activity. The novelty of the research is that there is no compilation work of the scientific production of these characteristics on the subject under study (all scientific areas are addressed). In this sense, Nave et al. (2021) carried out an investigation on the subject, this being very interesting but different, it is a bibliographical analysis of the production on the research carried out on “craft beer” and limited to the scientific area of Economic and Business Sciences. The bibliometric analysis applies mathematical and statistical methods, providing objective results, which allow identifying the annual growth of production, productivity, most productive authors, main journals selected by the authors for the publishing their research, to observe trends and areas of research in development or regression, as well as scientific approaches or areas not yet studied. The aim of this analysis is to guide researchers in their future work exploring the intellectual structure of a specific domain in the existing literature (Verma & Gustafsson, 2020).
With a view on these objectives, this article is divided into four main sections. First, and after the introduction, the theoretical framework of the research is established. It is followed by Section 3 in which the methodology is discussed; bibliometric analysis and its methodological scheme, together with the tracking strategy of scientific documents. The main results are shown and discussed in the next section; Basic bibliometric indicators and overlap and singularity analysis between WoS and Scopus. Finally, the main conclusions are collected and the limitations of the research are presented in the last section.
Theoretical Framework
The manufacture of craft beer is not a new phenomenon, as it has its roots in history. However, its resurgence as a new market segment is recent. Thus, the so-called “craft beer revolution” originated in the 1980s on the west coast of the USA and quickly spread to the rest of the country (Schnell & Reese, 2003). After that, it spread to other areas such as Europe (Danson et al., 2015), South America (Toro-Gonzales, 2015), or Australia (Argent, 2018).
The emergence and revolution involved in the appearance of this new product “craft beer” is based on the segmentation phenomenon within an industry in the maturity phase and is explained by the resource partition model (Carroll et al., 2002). This model states that those industries that advance toward an oligopolistic structure produce an increasingly homogeneous product and therefore, depend on achieving economies of scale in production, marketing, and distribution in order to be successful (Freeman & Hannan, 1983). In addition, the oligopolistic structure favors the emergence of market niches that can be developed by small entrepreneurs which are capable of innovation (Freeman & Hannan, 1983). In this regard, the result obtained in the research by Carroll and Swaminathan (2000) is that there is a statistically significant relationship between an increasing concentration of the brewing industry and an increase in the entry rate of new smaller sized enterprises.
Within this context of the brewing industry, the progressive homogenization of the final product, caused by decades of dominance by large companies, provided the opportunity to open a market niche for small breweries free from the predominant control in the sector (Wojtyra, 2020). Existing market niche in the so-called “competitive range” (Caves & Porter, 1977) in which competitiveness is not only based on the price level, but also on skills such as innovation and quality, which are both competitive factors that enable to increase the ability to adapt to the customer’s needs (Zucchella & Palamara, 2007). On the other hand, traditional beer producers continued to consider that the most determining factor when consuming beer is “affordability,” especially “in countries with medium-low per capita income, where faster economic growth increases the consumption capacity” (Blecher et al., 2018).
In this change from an oligopoly that supplies a homogeneous product to a highly diversified and more competitive production (Ogle, 2007), the evolution in the demand of tastes and preferences (Aquilani et al., 2015) plays a significant role, as well as its eventual entry into production (Fastigi & Cavanaugh, 2017). In recent years, the behavior of beer consumers has undergone a significant change, as they have developed more sophisticated drinking habits and demanded a higher quality of the final product. This “new” segment gives greater importance to the characteristics and quality of the ingredients used in its preparation, so the consumer is willing to pay a higher price than the conventional market price for these differentiated products (D. W. Murray & O’Neill, 2012). In this way, the expansion of the sector may be partly due to the appearance of passionate consumers of craft beer, who initially decide to make it themselves and later start their own micro-enterprises (Fastigi & Cavanaugh, 2017).
Craft brewers become small businesses whose hallmark is the incorporation of innovative ingredients and production methods into current historical styles, maintaining their integrity and overall independence, free from the interests of larger, and more commercial companies (Brewers Association, 2017). Every year a greater number of new craft beers appear in the market, emerging the so-called hyperdifferentiation phenomenon defined as the growing recognition of being truly different and where prices lose their importance as the main factor in customer choice between alternative goods and services (Wojtyra, 2020). Craft beer is a highly diversified product, in which producers seek to design a product that satisfies a small group of consumers, instead of developing a medium-quality product (Clemons et al., 2006). This situation contrasts with the strategy of large companies, whose products must attract as many consumers as possible.
Regarding the craft beer consumer’s motivations, they are caused by three noteworthy factors (Pokrivčák et al., 2019): a new taste experience, desire for more knowledge, and moving away from the consumption of conventional beer. Currently the consumers are changing, they are connected instead of being isolated, better informed, and active compared to the passive attitude which they showed several years ago (Prahalad & Ramaswamy, 2004). Partly motivated by an environmental awareness, consumers are increasingly showing an interest in regional products, made with traditional methods and local ingredients, and with a wide range of new flavors and aromas (Mastanjević et al., 2019).
As stated by Bourdieu (1984), product consumption is often indicative of social distinction. The consumption of a particular food or drink has become a form of expression of consumer identity (Blaiech et al., 2013). In this regard, it seems significant that the Millennials plays a predominant role in the popularity and diffusion of craft beer in a large number of countries by valuing those products that reflect their generation (Holtkamp et al., 2016). They are among the most committed buyers to sustainability and the environment, willing to pay higher prices for goods in line with their philosophy of life (Holtkamp et al., 2016). Another factor to be taken into account when observing the rapid expansion of craft beer consumption is the Internet, especially social networks, as they become the main media of craft breweries for client-users of these new media (Reid et al., 2014).
The development of craft beer is supported by other factors, which are: the globalization of economies and lifestyles, together with the so-called neolocalism. This new phenomenon, according to Schnell and Reese (2003), “involves returning to traditions, local products, traditional production methods and the conscious effort of companies to promote a relationship with a given environment in an attempt to create a new sense of place” (p. 47). Neolocalism manifests itself “in the craft beer industry, mainly through a marketing strategy that uses names and symbols that refer to the locality, geography, the history of the place and its characteristics” (Schnell & Reese, 2003) or by using local ingredients (Garavaglia, 2020). The aim of this strategy is for consumers to drink craft beer, which is also locally manufactured, so they can feel as if they are an important part of their community. For Schnell and Reese (2003), these consumers do not drink a brand, but a concept that is usually the connection with a place.
Methodology
As already mentioned in the previous section, to fulfill the proposed objective, Bibliometrics will be applied; it is an interdisciplinary science whose objective is the descriptive/quantitative analysis of bibliographic data obtained from a set of scientific documents by using statistical and mathematical tools (Broadus, 1987). According to Nicholas and Ritchie (1978), this analysis provides an overview of a specific research area through the application of a set of bibliometric indicators.
The starting point of the bibliometric analysis is to develop a mind map with the aim of outlining the stages to be followed in the process of systematic search for the scientific documentation to be analyzed for this research, which is an analysis focused on Craft Beer (Rowley & Slack, 2004). For the screening process, the guidelines of the PRISMA method (Preferred Reporting Items for Systematic Reviews and Meta-Analyzes; Zhang et al., 2017) were used. All studies that were systematic reviews or meta-analyses related to “craft beer” were included. The duplicate documents were eliminated following the exclusion criteria, eligibility was evaluated, discarding those documents with unidentified bibliometrics and those not specifically related to the thematic focus of the study (Zupic & Čater, 2015).
As known, access to the entire scientific production is an impossible goal to achieve, for this reason the bibliometric analysis “is limited by the availability, relevance and reliability of the information handled” (Rueda et al, 2007, p. 2906). Therefore, after identifying the study area, it is necessary to establish the time period for the analysis and select the database where the process of tracking the scientific documents under study will be carried out. This last step is very important, since according to Norris and Oppenheim (2007), the appropriate choice of the database (national or international, generic, or specialized), depending on the subject under study, will largely determine the validity of the results obtained.
In this research, whose objective is to identify articles that deal with the Craft Beer subject from different approaches and disciplines, in order to track documents, the two main international databases of bibliographic references and citations of periodical publications were selected, Web of Science (WoS) and Scopus, both of a multi and interdisciplinary nature. Parallel to the bibliometric analysis, a comparative analysis was carried out between both databases from the perspective of their coverage, in order to identify which of them provides better coverage of the “Craft Beer” subject (Álvarez-García et al., 2018; Meho & Rogers, 2008).
Following the methodological process established in Figure 1, the next step is to establish the search criteria: search word = craft beer, document type = journal article, period time = year of publication ≤ 2019, language = English, search date = July 2020. Next, the search terms were selected in order to track scientific documents in journals classified within all subject areas. Following this search strategy, it is carried out as thoroughly as possible (Corral & Canoves, 2013).

Methodological process stages (bibliometric analysis focused on craft beer).
WoS: (Main Collection) TITLE: (“craft beer*” OR (“craft brew*”) Refined by: TYPES OF DOCUMENTS: (ARTICLE) AND LANGUAGES: (ENGLISH) AND [excluding] YEARS OF PUBLICATION: ( 2020)
Scopus: (TITLE (“craft beer*”) OR TITLE (“craft brew)) AND DOCTYPE (ar) AND PUBYEAR < 2020 AND (LIMET-TO (LANGUAGE. “English”))
With the identified documents, the ad hoc database is created in the Excel 2019 program (v19.0) of the Microsoft Office 2019 package. For its analysis, three parameters are considered (Cancino et al., 2018): number of articles, number of citations and the h-index of Hirsch (2005) that considers both parameters and is defined as “A scientist has index h if h of his or her Np papers have at least h citations each and the other (Np-h) papers have ≤h citations each” (Hirsch, 2005, p. 16599).
Results
In this section, the main results of the bibliometric and overlapping analysis of the scientific articles indexed in the international databases Wos and Scopus that address the subject related to Craft Beer are discussed.
Production
Table 1, which is a comparative chronology of the articles on Craft Beer indexed in the databases, collects the selected articles chronologically, following the methodology set out in the previous section. As shown, the first article appeared in 1994, but it was not until 2017 when the interest in publishing about this type of beer brewing was aroused, highlighting 2019 as the year with the highest production. Considering the number of citations received by the articles, the year 2006 (366 WoS–450 Scopus) stands out above the rest, followed by the years 2015 (234–210) and 2014 (135–159). It should be noted that the articles published after 2016 have not reached their maximum potential yet regarding their ability to be cited. A strong sign which shows that we are dealing with a field of extreme present-date relevance is the fact that in the last 3 years, period 2016 to 2019, the number of articles published adds up to 74.78% (83) of the total of WoS articles and 71.77% (89) of Scopus articles.
Comparative Chronology of the Articles in WoS and Scopus on Craft Beer.
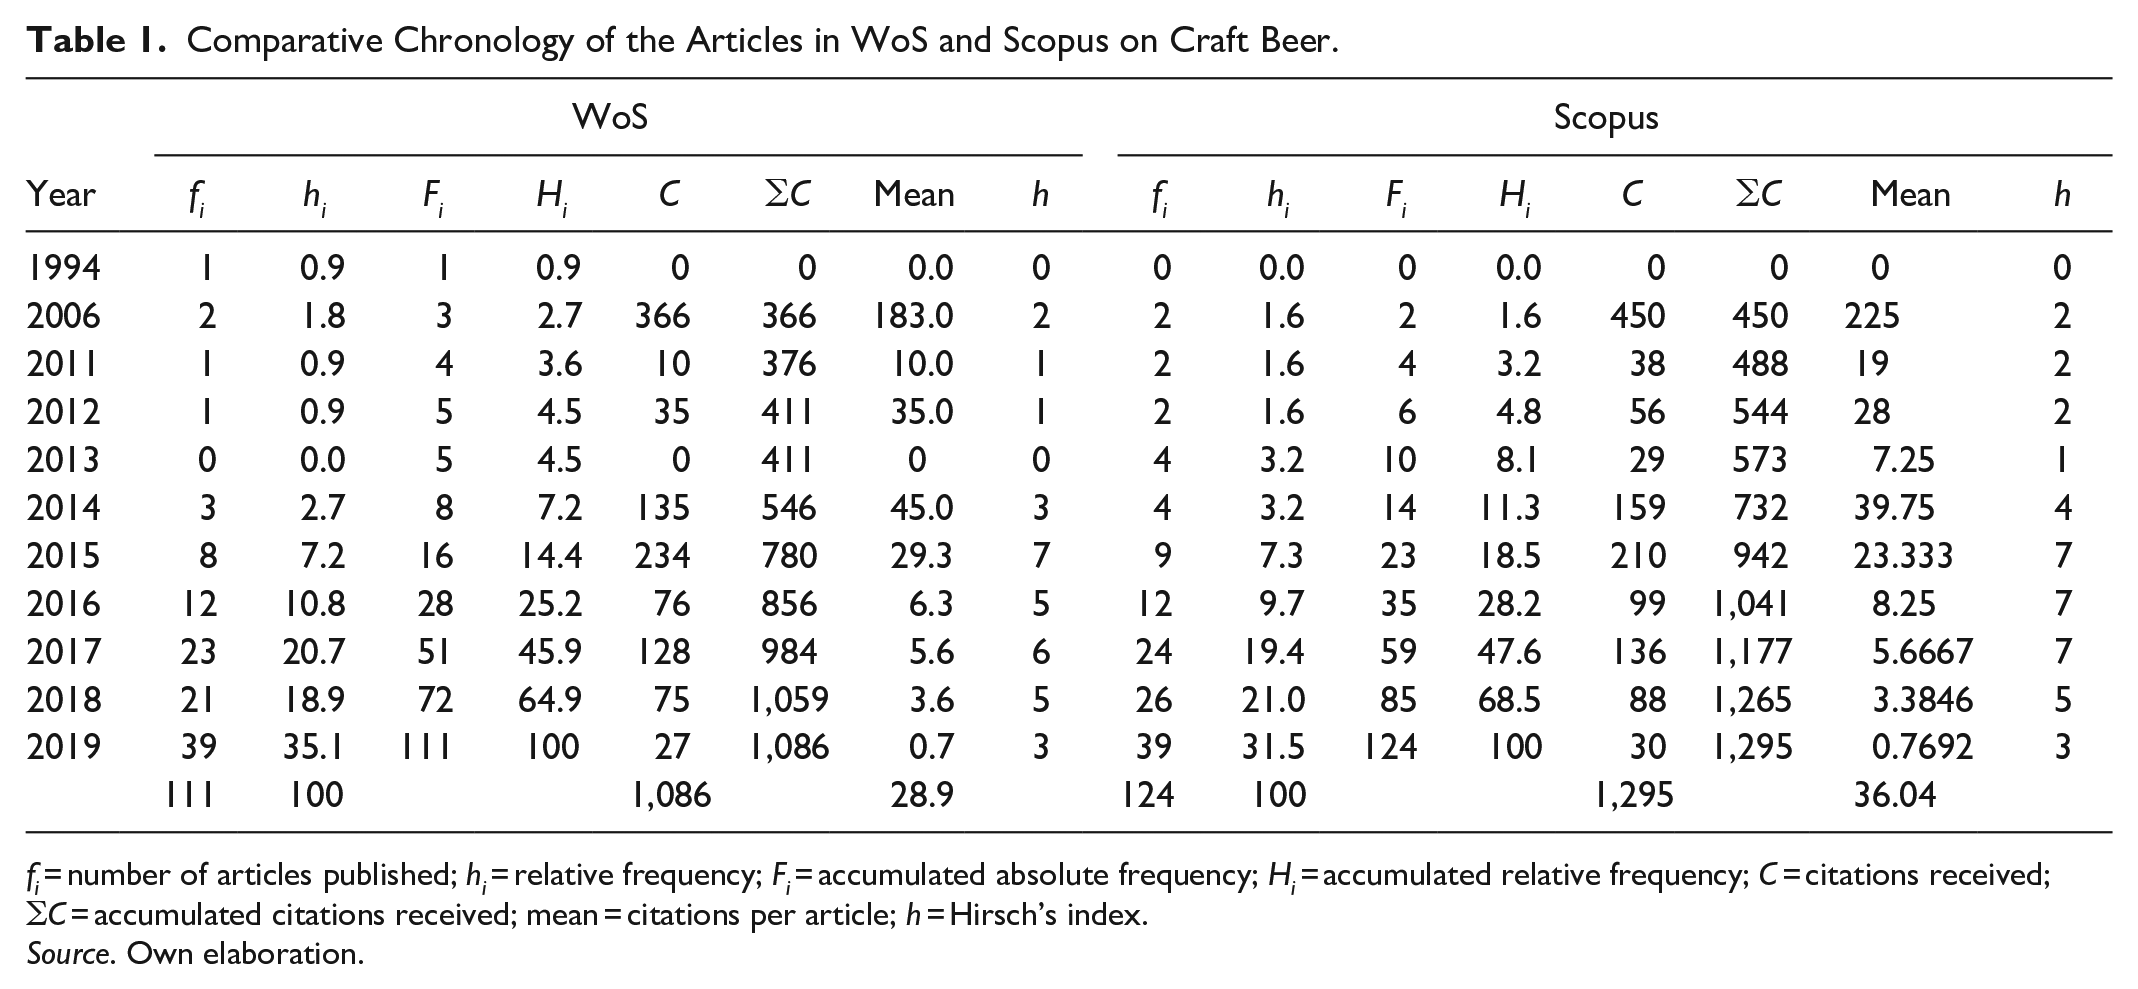
fi = number of articles published; hi = relative frequency; Fi = accumulated absolute frequency; Hi = accumulated relative frequency; C = citations received; ∑C = accumulated citations received; mean = citations per article; h = Hirsch’s index.
Source. Own elaboration.
A bibliometric indicator to study the production and analyze the productivity of a discipline is the bibliometric law of exponential growth formulated by Price (1956). This law states that the growth of scientific information can double every 10 to 15 years (it depends largely on the area of knowledge). Therefore, an exponential growth occurs, which reaches a limit and is a geometric progression. Expressed mathematically it is:

Where:
N—Measured quantity related to size
N0—Magnitude measured at time t = 0
b—Constant that relates the growth speed with the size already acquired
Regarding the evolution of production, Price (1956) proposes two stages. In the first stage, an exponential growth occurs, in which the growth rate is proportional to the size of the sample. In the second stage, linear growth occurs, the growth rate is constant or independent of the size of the system. In summary, the stages are: precursors, exponential growth, linear, and collapse of the scientific field.
By applying this equation to this scientific production analysis on “Craft Beer” related articles, the growth curve equation is the one shown in Figure 2.
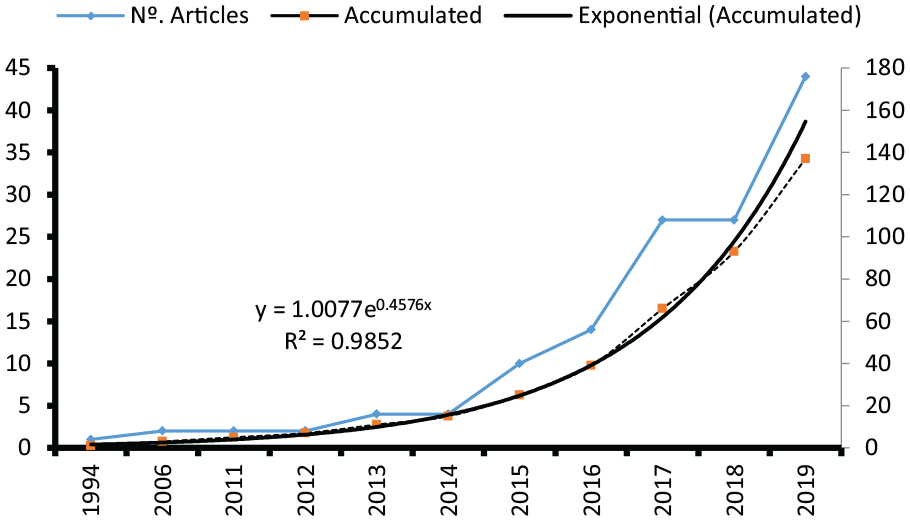
Growth curve of the production of articles on craft beer.
In addition to the parameters of the exponential equation, we can deduce two very significant concepts:
Doubling Time (D), equal time periods between which the magnitude studied grows twice.
The result of 1.51 years is the time it took to double the number of articles on Craft Beer in the period analyzed (1994–2019)
Annual Growth Rate (R) represents how much the magnitude has grown compared to the previous year, expressed as a percentage.
That is, the annual growth rate stands at 58.03%.
Figure 3 shows a strong linear correlation between both databases with regard to the number of published documents; the data are fitted to a regression line with a coefficient of determination of R2 = .9808.

Correlation between the number of articles published per year in WoS and Scopus.
Citations
Observing Table 1 again, the 111 documents that WoS indexed between 1994 and 2019 received a total of 1,086 citations (28.9 citations/document). In this same period, Scopus follows a similar behavior, although with higher results. Its 124 articles were cited a total of 1,295 times (36.08 citations/document). If we analyze the h-index of Hirsch (2005), it is observed that both databases reached their maximum level in 2015, 2016, and 2017. Note that according to Merigó et al. (2015), an article will reach its maximum citation level 10 years after its publication.
If we are mainly interested in the behavior of article citations, Figure 4 shows a constant growth from 2006, which is the year in which the highest number of citations are collected in both databases (366 WoS and 450 Scopus). The same as in the case of production, there is a strong correlation with the number of citations received per year. The regression line shows R2 = .9899.

Growth and correlation of citations per year for articles on craft beer.
By only focusing on the articles and not the year, it is observed that the articles identified in WoS (111) have an average of 28.9 citations/article and an h-index of 18. Only two articles (1.80%) received more than 100 citations. In Scopus (124 articles) there is an average of 36.04 citations/article and an h-index of 20. About 2.42% (three articles) received more than 100 citations. About 17.12% (19) and 17.74% of WoS and Scopus articles did not receive any citations, respectively.
Table 2 shows the articles that received the highest number of citations.
Most Cited Articles in WoS and Scopus: Craft Beer.

Note. R = rank; C = total number of citations per year; C/age = average citations received by years.
Fuente: Own elaboration.
Considering the classification of articles based on the number of citations received (Table 2), the work of Clemons et al. (2006), with 354 citations in WoS and 439 in Scopus stands out over the rest of the works. It is followed by that of Biancolillo et al. (2014) with 90 and 89, Aquilani et al. (2015) with 66 to 62, and Murray and Kline (2015) with 43 and 46, respectively.
Overlapping and Singularity
By using the screening procedure, 111 articles were identified in WoS and 124 articles in Scopus; 98 are present in both databases, which represents 88.29% and 79.03% of the total articles. The rest of the works, 13 (11.71%) and 26 (20.97%), respectively, are articles indexed in a single database (Figure 5). Regarding the overlap in the Journals, it is observed that it is 21% of the total.

Overlap in the craft beer knowledge area (articles and Journals).
Academically, traditional overlap (TO; Gluck, 1990) is used as a tool to measure overlap between databases. In this case it is 71.53%, which is the percentage of similarity or similitude if we compare the production of both databases. The disparity stands at 28.47%. To know the percentage of coverage of one base with regard to the other and vice versa, the relative overlap (RO) is calculated (Bearman & Kunberger, 1977). Taking into account the data obtained, it is observed that Scopus overlaps WoS by 88.29% and vice versa by 79.03% in the Craft Beer area. This difference in coverage can be explained by two factors: different indexing policies and differences in the journals included in the database.


Meyer’s index (Meyer, 1983) or otherwise known as the relative index of singularity (Pulgarín & Isabel Escalona Fernandez, 2007) was used to analyze singularity. It allows to compare the coverage of several databases on a topic. The higher the index, the greater the singularity. Scopus shows greater singularity regardless of the variable analyzed: articles (0.55) and journals (0.56; Table 3), which means that they collect a greater number of single documents or journals.
Relative Index of Singularity.

Concentration
The Lorenz curve or also known as the concentration curve (Figure 6) is used to analyze the concentration of the number of articles in a given environment, in this case, journals that publish those articles. It is a graph that shows a higher or lower concentration in the distribution of a magnitude or what is the same, a greater or lesser degree of equality in the distribution of the total values of a variable. For its representation, the cumulative number of journals is represented on the abscissa axis and the cumulative number of published articles on the ordinate axis. In this way, a point (p; q) will represent the cumulative number of journals (p), which receive a percentage q of articles. There are two extreme cases: in the case of minimum concentration, the Lorenz curve coincides with the diagonal and in the case of maximum concentration, the Lorenz curve graph is represented by a line that coincides with the ordinate axis (Y) and at p = 1, a perpendicular line is formed. It can be observed in Figure 6 that the Lorenz curve is close to the minimum concentration in both databases.
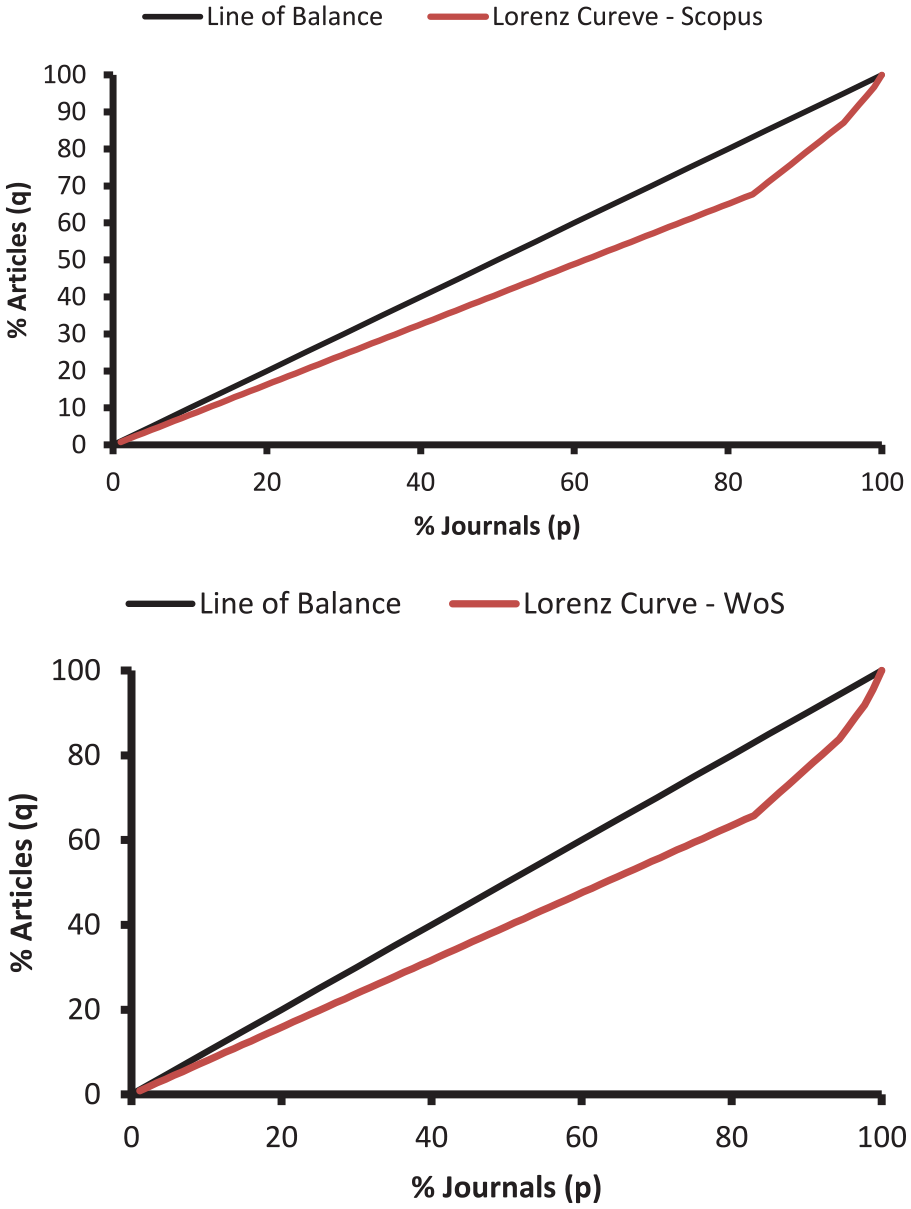
Lorenz curves for the distribution of articles in WoS and Scopus.
The Gini Index or Gini Concentration Coefficient is also calculated, which is a method to measure inequality in a distribution, so that 0 expresses total equality (all journals publish the same number of articles) and the value 1 is the maximum inequality (all articles belong to a single journal). This index is defined as:

Where:
qi = Cumulative evolution of articles expressed in percentages
pi = Cumulative evolution of journals expressed in percentages
If there is a maximum equity in the distribution of articles in the journals, Ig = 0 and if there is minimum equity, Ig = 1, then 0 ≤ Ig ≥ 1. In this case
Next, the Bradford Core is calculated. In this regard, Bradford’s Law (1934) or law of dispersion of scientific literature postulates that a small number of journals groups most of the articles published around a research area (Craft Beer) and a small share of articles is scattered in a large number of journals.
“If scientific journals are arranged in decreasing order of productivity of articles on a given topic, they can be divided into a core of journals more specifically related to the topic and several groups or areas that contain the same number of articles as the core, being the number of journals in the core and in the following areas as 1: n: n2. . .” (Bradford, 1934, p. 86).
This Core is calculated from the so-called Minimum Zone (MBZ), defined by Goffman and Warren (1969) as “the number of articles equal to half the amount that appears in the last range of the list (normally the journals that have only one article) rounded up to the whole number value.”
Main Journals That Make up the Core of Bradford.

Note. fi = frequency (number of articles published); hi% = relative frequency; C = the total number of citations received by the published articles; h = Hirsch’s index; Q = quartile (defined as the following: Z = Percentile rank (X/Y). Where: X = the journal rank in category according to the metric (Journal Impact Factor, Total Citations, etc.) and Y = the number of journals in the category).
Finally, a comparison is made of the subject areas in which both databases classify the journals. This is not easy as there is no clear correspondence between their name and content (Table 5). In both databases, most of the articles included in the categories are related to Agriculture and Technology, but Business and Economics also occupies a prominent position, since some of the articles are focused on the management of the Craft Beer industry.
Main Subject Areas in Which the Articles on Wastewater Management are Classified.

Note. fi = frequency (number of articles published); hi% = relative frequency; C = the total number of citations received by the published articles; C/fi = average citations received by the published articles; h = Hirsch’s index.
Authors
Lotka’s Law (1926) is taken into account for the analysis of the distribution of authors according to their productivity. It is a bibliometric quantification law based on a discrete probability distribution. This law states that “there is an unequal distribution of productivity among authors and that, regardless of the discipline, most authors publish the least number of papers, while a few authors publish most of the relevant bibliography on a research topic, and form the most prolific group” Lotka (1926, p. 318).
In this regard, the number of authors An, who publish n papers on a subject is inversely proportional to the square of n. Its mathematical expression is:

Where,
An = number of articles corresponding to a certain number of authors applying Lotka’s Law
A1 = number of articles produced by a single author
n2 = the squared value of the number of authors for which we calculate the corresponding number of articles by applying the law of exponential growth
Taking into account this law, the usual thing is to distribute the authors in three levels of productivity. The first level consists of small producers or also called transient, with a single authorship or productivity index = 0, the second level is made up of intermediate producers with between 2 and 9 authorships and a productivity index >0 and <1 and large producers with 10 or more authorships and a productivity index ≥1.
Following these criteria, it is observed that there is no author with more than 10 publications (large producer). About 11.29%, which is 42 of authors, are intermediate producers and most of the authors, which are 330, represent 88.71% of the total and are transient with a single authorship. The Productivity Index is 1.18 article/author. Table 6 shows the most productive authors in descending order. The first position in the Ranking is held by Reid, N. with eight publications, followed by Duarte, A. with six publications, and two authors with four authorships each; Pretti, L- and Sakelarios. N.
Authors With Three or More Publications.
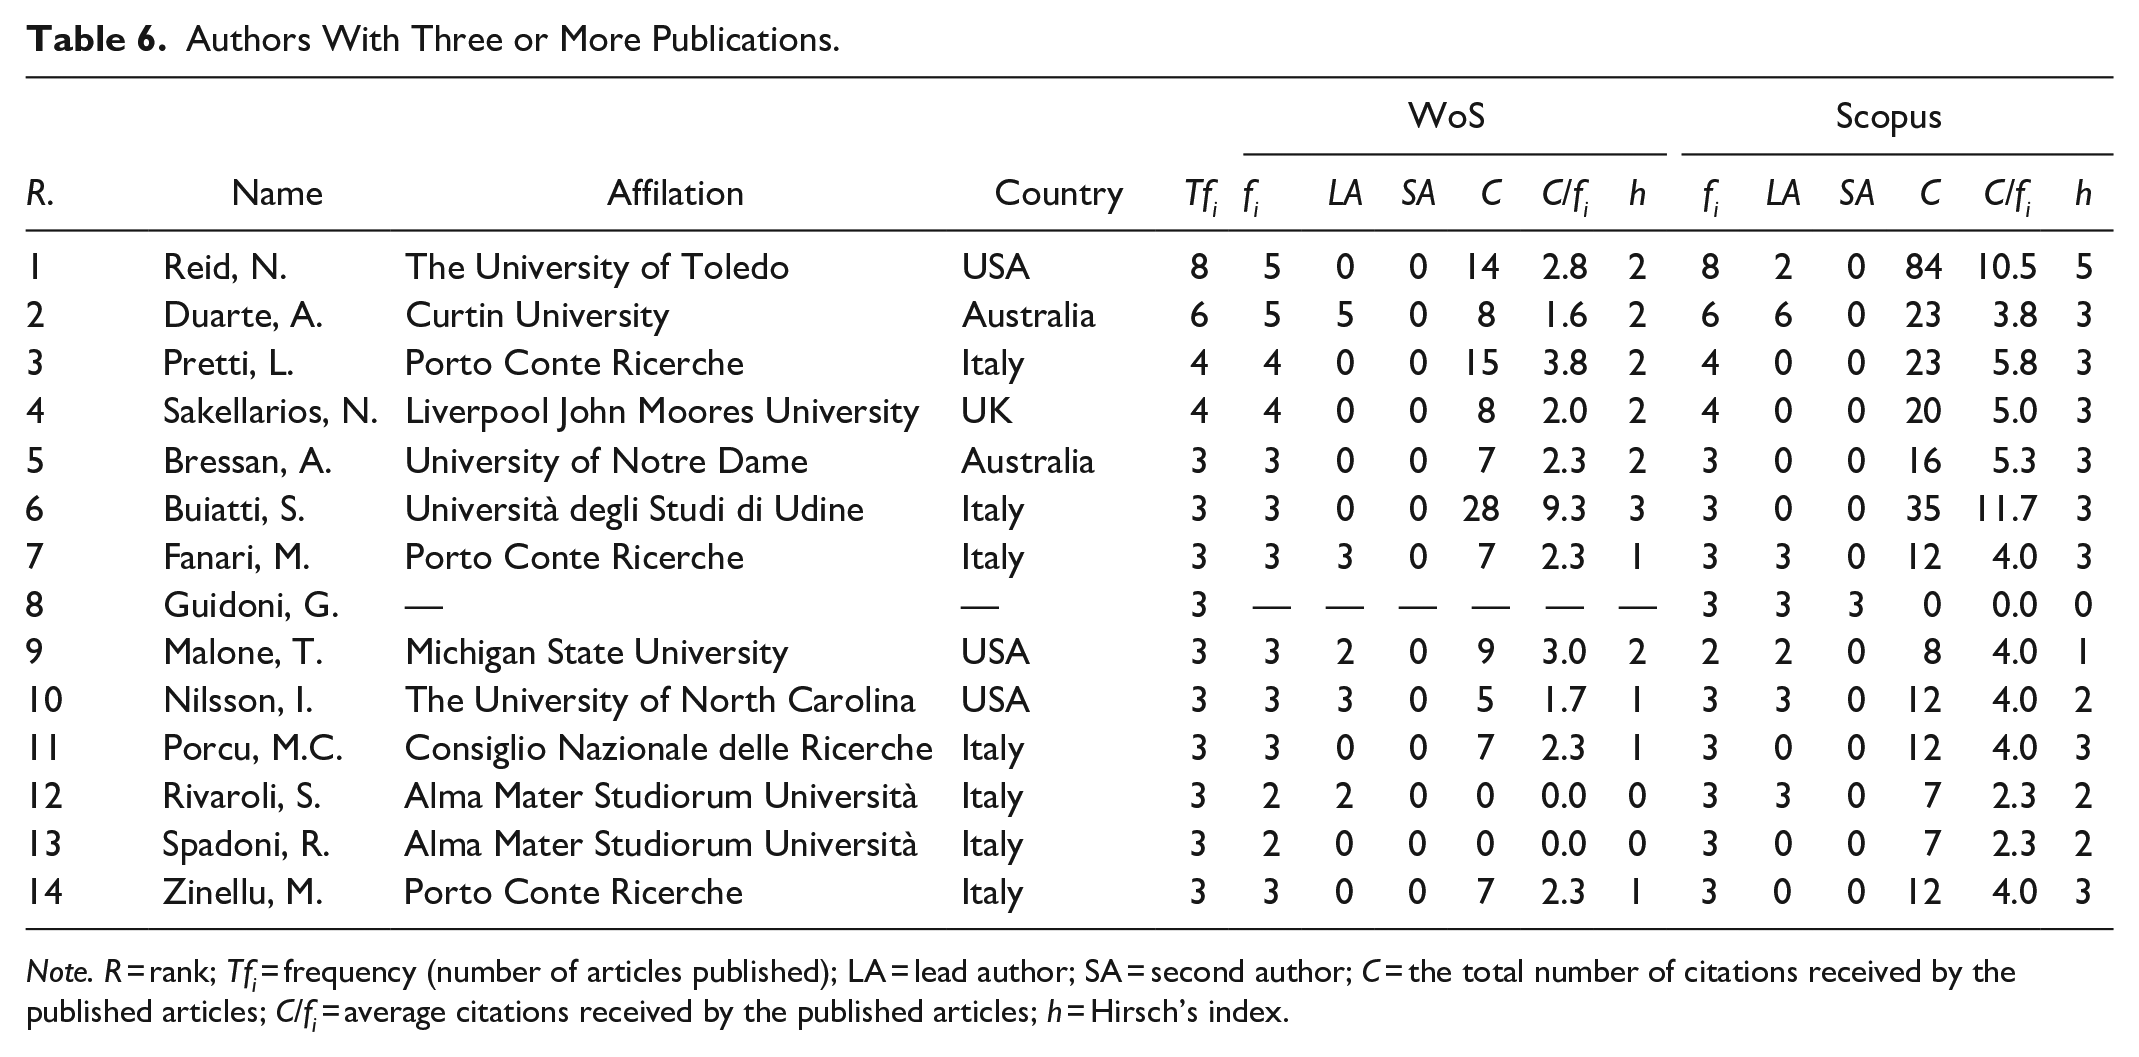
Note. R = rank; Tfi = frequency (number of articles published); LA = lead author; SA = second author; C = the total number of citations received by the published articles; C/fi = average citations received by the published articles; h = Hirsch’s index.
The Collaboration Index (weighted average of authors per document/number of documents presented by an institution or published by a specific journal) was also calculated, which was 3.2. Its mathematical expression is:

Where:
N = total number of documents
ji = is the total numberof documents with multiple authors
ni = number of documents with j authors or that j were cooperating teams
The degree of collaboration (number of articles with multiple authorship/total number of articles × 100) is 78.83%. Therefore, it can be confirmed the researchers who deal with this topic do so mainly in collaboration. It was also observed that the articles with multiple authorship, in 42.34% of the cases are signed by two or three authors.
Regarding the Transience index, it is 88.71%, indicating that the vast majority of authors have only contributed one work and are therefore, transient authors. The following mathematical expression was used for its calculation:

Where:
AT = number of transient authors, with a single published article
Ta = Total identified authors sample
In the analysis by countries (Table 7), and depending on the number of articles that both databases index, it is observed that the first position is held by the United States in both databases, with 34.2% (38) of WoS papers and 30.6% (38) of Scopus papers, followed by Italy with 25.2% (28) and 25.0% (31), respectively, and the United Kingdom with 9.9% (11) and 10.5% (13). If we consider the number of citations, the first two positions are still occupied by the United States with 558 and 706 citations, respectively, and Italy with 347 and 360 citations, producing a change in the third position, since it is held by France in WoS with 51 citations and by Australia in Scopus with 60 citations.
Countries With Four or More Articles According to the WoS and Scopus Databases.

Note. R = rank; fi = frequency (number of articles published); hi% = relative frequency; C = the total number of citations received by the published articles; h = Hirsch’s index.
Conclusions
A bibliometric analysis of the scientific publications indexed in the international databases WoS and Scopus was conducted in this research, with the aim of observing and analyzing the knowledge-generating process in the thematic area of Craft Beer. Information is obtained on production and its evolution, authors or research groups that address this topic, collaboration in publications and also the impact of publications, which are analyzed using citation analysis. In addition, a comparative study of the two databases is carried out, in which the Overlap and Singularity were analyzed, with the aim of identifying which of them indexes more research on the subject.
The results obtained are discussed in the previous section and lead to the following conclusions. In the first place, it should be mentioned that it is a new and incipient area that is only 9 years old (despite the fact that the first article appeared in 1994), but it was not until 2015 that it aroused a real interest for researchers and the number of published articles grew exponentially; 90% of production is concentrated in the 5-year period from 2015 to 2019. Taking into account the scientific production until the year 2019, which was the last year analyzed, it can be stated that it is in an exponential growth phase, being therefore an attractive field for present and future researchers.
Second, it is observed that most of the researchers and signatories of works are transient producers (88.71%) with a single authorship, which indicates or is a reflection of an underdeveloped subject. There are very few authors with a solid background in this line of research (11.29%, 42 authors are intermediate producers with two to nine authorships). The most productive authors are: Reid, N., followed by Duarte, A. Pretti, L., and Sakellarios, N. In summary, research is incipient, there are many areas of knowledge and approaches from which this topic should be approached due to its multidisciplinary nature (marketing, management, business organization, marketing and market research, sociology, food technology, information, among others).
Thirdly, there is a trend toward cooperation between researchers (degree of collaboration of 78.83%) taking into account the number of signatories of each article. In the analysis of the signatories’ country of affiliation, it was possible to observe that the United States is the leader, followed by Italy, and at a certain distance by the United Kingdom.
Fourth, in the citation analysis by publications per year, it is observed that it is constant and only two articles (1.80%) received more than 100 citations. The small number of citations is due, as already mentioned, to the youth of the subject. Taking into account the number of citations received by the articles, in the country ranking, the first and second positions are held the by the United States, Italy, and France, which are the authors’ countries of affiliation.
Fifth, it is observed that there is no defined core of journals (Core of Bradford) that collect a large number of published articles. This fact together with the Gini Index confirms that the articles are widely distributed among the journals. In both WoS and Scopus, most of the articles are included in the categories related to Agriculture and Technology, but Business and Economy also occupies a prominent place, which is a scientific area that collects articles on the management of the Craft Beer industry.
Finally, similarities were observed between both bases, which is the same as what happened in other thematic areas (Durán Sánchez et al., 2018). However, the results obtained show that Scopus makes a greater coverage of the Craft Beer subject; it collects a greater number of documents, they receive a greater number of citations and it has almost 21% of single documents (it overlaps 88% with WoS). Therefore, if Scopus were selected as the only documentary source, only 12% of the total articles found would be lost.
Mention that this document provides a map of scientific knowledge allowing to make sense of a large set of unstructured data. Researchers can use the results of the same to obtain a vision on the subject and draw their own conclusions, as well as decide on what is necessary to investigate. In this sense, as complementary research, studies such as the one carried out by Nave et al. (2021) are very interesting, in which they focus on a scientific area, specify and complement the overall vision given in this bibliometric analysis with a detailed analysis and depth of research on craft beer in a specific scientific area. In this sense, we agree with Nave et al. (2021) who state that “bibliometric studies that are well done can build firm foundations for advancing a field in novel and meaningful ways—it enables and empowers scholars to (1) gain a one-stop overview, (2) identify knowledge gaps, (3) derive novel ideas for investigation, and (4) position their intended contributions to the field” (p. 285).
This research has several limitations. The first one refers to the databases selected to carry out the research; the research was limited to the literature in English; therefore, it is biased regarding the language. To solve this problem, in future research it would be necessary to include new databases that index documents published in other languages. Second, the approach followed is quantitative, bibliometric indicators were applied, so in future research, it would be important to apply the qualitative analysis together with the quantitative one, allowing to delve into the content aspects of the articles. Finally, the limitation derived from the use of a certain search equation must be mentioned, as well as a single documentary unit, which is the article, and not having considered documents presented in Congresses, book publications and book chapters, among others.
Footnotes
Declaration of Conflicting Interests
The author(s) declared no potential conflicts of interest with respect to the research, authorship, and/or publication of this article.
Funding
The author(s) disclosed receipt of the following financial support for the research, authorship, and/or publication of this article: This publication was funded by Horizon Europe Research project Incore: Innovation Capacity Building for Higher Education in Europe’s Outermost Regions - ENG000614 and the Consejería de Economía, Ciencia y Agenda Digital de la Junta de Extremadura and by the European Regional Development Fund of the European Union through the reference grant GR21161.