
Abstract
In the age of digitalization, big data analytics capabilities are considered one of the most critical organizational resources. Many organizations make considerable investments in these resources with an intention to improve their agility. However, the mechanism to reap agility from big data analytics still requires extensive empirical research and analysis. This study extends the big data analytics model by examining the mediating effects of entrepreneurial orientation between big data analytics capabilities and organizational agility. Partial least squares-structured equation modeling (PLS-SEM) was used to analyze the responses collected from 104 firms in Jordan. Results demonstrate that entrepreneurial orientation explains the relationship between big data analytics capabilities and agility. This finding contributes to the management literature by showing that big data analytics capabilities may enhance firm entrepreneurial orientation. While much of the prior research conceptualized the entrepreneurial orientation of the firm as a static characteristic, the current study argues that big data analytic capabilities play a key role in developing organizational agility through its role in improving entrepreneurial orientation, which subsequently creates value for firms, their customers, and the other stakeholders. Finally, challenges and future scope pertaining to this study are discussed. Recommendations for future studies on this promising topic include the use of longitudinal designs and mixed methods (quantitative with qualitative) approaches to provide researchers with new insights.
Introduction
The growth in digital transformation in various aspects of life has led to increased interest from both researchers and practitioners to consider the factors that sustain this growth. One of the digital transformation technologies that changed the conventional shape of doing business in the 21st century is the use of “Big Data” (BD; Mcafee & Brynjolfsson, 2012). Big data refers to a huge amount of heterogeneous data that can be curated and analyzed using a large variety of platforms (e.g., Apache Hadoop, Apache Spark, Microsoft Azure, and Tableau Software), these data are characterized by high volume, high variety, and high velocity, which traditional data systems and approaches to data management are unable to capture, organize, and analyze (Chen et al., 2012; Zeng & Khan, 2019).Organizations need to have analytical capabilities to properly use big data (Gandomi & Haider, 2015) in order to build products faster (Aydiner et al., 2019; Choi et al., 2018), and offer new economic commodities to meet customer’s changing demands (Ghasemaghaei & Calic, 2019; Opresnik & Taisch, 2015). Thus, big data are closely associated with firm performance because it enables agility. Organizations that use big data analytics have the ability to quickly sense, think, and act to capture opportunities in a volatile market. Likewise, data analytics in the big data revolution have induced a more entrepreneurial attitude and inspired many data entrepreneurs, resulting in considerable changes in the entrepreneurship concept among organizations (Sedkaoui, 2018). In addition to big data, another factor, that is, believed to influence firm performance in today’s competitive and volatile environment is the entrepreneurial orientation of a firm. A firm that is innovative, proactive, and willing to take risks is said to have a higher level of entrepreneurial orientation compared to firms where strategic orientation is more aligned with protecting their current position (Lumpkin & Dess, 1996; Rosenbusch et al., 2013; Wiklund, 1999). Entrepreneurially oriented firms are more likely to be in a position to utilize their big data analytic capabilities to create value (Covin & Lumpkin, 2011) and similarly their big data analytics capabilities can enable them to develop a more entrepreneurial orientation. Hence, Entrepreneurial orientations explains the performance implications of big data analytics. Darwis (2017) stated that entrepreneurial orientation is one of the critical components that integrates, builds, and reconfigures the external and internal capabilities to respond to aggressive and hyper-volatile market conditions. Thus, entrepreneurial orientation establishes the ground and paves the way for higher levels of agility (Christopher, 2000; Gölgeci et al., 2019).
While agility has been considered a major enabler of a business’s performance and an antecedent of business value (Côrte-Real et al., 2017; Overby et al., 2006), the IT capability literature have not investigated how agility can be enhanced (Oh & Pinsonneault, 2007) and only emphasized firm performance (e.g., Ferraris et al., 2019; Mikalef et al., 2020; Rialti et al., 2019; Wamba et al., 2017). Although a limited number of studies (Ghasemaghaei et al., 2017; Hyun et al., 2020) have addressed the conditions (i.e., organizational culture and fit perspectives) under which big data can lead to agility by investigating possible moderators, the understanding of the mediator that enable big data to enhance agility is still unclear. Thus, to help us understand the mechanism that makes this relationship possible. the study model seeks to investigate the role of entrepreneurial orientation as a possible mediator that facilitate the relationship between big data analytics capabilities and organizational agility. Perpetuating BDA capability is essential because firms must be able to reconfigure their existing business model or build a new one in response to currently changing business conditions (Ashrafi et al., 2019).
The objective of the study is to provide knowledge on the relationship between Big Data Analytics Capabilities and Organizational Agility and the role of Entrepreneurial Orientation. More precisely, identifying how Big Data Analytics Capabilities together with Entrepreneurial Orientation may improve Organizational Agility in manufacturing industries. Also, assessing the utilization of Big Data Analytics, Entrepreneurial Orientation, and Organization Agility in Jordanian manufacturing sector in order to enable the organizations to gain competitive advantages that can be sustainable. Accordingly, this study draws on the resource-based view (RBV) and dynamic capability view (DCV) to develop a hybrid conceptual framework to achieve the research objective.
The rest of this paper is organized as follows. The following section discusses the relevant literature, subsequently, the research model and the related hypotheses are presented followed by the research design and methodology. The analysis results and the findings in terms of implications for theory and practice are presented followed by the limitations of this study and suggestions for future research directions.
Review of Literature and Hypotheses Development
Dynamic capability theory explains how firms need to develop abilities necessary to maintain their competitiveness in volatile markets and changing business conditions. Rooted in the resource based view, the dynamic capabilities theory recognizes the importance of having certain types of tangible and intangible resources (Teece et al., 1997). Resources that are valuable, rare, costly to imitate, not easily substituted, and can be organized to capture value will enable a firm to gain sustainable competitive advantage (Yadav et al., 2017). While the resource based view may be seen as static, the dynamic capabilities on the other hand refers to the competence of a firm to adapt and change their resources internally and externally in response to or in anticipation of and possibly to have an impact on their business environment (Teece, 2012).
Dynamic capability (DC) operates through three main mechanisms: sensing capacity, seizing capacity, transforming capacity (Teece, 2009). Sensing capacity is essentially about identifying and exploring market demands and technological opportunities, both inside and outside of the organization (Hodgkinson & Healey, 2011; Teece, 2014). Seizing capacity refers to mobilization and coordination of resources to fulfil identified customer needs, market opportunities, and threats as quickly as necessary (Teece, 2007). Transforming capacity focuses on resource renewal, knowledge generation and integration, and organizational structure (Katkalo et al., 2010; Moliterno & Wiersema, 2007; Teece, 2007).
Big data analytics capabilities are necessary to develop these dynamic capabilities in today’s business world. Thus the big data has been regarded as the fuel of business value and a revolutionary term for managing innovation, productivity, and competition (Manyika et al., 2011; Mcafee & Brynjolfsson, 2012) in the industry 4.0 era. Chen (2012) used the term “big data analytics” as a component of business intelligence that is concerned with data mining, data infrastructure, data visualization, and analysis. The last 10 years has seen an exponential increase in interest in the big data field from scholars and practitioners to understand the business value the firms can create through big data analytics. Y. Liu (2014) reported that adopting big data analytics in decision-making have potential to decrease the cost of customer acquisition by 47% and revenues growth by 8%. They report that more than 300 billion dollars in health services every year could be saved, if big data analytics outcomes were used creatively by the U.S. health care system. Furthermore, eBay and Amazon use customer browsing data and many retailers use loyalty-card data to increase their sales through improving the forecast of customer-buying trends (Chen et al., 2012; Gandomi & Haider, 2015). IT-related capabilities (e.g., big data analytics) increasingly becomes fundamental in configuring competence that defines agility within a firm (Lowry & Wilson, 2016). Particularly, organizations can actively realize the changes in the marketplace and provide customers with innovative products and services by fine-tuning and optimizing the organizational routines (Queiroz et al., 2018). Resources, individually, may not generate value; organizations need strategy, structure, and internal organizational processes to capitalize on the resources (Barney, 1991; Eisenhardt & Martin, 2000). Entrepreneurial orientation (EO) can facilitate the organizational capability that is needed to utilize the resources that big data analytics capability can produce in enhancing competitiveness (Covin & Lumpkin, 2011). Entrepreneurial companies need to understand not only the current business situation, but also to identify the future challenges and occasions and proactively arrange innovative solutions and take the necessary risks before it is too late. Big data analytics platforms can enhance the ability of the organization to find these innovative solutions by allowing immediate and convenient access to various business-related information that was not available before the currency of big data technology (Watson et al., 2018). When firms have more access to structured and unstructured information, this allows them to find and analyze new patterns and recognize new trends in the marketplace (G. George et al., 2014; Sivarajah et al., 2017). The information is necessary for innovative products and services as well as recognizing and targeting new markets (Mazzei & Noble, 2017). In short, IT-related capability is a key factor to organizational agility, both paving the way toward sustainable competitive advantage especially when a firm has enhanced entrepreneurial orientation.
Big Data Analytics Capabilities
BDA has recently received substantial attention from firms as a tool to manage the proliferation in digital transformation and unprecedented availability of data. As the use of the internet and social media surge, there is unprecedented amount of data that are accumulated (J. Liu et al., 2016). Many firms try to establish a stronger relationship with their customers beyond simple transactions. Through customer relationship management systems, they can gauge customer interactions and accumulate longitudinal data. The firms that can build the big data analytics capabilities can quickly sense their market changes, leverage threats and opportunities, and make decisions quickly and accurately (Chen et al., 2012; Hyun et al., 2020; Mandal, 2018; Zhou et al., 2018). For instance, prompt access to information enables firms to recognize changes in behaviors of their competitors, reception of technological advancements, and customer preferences. Subsequently, those that have this access to the information can gain actionable insights within their managerial teams (Lu & Ramamurthy, 2011). In particular, data analytics enables quick responses and better quality and timely decisions thus increased the agility leading to developing and producing products and/or services that address customer expectations without delay (Cheng et al., 2020; Li et al., 2020). Furthermore, the adoption of the data analytics results can increase operational adjustment agility. This kind of agility occurs as a result of business process optimization within a firm allowing to enhance its ability to rapidly respond to the changing environment in a competitive manner (Ghasemaghaei et al., 2017). With reference to dynamic capabilities theory, big data analytics can be considered as the analytical skill that enhances firm’s decision-making process under uncertain circumstances (Chen et al., 2015).
In dynamic market conditions, competitive advantage depends on big data analytics capabilities to better realize customer desires (Duan et al., 2020). Entrepreneurial orientation refers to a firm’s proclivity to explore new business opportunities in the current and/or new markets that may offer advantages to the firm (Boso et al., 2013). The entrepreneurial conduct exhibited by the firm is commonly focused on how firms run their business activities and reflects their core thinking (B. A. George & Marino, 2011; Miller, 1983). Wu (2008) argues that entrepreneurial capabilities are one of the key elements that aid firms in the dynamic environment. Three main characteristics of innovativeness, risk-taking, and pro-activeness enable entrepreneurially oriented firms to access new customers through innovative products and technology (Miller, 1983). Since the innovation is generally a costly and risky investment, firms need to leverage big data analytics capabilities to reduce cost of the innovation process and generate superior returns (Arunachalam et al., 2018; Wiklund & Shepherd, 2005). Consequently, both big data analytics and entrepreneurial orientation empower organizations to enhance the value they provide to their customers and thus gain competitive advantage by offering differentiated products and services or offering lower prices than the competition for their customers.
Based on the reviews of the literature above, the following hypotheses were put forward:
Entrepreneurial Orientation
The core of entrepreneurial orientation (EO) is the strategic actions for creating business value in response to challenges and opportunities in the environment (Lumpkin & Dess, 1996; Rauch et al., 2009). EO establishes the road-map for higher organizational agility despite hostile economic conditions (Christopher, 2000). Firms with high levels of entrepreneurial activities are likely to organize their resources in an agile way in volatile markets (Zahra et al., 2009). Agile firms quickly and effectively sense potential market demands, adjust the needed resources to innovate new solutions and change competitive directions in a short while and leaving themselves space to manoeuvre in other paths (Kim et al., 2015; Sambamurthy et al., 2003). The debate of entrepreneurship in relation to organizational agility leads to an inference that EO and agility are theoretically and practically considered as related concepts in the organization development field. In this sense, the researcher hypothesizes:
H3. Entrepreneurial orientation is positively associated with organizational agility.
The Mediating Role of Entrepreneurial Orientation
Information technology (IT) literature indicates that dynamic capabilities (i.e., entrepreneurial orientation) can establish a connection between knowledge management and organization agility (Ashrafi et al., 2019; Ghasemaghaei et al., 2017; Hyun et al., 2020). As stated in Watson et al. (2018), a culture driven by big data fosters knowledge access and the sharing of information that support organizations’ analytical capabilities. Subsequently the access and sharing of information and the removal of “silos” helps to develop an entrepreneurial climate. Furthermore, successfully acquiring real-time data on market players can help firms to predict current and potential future behavior of their competitors and customers in the market where they compete, thus augmenting their ability to seize the calculated risks for promising development opportunities (Côrte-Real et al., 2017). Several studies in the field of information technology address the positive effects of big data analytics on entrepreneurial orientations (OE) and, in turn, on agile, competitive advantage, and overall performance. According to Qosasi et al. (2019) information systems capabilities encourage entrepreneurial orientation by empowering innovative, risky, and proactive decisions in a volatile market, which increase their competitive advantage. Similarly, Sahi et al. (2019) stated that technological development levels govern the effects of entrepreneurial efforts on operational responsiveness. That is, entrepreneurial efforts can foster manufacturing ability to observe favorable market needs, which directly influence business overall performance (Chavez et al., 2017). Innovation dimension of EO leads to increase in flexibility of production volume, product assortment, and offering new products (Chang et al., 2007). Whereas proactive dimension facilitates scanning firm’s business environment to develop and offer novel products and change currently used tactics and strategies (Lumpkin & Dess, 1996; Figures 1 and 2). Accordingly, the following hypothesis was postulated:

Conceptual framework.

Flow chart of the research methodology.
Table 1 elaborates the conceptual framework of the study.
Constructs and Definitions.

Research Design and Methodology
Method, Data Collection, and Sampling
This study uses PLS-SEM using confirmatory composite analysis approach and SmartPLS (v. 3.3.3) software package to assess the research model’s validity, reliability, and research hypotheses (Hair et al., 2020; Ringle et al., 2015). PLS-SEM was considered suitable for this study for four reasons. First, the PLS-SEM has a broad use and is flexible with respect to theory-building and practice (Richter et al., 2016). Second, it has an ability to address small sample sizes (Hair et al., 2016), which this study has. Third, it is useful to predict models with higher-order constructs (Lohmöller, 1989; Ringle et al., 2020). Two Step Approach was used to measure the second-order constructs (Crocetta et al., 2021). The Two Step Approach, consists of two phases: first, the latent variables scores of the lower-order constructs are computed without the higher-order construct; then, the analysis is performed using the computed scores as indicators of the higher-order constructs.
This study targeted the manufacturing industry in Jordan and the sample size has been determined using the inverse square root formula (Hair et al., 2021):

nmin = minimum sample size.
pmin = the value of the minimum significant path coefficient, that is, .2.
nmin > (2.486/|0.2|)2 = 154.505 ≈ 155 firms.
As a result, 335 questionnaires were circulated randomly to top-level managers in relevant firms as per above calculation between December 2020 and February 2021. The decision to targeting the top-level managers was made since top-level managers are more informed of the issues relating to the firm’s strategy and decision-making process. A total of 104 complete and usable questionnaires were received, resulting in an effective response rate of 31%. Baruch and Holtom (2008) pointed out the average response rate for studies that targeted top management or organizational representatives was 35.7% with a standard deviation of 18.8, which means 68% of the response rate fall within 16.9% and 54.5%. Furthermore, a medium effect size requires a sample size of at least 38 cases calculated using inverse square root method with a significance level of 5% and at a power level of 95% (Kock & Hadaya, 2018). Hence, the study sample size is sufficient for model assessment. Non-response bias was tested comparing early response (first 3 weeks) and late responses (last 3 weeks) using paired t-test (Armstrong & Overton, 1977). The results articulate that there is no statistically significant difference among the groups of response (p > .05). Table 2 presents the profile of participant firms.
Characteristics of Responding Firms (N = 104).
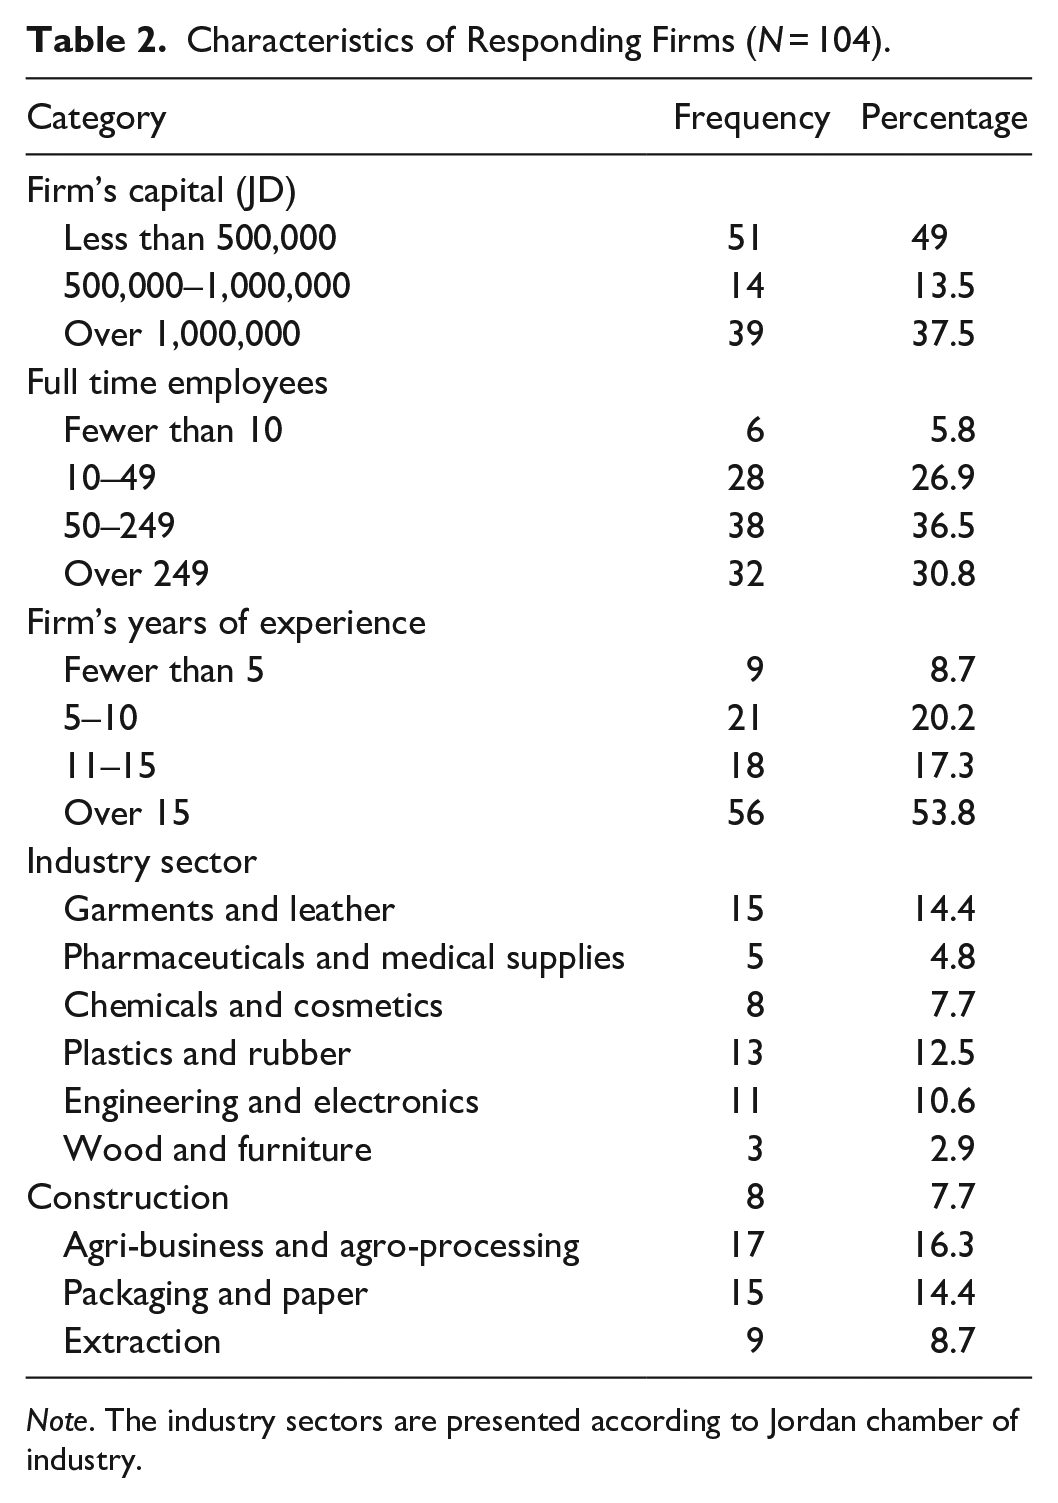
Note. The industry sectors are presented according to Jordan chamber of industry.
Measurement of Variables
In order to test the hypothesized model, a survey instrument had been developed based on the relevant literature. The face-validity of the measurement was assessed by two professors and four general managers who were asked to review the questionnaire clarity and structure. Based on the feedback, necessary adjustments to the items were made to ensure that the measures would maintain the same meaning and be understood by the sampled respondents.
Overall, 40 items were selected to measure the constructs the. The respondents rated all items on a five-point Likert scale that ranged from Strongly Disagree (1) to Strongly Agree (5).
Big data analytics capability
BDA capabilities was measured as a higher order reflective construct consisting of five reflective subscales namely, Data-driven Culture, Organizational Learning, Technical Skills, Management Skills, BDA Infrastructure adopted from Belhadi et al. (2020) and Gupta et al. (2016). Each subscale was made up of four items (see Table A1 in Appendix A).
Entrepreneurial orientation
Entrepreneurial Orientation was measured using 14 items adopted from Niemand et al. (2021), Acosta et al. (2018), and Al Mamun and Fazal (2018). The Entrepreneurial Orientation was a higher order construct that was made up of three reflective latent subscales: Innovativeness, Pro-activeness, and Risk-taking (see Table A2 in Appendix A).
Organizational agility
Since the study made use of agility as a second order reflective construct to assess firm agility, we adopted 6-item scales from Li et al. (2020) and Mao et al. (2020) that formed two latent constructs Market Capitalizing Agility and Operational Adjustment Agility (Table A3 in Appendix A).
Control variables
In addition to the hypothetical constructs this research also included three commonly used control variables in firm-level studies in order to account for their impact on the dependent variable (Carlson & Wu, 2011). Three control variables were (1) firm’s years of experience; (2) firm’s capital; and (3) the full-time employees (firm size). The use of these control variables enable us to take into consideration any possible influence that they may already have on the dependent variable (Cook et al., 1979) and to maintain the explanatory power of the hypothesized research model while taking any possible effects of the control variables into consideration (Ej & Schmelkin, 1991; Kish, 1959).
Data Analysis and Results
Measurement Model
To examine indicators internal consistency, the study opted to consider the loadings above the acceptable level 0.5 (Hair et al., 2019). All indicators show good internal consistency, as all the loadings explain more the 50% of the indicator’s variance (see Table B1 in Appendix B and Table C1 in Appendix C). Constructs reliability was estimated using composite reliability and ρA, the coefficient should be between .7 and .9 (Dijkstra & Henseler, 2015; Hair et al., 2017). The convergent validity was assessed using the average variance extracted (AVE) using a threshold of .50, which means that each construct explains at least 50% of the variance of its items (Fornell & Larcker, 1981; Hair et al., 2016). The resulting ρA, composite reliability, and AVE values (see Table 3) are above the threshold. Further the discriminant validity was established via two means. First, used Fornell-Larcker approach to verify that the square root of AVE of each construct should be greater than the inter-constructs correlation. Second, the Heterotrait-Monotrait ratio (HTMT) test proposed by Henseler et al. (2015). The value less than 0.85 or 0.90 at 95% confidence interval indicates sufficient discriminant validity (Franke & Sarstedt, 2019; Hair et al., 2019; Voorhees et al., 2016). Table 4 reports the discriminant validity based on the Fornell-Larcker criterion. In addition, using the Heterotrait-Monotrait (HTMT) test, also found that all values were below 0.85 (Table 5). Hence, the criterion for discriminant validity has been met. In sum, based on these results the measurement model has sufficient level of indicators reliability, and construct convergent and discriminant validity.
Reliability and Validity Statistics.

Note. Bold used for higher-order construct values.
Discriminant Validity for Lower Order Constructs Using Fornell-Larcker Criterion.

Note. Diagonal bold values represent the square root of the AVE, while the off-diagonals represent the correlations.
Discriminant Validity for Second Order Constructs Using Heterotrait-Monotrait (HTMT) Test.

Structural Model
To validate the hypotheses, the structural model was assessed using the empirical data. The assessment of the structural model included examining the variance inflation factors (VIF), the path coefficients for the relationships in the research model, variance explained (R2) of dependent variables, effect size of predictors variables (f2), and Stone-Geisser’s (Q2) for endogenous. The VIF statistic has been used to assess collinearity among predictors constructs. The VIF values (BDAC&EO = 1, BDAC&OA = 1.82, and EO&OA = 1.78) were below the cut-off point (VIF < 5; Becker et al., 2015; Hair et al., 2006; Mason & Perreault, 1991), which indicates that collinearity is not an issue in the present study.
To determine the statistical significance of the path coefficients, the bootstrapping with 5,000 resamples (Dubey et al., 2019; Peng & Lai, 2012) was conducted to boost the level of estimation accuracy. Table 6 depicts the PLS path coefficients and their attached p-values. Although the total effects of big data analytics on organizational agility are significant (β = .51; p < .001), the direct path of big data analytics capabilities to organizational agility when the entrepreneurial orientation is accounted for (β = .16; p > .05) does not have a significant effect in the model. Hence, the hypothesis H1 was not supported. On the other hand, the paths big data analytics capabilities to entrepreneurial orientation (β = .65; p < .001), entrepreneurial orientation to organizational agility (β = .54; p < .001) are positively linked. Hence, the hypotheses H2 and H3 were supported.
Path Metrics and Hypotheses Results.
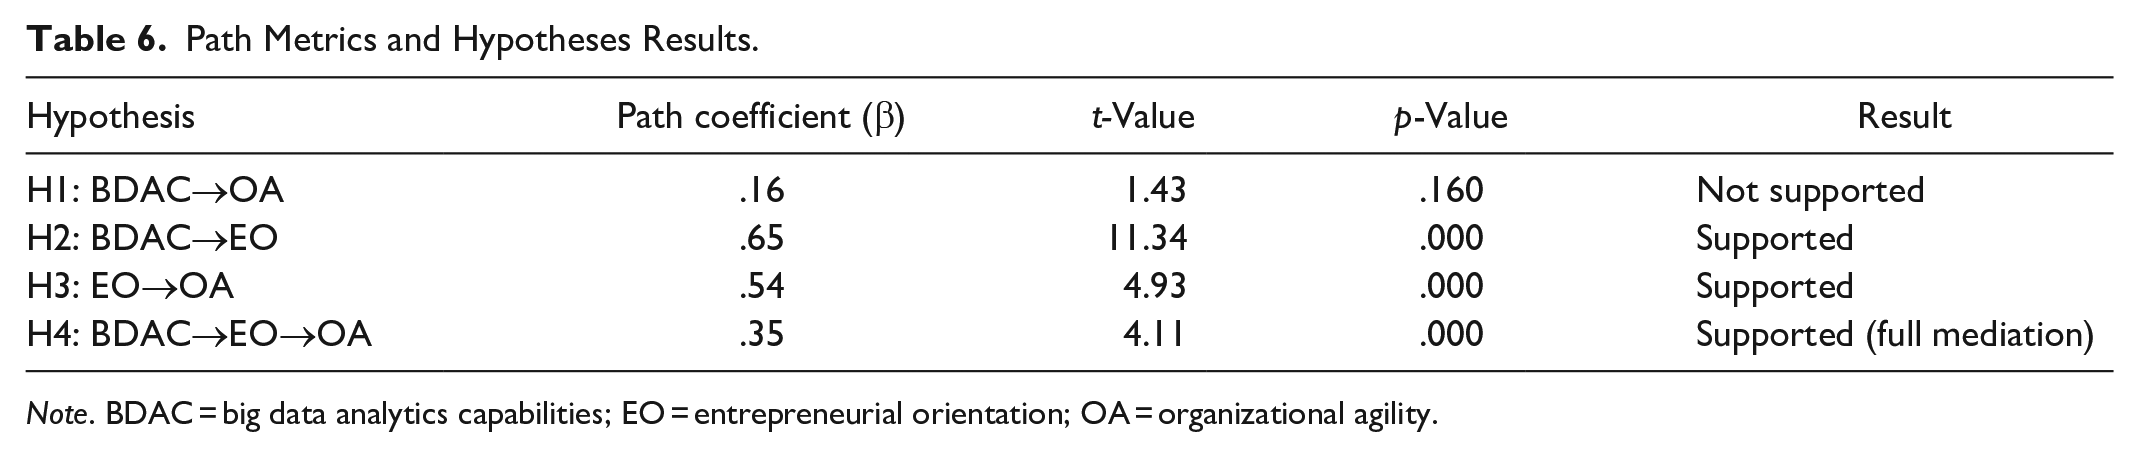
Note. BDAC = big data analytics capabilities; EO = entrepreneurial orientation; OA = organizational agility.
The Explanatory power of the research model was examined based on explained variance (R2). The results show that 42% of entrepreneurial orientation is explained by the research model. Besides, the research model explained 43% of the variation in organizational agility.
Further, to gauge the effect size of the predictor construct (f2) Cohen’s formula was employed; the values higher than 0.02, 0.15, and 0.35 are considered small, medium, and large effect sizes (Cohen, 2013). The effect size of big data analytics capabilities on entrepreneurial orientation is 0.73 and entrepreneurial orientation on organizational agility is 0.29. Then examined the predictive relevance (Q2) to assess the model’s predictive accuracy using the blindfolding procedure (Sarstedt et al., 2014). The results reveal that entrepreneurial orientation (Q2 = 0.26), and organizational agility (Q2 = 0.34). All Q2 values were above cut-off point (Q2 > 0), providing sufficient level of predictive relevance (Hair et al., 2019; Peng & Lai, 2012). Figure 3. depicts the summary of the structural model assessment results.

Estimated SEM model.
In addition to testing the hypothesized relationships, the study assessed the possible relationships of control variables (i.e., firm’s years of experience, firm’s capital, and firm size) on organizational agility. Bootstrapping results reveals that years of experience is not significant associated with organizational agility (β = −.02; p > .05); firm’s capital does not depict a significant effect on agility (β = −.01; p > .05); firm size was not related to organizational agility (β = .02; p > .05). This indicates that firm capital, size, industry type, or years of experience are not significantly related to organizational agility. Hence, stating that variety of firm characteristics (i.e., size, capital, and age) are not the reason for the variation in organizational agility, but it is due to the big data analytics capabilities and entrepreneurial orientation.
Mediating role of entrepreneurial orientation
The analyses of the present study point out evidence for mediating effect. The mediator is defined as a third variable which plays an intermediary role in the relationship between an exogenous and endogenous variable (Rigdon et al., 2010). This research used the bootstrapping technique (Hair et al., 2016; Preacher & Hayes, 2008) to estimate the mediation effect. Table 6 presents the mediation results; since the direct effect of big data analytics capabilities on organizational agility is statistically non-significant while the mediating path is significant. Thereby, we can assert that entrepreneurial orientation fully mediates the relationship between big data analytics capabilities and organizational agility. Thus, H4 is supported.
Common Method Variance
When data is collected from a single source through self-report measures, so need to be concerned about the issue of common method variance (CMV) or in some references called common method bias (N. P. Podsakoff, 2003). Reliability and validity of the constructs may be effected by a systematic error arising from the respondent bias in responding to the scales in a single questionnaire (Ashrafi et al., 2019; Malhotra et al., 2017). Tehseen et al. (2017) recommend using both procedural and statistical remedies to control and test common method bias. In the current research, the following procedures utilized to reduce the effects of CMV (1) adopting the measurement items of variables from different sources; (2) creating a psychological separation among variables using covering letter, and variables definition pane to make it clear that the measurement items of the independent and dependent variables are not related to each other; (3) the anonymity of the participants was considered; and (4) keeping the survey questions concise and simple. Moreover, conducting statistical method to verify that common method variance is not a major issue. Harman’s one factor analysis was performed to check whether a single factor represents the majority of the covariance among measures (P. M. Podsakoff et al., 2003). The output revealed that the first un-rotated factor captured only 34% of the variance in the dataset.
Discussion, Implications for Theory, and Practice
Big data with its implicit capabilities can enable business transformation and help to create competitive advantages for the business. Although many organizations have invested in their IT capabilities to boost agility levels (H. Liu et al., 2013), empirical studies have unveiled some contradicting perspectives about the influence of IT-related capabilities on firm agility (Swafford et al., 2008). Thus, there is a necessity to empirically uncover the mechanism of how investments in information systems such as big data analytics capabilities can enhance organizational agility. In this regard, the study investigates the influence of big data analytics capabilities on organizational agility and also explains the role of entrepreneurial orientation as a mediating factor that facilitates this relationship.
The findings demonstrate that while big data analytics capabilities are considered a cornerstone resource for organizations, the mechanism through which it enables agility is by its role in creating an entrepreneurial orientation. These findings are consistent with the prior literature that have also demonstrated that the business gains can only be derived from the meaningful use of technologies, rather than the technologies themselves (Barratt & Oke, 2007; Chen et al., 2015; Dubey et al., 2019; Ghasemaghaei et al., 2017; Srinivasan & Swink, 2018). Ghasemaghaei et al. (2017) and Ashrafi et al. (2019) found that information technology capabilities (big data and business analytics) only have an indirect effect on agility which is consistent with findings of this study, Rialti et al. (2019) and Hyun et al. (2020) found that big data analytics are directly and positively related to agility. In addition, entrepreneurial orientation plays a fundamental role in the relationship between big data analytics capabilities and organizational agility. This is in line with arguments in the literature that entrepreneurial orientation (EO) capability is the key to effective organizational management in today’s uncertain environment (Canakoglu et al., 2018; Levesque & Joglekar, 2018; Sahi et al., 2019). Results emphasize the necessity for firms to develop an entrepreneurial outlook to be able to reap the results of big data analytics adoption in their decision-making process. Besides the contributions of established literature; the results of the current study present some interesting implications for theory and managerial practices, within the fields of business management and information technology.
Theoretical Implications
In the theoretical facet, the outcomes of this study contribute to extend the literature related to big data analytics, entrepreneurial orientation (EO), and agility. First, the majority of previous empirical studies have analyzed the relationship between big data analytics and firm performance. This study is among the limited number of empirical studies that address the direct and indirect effects of big data analytics capabilities (BDAC) on organizational agility (OA) as an antecedent of firm competitive advantage. Second, the prior literature has debated the relationship between BDAC, EO, and OA separately. This study is unique in developing a holistic model to assess the connections between these constructs. Third, during the analysis procedures, the Arabic version of the constructs and sub-constructs had been validated using discriminant and convergent validity tests; as such, practitioners and academics can adopt them for future projects in Jordan or even other countries. Fourth, Côrte-Real et al. (2017) reports that studies that have demonstrated potential payoffs of big data have focused on developed countries. Present study advance BDAC research by assessing its outcomes in Jordan as an example of a developing country.
Implications for Managerial Practice
In parallel to theoretical contributions, this study offers valuable managerial implications for decision-makers to maintain and improve agility by efficiently exploiting big data analytics capabilities through realized innovative, proactive, and risk-taking entrepreneurial orientation. First, despite the surge in developments in big data technology during the last 10 years (Rialti et al., 2018; Sivarajah et al., 2017), top management have some concerns to invest in data-driven methods due the lack of related knowledge, the cost of implementation, and the ambiguity around the benefits in the short-term. The findings from this study, present the proof that decisions which rely on big data analytics can indeed entail profitable organizational returns (agility) if accompanied with a propensity toward innovation, pro-activeness, and risk-taking. Second, relying on the analysis results of the measurement model, executives and consultants involved in digital data and real-time analytics and strategy development can identify the influencing components of big data analytics capabilities and entrepreneurial orientation to develop business agility. Third, results denote that 42% of entrepreneurial orientation (EO) can be explained by the possess of big data analytics capabilities. Thus, managers should keep their eye on the developments of IT-related technology (Big data) to enhance the EO, which responsible for the mechanism of generating, orchestrating, and utilizing the required resources and capabilities to sense, analyze, and respond to business opportunities and threats in real time. Furthermore, Wiklund and Shepherd (2005) and Tahmasebifard et al. (2017) uncovered that organizations that have a degree of entrepreneurial orientation in their organizational processes are able to overcome environmental uncertainty. In simple words, decision-makers should have entrepreneurial capabilities (i.e., innovation, proactiveness, and risk-taking) to be more agile in their decisions to achieve a company vision and objectives even in a rapidly changing environment.
Limitations and Directions for Future Research
Despite the favorable implications of this study, there are some limitations that can serve opportunities for improvement for future research. these limitations have been categorized into three main categories as the following: (1) Data collection—the current study assesses the constructs of the research based on top management perceptions, the reason behind that is top managers have a comprehensive knowledge of a firm’s resources and its strategic issues. The data collected are the result of one response per firm over a specific period of time. This approach of data collection could involve in a risk of common method bias. Common method bias assessment test was conducted, thus revealing that their method bias is not likely. However, future studies can include multiple sources of data to further mitigate the chance of this bias. Moreover, longitudinal study can be performed to explore the impacts of big data analytics capabilities on organizational agility over a long period of time. (2) Scope—the article examines the connection between BDAC and OA at the organization level. furthermore, the data set reflect the responses of manufacturing firms among Jordan. For future studies researchers might focus on service sector within the scope of business unit or departmental level, which may establish new business insights into the capabilities of big data analytics. (3) Research approach—this study follows a quantitative approach to explain the value of BDAC. The outcome demonstrates that organizational process (entrepreneurial orientation) enables the effects stem from BDAC. Future research could use a hybrid approach (quantitative with qualitative) by integrating different ways of knowing to improve understanding of the findings.
Footnotes
Appendix A
Organizational Agility Indicators.

| Construct | Content |
|---|---|
| Market capitalizing agility (MCA) | (1) Our firm deals with market-related chaos as opportunities to capitalize on them rapidly. |
| (2) We are quick to apply appropriate decisions in the face of market/customer changes. | |
| (3) Our firm permanently looks for ways to reinvent/reengineer its business to better serve our target market. | |
| Operational adjustment agility (OAA) | (1) Whenever there is a disruption in supply chain from our suppliers, we can quickly adopt the alternative internal adjustments. |
| (2) Our firm can quickly scale up or down production/service levels to support fluctuations in the market demand. | |
| (3) We rapidly fulfill demands of our customers; our customers have confidence in our ability. |
Appendix B
Loading of the Indicator Variables.

| Construct | Item | DCC | OL | TS | MGS | BDAI | INO | PROA | RISK | MCA | OAA |
|---|---|---|---|---|---|---|---|---|---|---|---|
| Big data analytics capabilities | DDC1 | 0.70 | |||||||||
| DDC2 | 0.78 | ||||||||||
| DDC3 | 0.75 | ||||||||||
| DDC4 | 0.77 | ||||||||||
| OL1 | 0.79 | ||||||||||
| OL2 | 0.81 | ||||||||||
| OL3 | 0.84 | ||||||||||
| OL4 | 0.82 | ||||||||||
| TS1 | 0.82 | ||||||||||
| TS2 | 0.88 | ||||||||||
| TS3 | 0.86 | ||||||||||
| TS4 | 0.75 | ||||||||||
| MGS1 | 0.89 | ||||||||||
| MGS2 | 0.86 | ||||||||||
| MGS3 | 0.90 | ||||||||||
| MGS4 | 0.85 | ||||||||||
| BDAI1 | 0.85 | ||||||||||
| BDAI2 | 0.84 | ||||||||||
| BDAI3 | 0.79 | ||||||||||
| BDAI4 | 0.85 | ||||||||||
| Entrepreneurial orientation | INO1 | 0.82 | |||||||||
| INO2 | 0.87 | ||||||||||
| INO3 | 0.77 | ||||||||||
| INO4 | 0.79 | ||||||||||
| INO5 | 0.83 | ||||||||||
| RISK1 | 0.78 | ||||||||||
| RISK2 | 0.78 | ||||||||||
| RISK3 | 0.80 | ||||||||||
| RISK4 | 0.77 | ||||||||||
| PROA1 | 0.76 | ||||||||||
| PROA2 | 0.77 | ||||||||||
| PROA3 | 0.81 | ||||||||||
| PROA4 | 0.74 | ||||||||||
| PROA5 | 0.74 | ||||||||||
| Organizational agility | MCA1 | 0.73 | |||||||||
| MCA2 | 0.86 | ||||||||||
| MCA3 | 0.79 | ||||||||||
| OAA1 | 0.79 | ||||||||||
| OAA2 | 0.75 | ||||||||||
| OAA3 | 0.85 |
Note. DDC = data-driven culture; OL = organizational learning; TS = technical skills; MGS = management skills; BDAI = big data analytics infrastructure; INO = innovativeness; RISK = risk-taking; PROA = pro-activeness; MCA = market capitalizing agility; OAA = operational adjustment agility.
Appendix C
Higher-Order Loading Scores.

| BDAC | EO | OA | |
|---|---|---|---|
| 1. Data-driven culture | 0.71 | ||
| 2. Organizational learning | 0.76 | ||
| 3. Technical skills | 0.91 | ||
| 4. Management skills | 0.84 | ||
| 5. BDA infrastructure | 0.75 | ||
| 6. Innovativeness | 0.90 | ||
| 7. Risk-Taking | 0.52 | ||
| 8. Pro-activeness | 0.92 | ||
| 9. Market capitalizing agility | 0.91 | ||
| 10. Operational adjustment agility | 0.92 | ||
Note. BDAC = big data analytics capabilities; EO = entrepreneurial orientation; OA = organizational agility.
Declaration of Conflicting Interests
The author(s) declared no potential conflicts of interest with respect to the research, authorship, and/or publication of this article.
Funding
The author(s) received no financial support for the research, authorship, and/or publication of this article.