
Abstract
Rasch Analysis suggested the Lakaev Academic Stress Response Scale-1 (LASRS-1) would benefit from refinement by the addition of items and changes to the wording of other items. It was named the LASRS-2 and contained Four Domains (Affective, Behavioral, Cognitive, and Physiological). Rasch Model Analysis tested construct validity and internal reliability on a population of tertiary (university or college) level students (n = 2,000). Good person separation and item reliability estimates provided evidence that this tool was a reliable measure of academic stress. A Principal Component Analysis (PCA) of Rasch residuals showed the scale to be unidimensional. The results confirmed confidence in the replicability of scores due to sufficient item separation, agreeability, and that scores formed a continuum. Confirmatory Factor Analysis (CFA) was used as a secondary check to support findings of Rasch Modeling outcomes. The LASRS-2 was shown to be a valid and reliable psychometric tool that measured academic stress.
Stress is pervasive in life and a core issue influencing disease (Braun et al., 2016; Crosswell & Lockwood, 2020; Hall et al., 2006). Societies worldwide seem to have become more stressful, resulting in higher incidences of stress-associated complex disease (Schmidt et al., 2008). This can result in increases in metabolic syndrome, cardiovascular disease, psychiatric disorders, and cellular aging, such as lowered telomerase activity (Epel et al., 2004). Particular cohorts are more prone to excessive stress (Martinak, 2012; Pozos-Radillo et al., 2014; Tan & Yates, 2011), and tertiary (university or college) level students have been identified as experiencing greater levels of stress than those not engaged in higher education (Misra & McKean, 2000; Moffat et al., 2004). This stress is often attributed to the increased pressure that academic stress places on student coping strategies when simultaneously addressing issues spanning work, study, and personal challenges (Michie et al., 2001; Offstein et al., 2004). Long-term academic stress can lead to heightened emotional responses to highlighted errors and/or issues with tertiary results (McArdle et al., 2014; Michie et al., 2001; Wu et al., 2014).
High levels of academic stress have been shown to cause academic deficiencies (Slade & Kies, 2015) resulting in negative consequences that can lead to mental health problems (Turner & McCarthy, 2017). It has been suggested that those who enter tertiary education with a history of trauma (or past mental health concerns) are at greater risk of poor tertiary outcomes (Boyraz et al., 2019; Cherry & Wilcox, 2020). It also identifies that students who have well-developed coping and personal growth skills can handle stress responses better when encountering a stressor event (Shigemoto & Robitschek, 2021) and lowered personal self-control can impede academic stress (Jeong et al., 2019; Pascoe et al., 2019). Student stress shows a strong relationship with food cravings, weight gain, negative mood, and has the ability to trigger drug use (Chen et al., 2020; Preston & Epstein, 2011). Other studies of tertiary students have suggested excessive academic stress diminishes somatic and psychological functioning necessary for success including attentional capacity, cognitive flexibility, and physical fitness with their down-regulation paradoxically increasing (rather than decreasing) stress (Baumeister, 1984; Duan et al., 2015; Gendolla, 2006; Ye et al., 2018). Academic stress can cause physiological changes, such as poor periodontal health in the form of greater plaque accumulation, gingival inflammation, and gum recession due to increased cortisol levels in saliva (Johannsen et al., 2010). Additionally, academic stress has been associated with adverse immunological reactions (Maydych et al., 2017) by triggering latent herpes virus (e.g., Epstein-Barr) outbreaks (Glaser & Kiecolt-Glaser, 2005). Thus, it is important to understand at what point a student’s perceived psychological pressure disrupts their ability to cope and learn. These factors propelled the development of the Lakaev Academic Stress Response Scale-1 (LASRS-1; Lakaev, 2009).
The Novel Coronavirus-2019 (COVID-19) global pandemic (World Health Organization [WHO], 2021) has generated turbulence in the lives of individuals, families, and tertiary level students across the globe (O’Byrne et al., 2020; Yang et al., 2021). Little is known about the degree to which online learning and separation from social supports have impacted tertiary student workloads. The use of distance education has become the norm, which has in turn changed communication styles between educators and students (Mosanya, 2021). The reliance on self-motivation to meet academic deadlines during the COVID-19 event has further exacerbated isolation and loneliness (Wang et al., 2020) and this has added an extra source of pressure for tertiary students (O’Byrne et al., 2020). As a result, student physical and mental health have been further adversely affected.
Stress (Folkman & Lazarus, 1991; Lazarus & Folkman, 1984) has been defined as the relationship and interaction between the individual and their environment, which for various subjective reasons can become an overwhelming experience that taxes or exceeds the person’s resources, thus endangering their individual wellbeing. Subsequently, one must question whether the COVID-19 pandemic (an environmental factor) has created a catastrophic level of academic stress (subjective student experience). Institutional support at times of crisis has been reported to be essential by Maunder et al. (2008). Mosanya (2021) supported this consideration by suggesting that tertiary institutions should focus on targeted interventions to ameliorate academic stress. Therefore, the refinement and further development of the Lakaev Academic Stress Response Scale-2 (LASRS-2) at this unprecedented historical juncture to help assess and monitor student academic stress seems essential.
Despite the benefits of measuring academic stress responses within tertiary settings, it has been inconsistently studied possibly due to a lack of reliable tools that measure academic stress responses (Crosswell & Lockwood, 2020). The study of academic stress has a long history (Cahir & Morris, 1991; Cheng & Hamid, 1996; Kohn & Frazer, 1986; Sandhu & Asrabadi, 1994) and continues to be researched (Alsulami et al., 2018; Bedewy & Gabriel, 2015; Feldt, 2008; Gadzella et al., 2012; Y. M. Lin & Chen, 2009; Oluwafemi & Agbolade, 2017; Stallman & Hurst, 2016); however, most academic stress psychometric questionnaires have significant limitations as they were designed to measure academic stress triggers rather than academic stress responses (Cohen et al., 2007, 1983; Crosswell & Lockwood, 2020). For example (Table 1), the Perception of Academic Stress Scale (PAS; Bedewy & Gabriel, 2015), the College Student Stress Scale (CSSS; Feldt, 2008), the University Stress Scale (USS; Stallman & Hurst, 2016), the Scale for Assessing Academic Stress (ASS; Oluwafemi & Agbolade, 2017), the Academic Stress Scale (ASS; Kohn & Frazer, 1986), the Student-life Stress Inventory-Revised (SSI-R; Gadzella et al., 2012), Acculturative Stress Scale for International Students (ASSIS; Sandhu & Asrabadi, 1994) and the Academic Stress Inventory (ASI; Y. M. Lin & Chen, 2009) measure academic stress triggers, within the tertiary environment.
Demographic Characteristics.

There are a few instruments that measure academic stress responses and those that have been developed have rarely been subjected to Rasch Analysis. These scales include the Student Academic Stress Scale (SAAS; Alsulami et al., 2018), the Student-life Stress Inventory-Revised (SSI-R; Gadzella et al., 2012), and the Chinese Stress Symptom Checklist (CSSC; Feldt, 2008). Academic stress responses directly relate to mental and physical health outcomes and provide quantifiable feedback to the researcher and the practitioner about what the current academic stress level is and which Domain/s (Affective, Behavioral, Cognitive, or Physiological) had most impacted the sufferer to help guide the development of an individualized therapeutic treatment plan (Cohen et al., 1983; Crosswell & Lockwood, 2020; Yaribeygi et al., 2017).
The refinement of the LASRS-1 creates an opportunity to develop a modern psychometric tool for use within research, clinical, and educational settings (Lakaev, 2009). The implementation of the LASRS-2 within tertiary academic institutions will encourage better student care. A measurement tool that has been subjected to Rasch Analysis (Wright, 1977) ensures the development of an easily assessable and usable pen-and-paper questionnaire. A systematic literature review by Crosswell and Lockwood (2020) stated that stress research had been applied in an unwieldy manner most likely due to a lack of consistent and reliable instruments. They suggested that all stress research needed the development of reliable and valid Patient-reported-outcome (PRO) measurement tools that assess stress by incorporating the Affective, Behavioral, Cognitive, and Physiological Domains within their instruments.
It is important to note that psychometric scales that measure academic stress responses can be multidimensional in nature and, as such, they may not be measuring the construct they claim to be measuring (Portoghese et al., 2020). This makes the LASRS-2 an important addition to the literature, to academic stress research and to the practitioner (clinicians and educators) tool-box as it will provide the capacity to measure and consequently monitor those suffering from tertiary stressors. The LASRS-2, by design, is intended to assess the Domains of Affective, Behavioral, Cognitive, and Physiological as well as the overall academic stress response of tertiary students.
A literature review supported the development of a robust, valid, and wide-reaching screening tool that targeted academic stress specifically, so that researchers, clinicians, and educators alike, would be able to understand and better support students (Barker et al., 2018; Crosswell & Lockwood, 2020; Pascoe et al., 2019). Stress researchers have often measured stress using unvalidated measures or have chosen only one type of stress to measure thereby, either missing entirely the type of stress they are assessing or underestimating the role stress played in predicting disease on-set or progression (Crosswell & Lockwood, 2020). The literature cited few singular scales used for assessing academic stress but rather a mixture of scales (or parts there-of) was placed within research designs (Barker et al., 2018). Many studies that were related to quantifying a measure of academic stress did not use psychometric instruments specifically designed to assess responses to academic stress levels (Duan et al., 2015; Jeong et al., 2019; Kuo et al., 2018; Lee, 2017; Magnavita & Chiorri, 2018; Maydych et al., 2017; You, 2018). Given the importance of understanding the role of academic stress in tertiary students, the LASRS-1 (Lakaev, 2009) was developed as a screening tool to address this construct. The LASRS-1 is a self-rated paper and pen-based psychometric questionnaire focused on the perceived experience of stress responses rather than historical stress exposure (triggers). Cohen et al. (1983) supported this approach by stating self-reported and self-rated questionnaires that targeted the perception of stressful events were a better predictor of health-related outcomes. Research has shown that it is important to evaluate a student’s stress response (or their perceived stress) prior to intervention, during, and at the completion of a therapeutic period to determine the effectiveness of the psychological treatment plan (Miller et al., 2020).
In 2006, items within the Lakaev Academic Stress Response Scale (LASRS) were generated from a review of the general stress and academic stress literature (Cohen et al., 1983) and was discussed with a Clinical Psychologist who counseled tertiary students suffering from academic stress. As a result, the Author selected 27-items which were then tested in a Pilot Study. A toal of 45 tertiary students volunteered and completed the 27-item LASRS as well as the Kessler-10 (Kessler et al., 2002), a measure of non-specific psychological distress. The results of these two measures were compared to determine Convergent Validity. The scale’s results were compared to an unrelated measure of political attitudes to assess Discriminant validity. The 27-items were then submitted to a Principal Components Analysis (PCA) which confirmed the 4-factor component structure of the psychometric questionnaire (i.e., the Affective, Behavioral, Cognitive, and Physiological Domains). Reliability analysis of the 4-factors using the leave-one-out procedure suggested the scale would be improved by discarding six items. The remaining 21-items yielded acceptable to excellent internal consistency ranging from 0.63 to 0.92 and became known as LASRS-1 (Lakaev, 2009).
A Confirmatory Factor Analysis (CFA) study was undertaken (Lakaev, 2009) to assess academic stress among a sample of 375 Australian university students. The study sought to determine if the structure of the LASRS-1 instrument aligned with the four academic stress response Domains (Affective, Behavioral, Cognitive, and Physiological) and if they accounted for a significant proportion of variance in participant stress scores. The CFA suggested a 4-factor solution was acceptable as it allowed for a succinct structure of items and factors and accounted for 54% of the variance (Lakaev, 2009). This provided evidence for Convergent and Divergent Validity and a good internal consistency was achieved.
The Lakaev (2009) research established the validity of the LASRS-1 that is, it was measuring academic stress. The LASRS-1 showed a high correlation with other stress measurement scales such as the Chinese Stress Symptom Checklist (CSSC; Cheng & Hamid, 1996), the Student-life Stress Inventory Scale (SSI; Gadzella, 1991), and the Depression, Anxiety, and Stress Scale-21 (DASS-21; Lovibond & Lovibond, 1995). This indicated that the LASRS-1 measured stress in alignment with other self-rated stress scales. Specifically, the LASRS-1 had high correlations with the DASS-21 Stress Sub-scale and moderate correlations with the DASS-21 Anxiety and Depression Sub-scales indicate the LASRS-1 21-items were measuring academic stress.
It is important to note at this juncture that the LASRS-1 is one of the most statistically developed academic stress scales for research (Bernstein & Chemaly, 2017). To date, the LASRS-1 has been cited 42 times in peer reviewed journal articles and many times in varying Dissertations. The LASRS-1 has been used for research in the United Kingdom, America (USA), New Zealand, and Australia as well as other English speaking countries (Gonzalez-Morales & Neves, 2015; Winter & Depaoli, 2020). The LASRS-1 has been translated into other languages, including, Iranian, Filipino, Pakistani, and Indian (Bernstein & Chemaly, 2017; Chouhan & Kumar, 2011; Kumar et al., 2016). As the LASRS-1 has been used widely and in differing contexts it was decided that it would be prudent to improve the scale’s overall usability. This propelled the drive to improve the LASRS-1 not only for clinical and educational settings but for research as well.
In Lakaev (2012), further testing of the LASRS-1 was undertaken using the technique of Rasch Modeling which had emerged as a powerful analysis tool for validating a psychometric instruments (Bond & Fox, 2007; Shea et al., 2009). The suitability of using all items within the LASRS-1 as a measure of general psychological distress was explored. Rasch Modeling outcomes suggested that refinement of the LASRS-1 would be beneficial for the overall psychometric instrument’s validity and reliability. Refinement could improve LASRS-1 as a measurement tool for academic stress in research, clinical, and educational settings. On this basis, the five items removed (Lakaev, 2006) were reinserted (Items 3, 8, 26, 20, and 26) and three items reworded (Items 2, 17, and 23). The refined scale had 26-items and was named the LASRS-2.
It is important to note that self-evaluation tools are susceptible to faking (Kubinger, 2009) and this factor should be considered when developing this type of psychometric scale. By design the LASRS-2 is implemented by a practitioner to determine if clinical intervention is appropriate for the student suffering academic stress. As the LASRS-2 is a first-line psychometric measure that captures academic stress responses, not an assessment of personality, no fail-safe for faking was embedded within the LASRS-2. It had been decided for practical purposes that this would be more appropriately addressed at the time of clinical therapeutic intervention.
As a final check before the LASRS-2 was subjected to Rasch Modeling, the 26-items were assessed against the Crosswell and Lockwood (2020) best-practice approach for measuring stress guidelines. In alignment with this, each item was reviewed to ensure they individually measured a stress response through the self-reporting of perceived stress that related to specific stressors within one’s life circumstances (Cohen et al., 1983; Crosswell & Lockwood, 2020). In the case of the LASRS-2 the items were indicated to be causally related to academic stress. Language for how to describe stress-related constructs were clearly outlined by Crosswell and Lockwood (2020) and included the Domains of Affective, Behavioral, Cognitive, and Physiological that occur before, during or after exposure to particular types of stress. It was found that each of the 26-items were in alignment with the Crosswell and Lockwood (2020) stress measurement guidelines. The 26-items also followed the Domains of Psychological (Affective), Behavioral, Cognitive, and Physiological as suggested by Crosswell and Lockwood (2020).
To further verify the validity and reliability of the refined the LASRS-2 this paper described the findings of Rasch Modeling and a CFA to confirm and support the Construct Validity and internal reliability of the LASRS-2 as a psychometric instrument that assesses academic stress (Lin & Pakpour, 2017) for research, clinical, and educational settings.
Method
Recruitment and Source Data Collection
Participants were recruited from an Australian university student population after approval was gained from the Human Research Ethics Committee. Researchers approached students within libraries, food courts, student spaces, and outdoor common areas. Students were given an Explanatory Statement outlining the details of the study and were encouraged to read the statement. Any questions about the study and participation within it were answered verbally. Respondents gave signed informed consent. There was no deception about the nature of the study. The explanatory and consent documents explained the exact nature of the study. Students then completed the refined 26-item LASRS-2 (a self-rated, paper, and pen-based survey) and a structured Demographic Questionnaire focusing on age, gender, marital status, current education level, area of study, sources of financial support, country of nationality, and first language. Where language was a barrier, researchers supportively explained the paperwork. Researchers remained visible in the area for respondents to ask questions, then collected the relevant documents after approximately 15 minutes. Participants were provided with a debriefing letter that included information about student counseling services should questions in the survey raise concerns for respondents with regards to academic stress. Questionnaires were anonymous and identified by code only and were not linked to a student’s identity nor student records.
Students (n = 2,000) were recruited from various common areas within the university grounds. Data was collected across Semester One and Semester Two of the same year in the two-weeks leading-up to exams and end of semester assignment submissions. Ewing et al. (2009) stated that for the purpose of calibration of a Rasch psychometric instrument the sample population does not need to be a true random sample but instead a diverse sample is preferred so that testing for misfit could be established. Rasch sampling requirements are looser than what is required for classical statistics (Ewing et al., 2009; Wright, 1977) and as such, the sample reflected the real-life and every-day environment of a university population in the two-weeks prior to the end of semester. In effect, no statistical assumptions regarding the sample are required and it is essential that the subjects are as diverse as the actual target population (Bond & Fox, 2007).
LASRS-2 Measure
The LASRS-2 is a 26-item, self-rated, paper, and pen-based questionnaire that provides a measure of academic stress response across four Domains: Affective, seven questions, 5, 6, 15, 20, 22, 23, and 24 (e.g., “I felt emotionally drained by university”); Behavioral, six questions, 2, 3, 10, 14, 16, and 18 (e.g., “I yelled at family and friends”); Cognitive, seven questions, 1, 4, 7, 9, 13, 19, and 21 (e.g., “I had trouble concentrating in class”); and Physiological, six questions, 8, 11, 12, 17, 25, and 26 (e.g., “I had headaches”). Respondents rated how much of the time they experienced symptoms on a 5-point Adjectival Rating Scale with the anchors: “None of the Time” (1); “A Little of the Time” (2); “Some of the Time” (3); “Most of the Time” (4); and “All of the Time” (5). Individual items were summed for an Overall LASRS-2 score. Higher scores indicated a greater academic stress response.
Rasch Modeling
Rasch Modeling was conducted using WINSTEPS (Linacre, 2020). All 26-items were included in the model to determine if the items represented a unidimensional construct by evaluating their fit to the Rasch Model. This model requires unidimensionality as a condition of fit. Once unidimensionality is established then goodness-of-fit, item characteristics, inter-item correlations, rating scale categories, and item-person performance are assessed through Rasch Modeling. This analysis enabled the evaluation of the validity of an overall score for the LASRS-2 as a measure of academic stress response. Where these tests were satisfied and assumptions held, the overall scale was viewed as a unidimensional construct (Linacre, 2020). Finally, a CFA was performed to confirm the 1-factor structure of the Overall LASRS-2 as well as 4-factor testing of the LASRS-2 four academic stress Domains (Lin & Pakpour, 2017).
Unconditional Maximum Likelihood Estimation as used in WINSTEPS Rasch Modeling (Linacre, 2020; Wright & Bell, 1977) is subject to a bias that depends on the number of persons and items in the data set (Kubinger et al., 2009, 2011, 2012) and involves a symmetrical estimation of persons and items that is convenient from a practical point of view, whereas Conditional Maximum Likelihood is not symmetrical (Linacre, 1998, 2004). Despite this bias, when Unconditional Maximum Likelihood Estimates are graphed against Conditional Maximum Likelihood Estimates they form a straight line, albeit not on the identity line (Boone & Staver, 2020). However, from a practical application perspective a linear transformation of the logit scale to a more user-friendly scale is the intention for the LASRS-2 especially as probabilities are not being estimated directly. Consequently, the difference between the two methods is not relevant (Boone & Staver, 2020) for this particular study. As we are not using Conditional Maximum Likelihoods there was no need to implement the Anderson Likelihood test (a type of Conditional Maximum Likelihood Estimation). WINSTEPS Unconditional Maximum Likelihood Estimates (Linacre, 1998, 2020; Wright & Panchapakesan, 1969) are advantageous for the following reasons: they are independent from specific person and item distributions; they have flexibility with missing data, analysis test lengths and sample size; they have flexibility with person, item, and rating scale structures; and are interchangeable with total raw scores and item measures (Linacre, 1998; Wright & Panchapakesan, 1969). Hence, Unconditional Maximum Likelihood was implemented within this study.
Confirmatory Factor Analysis
Two separate CFA (Kline, 2016) were used to examine the construct validity of the LASRS-2 (a one 1-factor model and one 4-factor model). The 4-factor model investigated the latent construct of the LASRS-2 four stress Domains (Affective, Behavioral, Cognitive, and Physiological) while the 1-factor model focused on the overall (all 26-items) construct of academic stress. Assumptions of adequate sample size, missing values, normality, linearity, outliers, singularity, and multi-collinearity were assessed prior to implementing each CFA to confirm the LASRS-2 data-set was suitable for factor analysis. The LASRS-2 uses a 5-point Adjectival Rating Scale therefore, Robust Diagonally Weighted Least Squares (RDWLS) was used as the estimator rather than Maximum Likelihood (ML). The cut-offs for the different fit indices used to determine an acceptable model included the Normed χ2 (i.e., χ2 value divided by the degrees of freedom) <3, the Comparative Fit Index (CFI), and the Tucker-Lewis Index (TLI) >0.95, Root Mean Square of Error Approximation (RMSEA), and the Standardized Root Mean Square Residual (SRMSR) <0.08 (Kline, 2016; Lin & Pakpour, 2017). Each CFA was analyzed using the Lavaan package in the R software (Rosseel et al., 2021).
Results
Participants
Two thousand (Table 1) Australian university students consented to participate (n = 990 females and n = 1,010 males). The mean (M) age of participants was 22.6, with a standard deviation (SD) of 4.1, and ranged from 15 and 5 months to 53 years old. The sample comprised: 1283 Undergraduate Students; 213 Master Students; 391 Postgraduate Students; 75 Doctoral Students; and 38 Other. Recruitment included a multicultural sample: 475 Australians; 42 Canadians; 665 East Asians; 514 Other Asians; 155 Europeans; 113 USA; and 36 Other.
Dimensionality
Rasch Modeling (Linacre, 2020) was used to determine if all items of the LASRS-2 represented a unidimensional measure of academic stress. To examine dimensionality, a PCA of the residuals was undertaken. This was conducted to determine if any extra dimensions were present in the data that is, beyond the primary component to a degree not explainable by random error or noise. An eigenvalue score <2 supported unidimensionality (Linacre & Tennant, 2009). The PCA attributed 53.7% of the variance to the LASRS-2, leaving 46.3% of variance being attributed to other factors. Of the variance, 22.0% was explained by the LASRS-2 items and 6.4% was unexplained in the first contrast. The data gives an eigenvalue of 12.3, suggesting approximately 12 items were contributing to the attributed variance. Support for this was found when consulting the first unexplained eigenvalue of 3.6 as four items were contributing to a latent dimension. According to Linacre (2020) more variance existed than due to noise and indicated another dimension may be being measured.
To investigate what attributing factors may have caused this latent dimension the specifics of the contrasts were consulted (Figure 1) to determine whether the underlying dimension was conceptually different to academic stress or whether it was a general characteristic of academic stress. Inspection of the demographic data of persons responding at this level did not indicate any pattern that would explain the results. The wording of items was then consulted to determine whether they reflected two separate dimensions. Figure 1 showed three clusters of items loosely separated vertically. Cluster 1 and 3 were the most significant due to the distance of their vertical separation. Vertical separation is important as it may indicate a separate measure is present. Cluster 1 and cluster 3 were assessed in case they were measuring a different dimension. Correlations between participants in cluster 1 and cluster 3 showed a first contrast Observed Pearson Correlation of .72. A positive correlation of >.7 is more likely to be measuring the same attribute (Linacre, 2020). It was determined the 26-items were measuring overall academic stress. This meant the LASRS-2 was a unidimensional measurement tool suitable for further Rasch Modeling that is, persons measured within different clusters had a high enough correlation to be treated as unidimensional.

Standard residual contrast plot for dimensionality investigation.
Goodness-of-Fit
Table 2 details the Overall LASRS-2 goodness-of-fit to the Rasch Model. The results displayed the spread of person positions and item positions. Results indicated a person separation of 4.43 and a person reliability statistic of .95 indicating good reliability in the instrument’s ability to measure varying levels of academic stress. Therefore, the LASRS-2 measured persons on a well-articulated scale. This result implied differences in academic stress were not due to error of measurement and that the LASRS-2 was able to identify differing levels of academic stress in respondents (Bond & Fox, 2007). An item separation of 11.58 and item reliability statistic of .99 provided good evidence that differences in item agreeability were not due to measurement error. This provided confidence that the LASRS-2 would replicate results in the future and there was sufficient item agreeability separation and rating scale agreeability levels to form a continuous measurement on the continuum.
26-Item LASRS-2 Rasch Modeling Summary Statistics.

Examination of the Model Fit information in Table 2 revealed that the item goodness-of-fit statistics fell within the acceptable range. Item infit Mean Square (MSQ) ranged from 0.80 to 1.33 (M = 1.0) and standardized values between −7.21 and 9.85 (M = −0.22). Item outfit MSQ ranged from 0.79 to 1.32 (M = 0.99) and standardized values between −7.16 and 9.44 (M = −0.42). Person misfit suggested that a relatively large number of person responses were different from the expected values calculated for those items by the Rasch Model. Such misfits sometimes have diagnostic value but in general they reduce the confidence with which we can claim to have measured that person’s level of academic stress (Bond & Fox, 2007). The Model Fit information suggested that not all participants fell into the acceptable range needed to conform to expectations of the Rasch Model (Bond & Fox, 2007). Person infit MSQ statistics ranged from 0.06 to 5.74 (M = 0.99) and standardized values between −7.13 to 9.29 (M = −0.29). This indicated large misfit for persons on items measuring symptoms of extreme low and extreme high academic stress. Person outfit MSQ ranged from 0.06 to 5.71 (M = 0.99) and standardized values between −7.16 and 9.55 (M = −0.30) indicated a large misfit for one or more persons at both extreme ends of the academic stress scale. This is not considered an issue as this study is focused on the Construct Validity of the 26-items. The persons tests are an aid in researching the LASRS-2 individual 26-items and as such do not impact on this research’s outcomes.
Item Characteristics
The Item Characteristics calculate the expected response of a participant on each item giving their estimated level of stress (as calculated across the LASRS-2) when the responses perfectly fit the Rasch Model. Table 3 details item agreeability scores, Fit Statistics along with observed and expected item-whole correlations for each item of the LASRS-2. As the LASRS-2 employs a 5-point Adjectival Rating Scale the agreeability of an item is defined by convention to be the point on the scale at which the lowest and the highest rating scale categories are equally probable, generally a point near the center of the rating scale (Linacre, 2020). Results in Table 3 suggested all of the individual LASRS-2 items provided good internal consistency within the Rasch Model as the MSQ and standardized infit and outfit values fell within the recommendation of 0.5 to 1.5 (Scott et al., 2009).
Rasch Modeling Agreeability (Difficulties), Fit Statistics, and CFA Loadings.

Note. Loadings are derived from a 1-factor CFA model. Infit = information-weighted fit statistics; Outfit = outlier-sensitive fit statistics; MSQ = mean square.
Inter-Item Correlations
Point-biserial correlation coefficients (Table 3) should be positive and large enough (>.2) to show an acceptable relationship between the item construct (Bond & Fox, 2007). The results reflected this. Point-biserial correlation coefficients were positive and ranged between .57 and .76. All 26-items were above .2. This indicated an acceptable relationship between the item and the construct. Item 1, Item 13 and Item 18 illustrated the greatest deviation from the Rasch Model with higher infit and outfit values and lower Point-biserial correlations. However, removal of Item 1, Item 13, Item 18, or combinations of these items failed to improve person separation and reliability indicating that any improvements caused by removing these three items did not compensate for the resulting loss of information. Dimensionality of the unexplained variance in the first contrast gave an eigenvalue score of 3.2, which displayed only a minor improvement. It was decided that Item 1, Item 13, and Item 18 should not be removed, as removal would have reduced the diagnostic power of the LASRS-2 (Scott et al., 2009).
Rating Scale Categories
Probability curves display the 5-point Adjectival Rating Scale response categories (Table 4). All categories were sufficiently used and understood by persons. Hence, the Step Measurement (i.e., the points at which successive categories are equally probable and the curves cross) are correctly ordered and the peaks well-articulated (Linacre, 2020). Table 4 showed the agreeability level of responses tested for the 5-point Adjectival Rating Scale on three metrics. This scale monotonically increased in both Average Measure and Step Measure with no disordering. Only Category 5 (“All of the Time”) had infit and outfit MSQ > 1.5. This suggested a misfit but for practical purposes <2.0 is often considered suitable (Linacre, 2020). In this case, a misfit in the top category arises from a discrepancy between the Average Measure (i.e., the average logit ability used to generate ratings) of Category 5 and the Expected Measure. While of mild statistical interest, this discrepancy is not large enough or sufficiently problematic to justify disregarding the top category or merging it with Category 4 (Linacre, 2020). Hence, the misfit of the Category 5 curve highlighted within the Rasch Model was not considered detrimental to the LASRS-2 person responses and was left unchanged.
LASRS-2 5-Point Adjectival Rating Scale Response Disordering Tests.

Note. Infit = information-weighted fit statistics; Outfit = outlier-sensitive fit statistics; MSQ = mean square.
Item-Person Performance
The Item-person Map or Wright-Map (Figure 2) for the Overall LASRS-2 illustrated the person ability and item agreeability distributions and their relative positions. An optimally targeted instrument will show the two distributions approximately opposite each other on the scale. Items are shown by name with the most frequent being at the bottom of the map and the least frequent at the top. Items that are more agreeable have lower measured scores whereas those with higher measured scores indicated items that were less agreeable to answer. Both logits and SD units are shown. The central scale SD units are shown as standard deviation (S) and two standard deviations (T) above and below the mean (M).
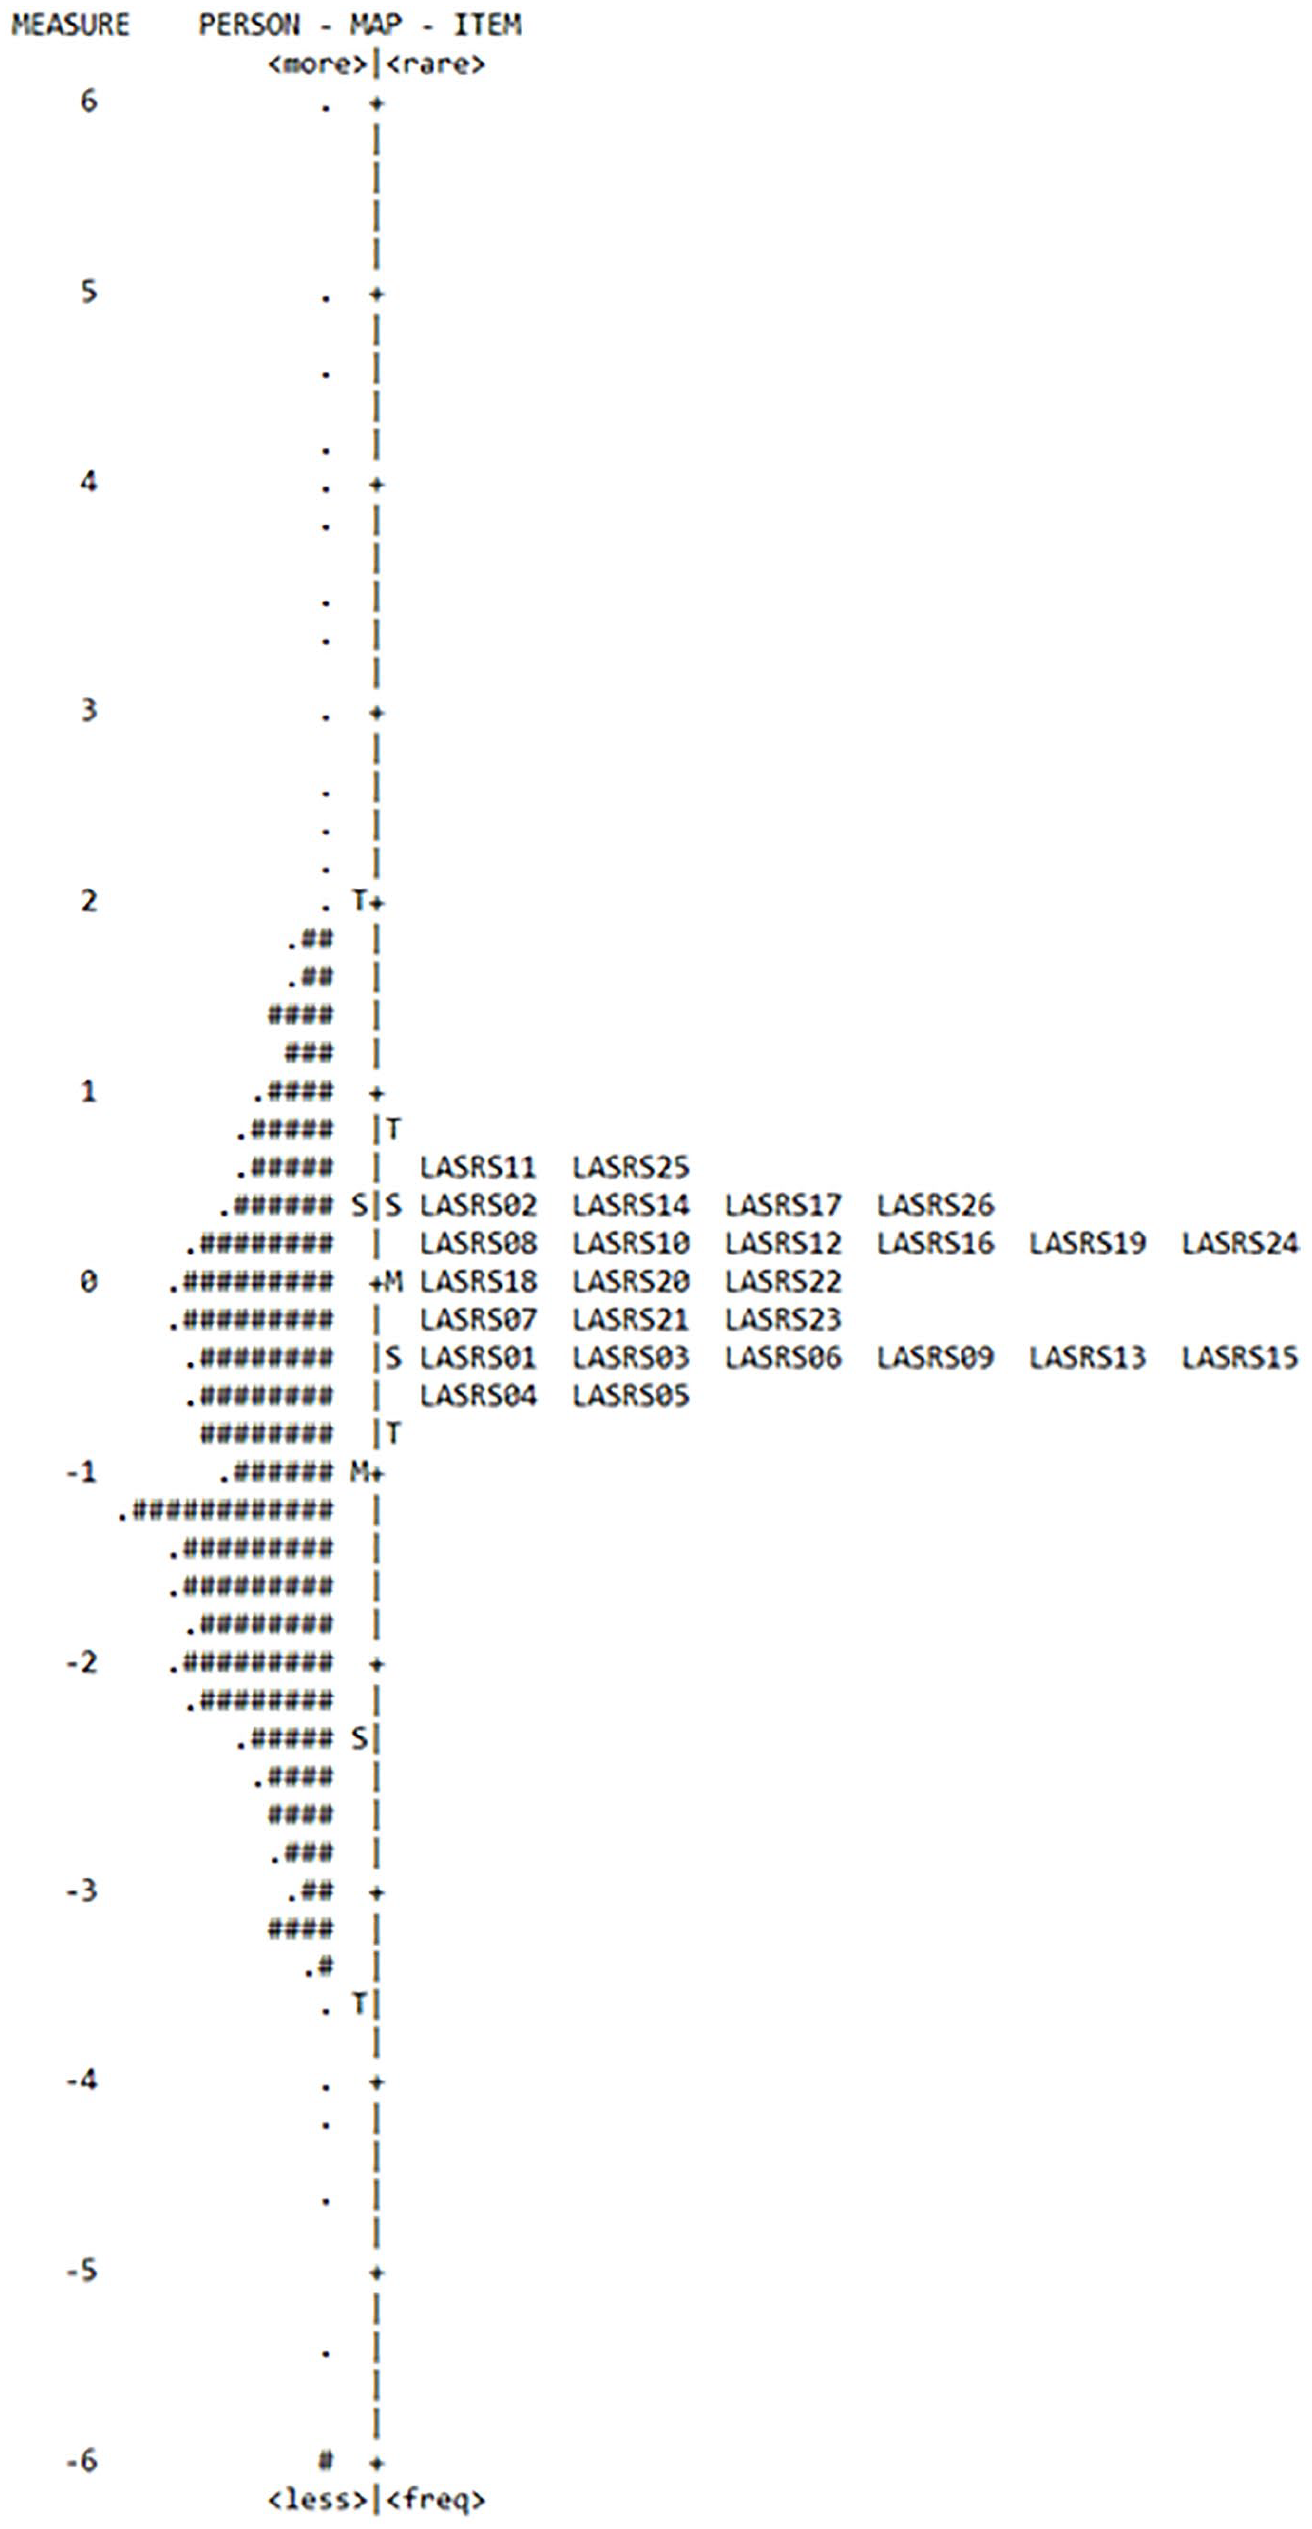
Overall LASRS-2 item-person map Wright-map.
While the item agreeability range appears narrower than the person ability range (Table 2), this does not take into account the span of the rating scale around each item which is roughly 4 logits (Table 4). Thus, the step agreeability from Category 1 (“None of the Time”) to Category 2 (“A Little of the Time”) occurs around one SD below the mean of the person distribution. The LASRS-2 would benefit by having more items that are easier to agree with. However, as this psychometric scale is targeted at populations likely to be experiencing high academic stress this was not viewed as a limitation for the LASRS-2. It was concluded that the items were reasonably well-targeted for persons with higher levels of academic stress who are the focus of this measurement instrument.
Confirmatory Factor Analysis Overall LASRS-2
As a check on results produced by Rasch Modeling, a CFA (Table 5) was conducted (C.-Y. Lin & Pakpour, 2017). The CFA results in Table 5 showed that the two models (i.e., one 1-factor model and one 4-factor model) were satisfactory (or close to acceptable) in the data-model fit indices. This included the CFI (0.99), the TLI (0.98–0.99), the RMSEA (0.041–0.053), and the SRMSR (0.045–0.055) as depicted in Table 5. The only exception was the Normed χ2 (4.4–6.5). The Model Fit statistics presented in Table 5 showed that inter-item correlations and factor loadings were significant (>0.3) as recommended by Hooper et al. (2008). The Model Chi-Square assessment for overall fit and discrepancy between the sample and the fitted covariance matrices was statistically significant. The factor analysis was robust to breaches of sphericity as the sample size (n = 1,992) was large (Kline, 2016). This test is considered a stringent estimation of goodness-of-fit and unrealistically seeks to find a model that perfectly matches the population (Byrne, 2001; Hooper et al., 2008). The alternative, Normed χ2 (χ2/df ratio) was assessed and was found to be >3 degrees-of-freedom. This indicated a poor goodness-of-fit (Hooper et al., (2008); C.-Y. Lin & Pakpour, 2017). Importantly, the TLI and the CFI are not sensitive to sample size and compares the fit of the target model to the fit of an independent model (Kline, 2016). These are 0.98 and 0.99 respectively, making it an acceptable fit. The RMSEA, also a Model Fit Statistic, represented a parsimony-adjusted index with values closer to 0 representing a good fit (Kline, 2016). The cut-off was between 0.041 and 0.053. The p-value for the RMSEA is statistically significant (95% CL at 0.022). It is important to note, the RMSEA is hard to interpret when using an Adjectival Rating Scale. The SRMSR was calculated instead as it is better suited to Adjectival Rating Scales (Kline, 2016). The result was below the 0.08 cut-off and close to 0. Hence, the SRMSR indicated a good Model Fit at 0.045 to 0.055. Thus, the model’s validity statistics showed acceptable internal consistency and reliability (0.87–0.96) and as such, each of the individual LASRS-2 26-items contributed positively toward measuring academic stress. Finally, the 4-factor model (Table 5) did show at least two highly correlated factors to near perfect correlations between the latent variables and thus most likely lacked Discriminant Validity between the factors. This suggested that the LASRS-2 was a unidimensional scale and that the Domains were not necessarily separate sub-scales within this instrument. This further supported the LASRS-2 as a unidimensional scale.
LASRS-2 Confirmatory Factor Analysis (CFA) and Model Validity Measures.

Note. Normed χ2 = χ2 divided by degrees-of-freedom (df). CFI = comparative fit index; TLI = Tucker-Lewis index; RMSEA = root mean square of error approximation; SRMSR = standardized root mean square residual; CI = confidence interval.
Discussion
This study used Rasch Modeling to assess the psychometric properties of the LASRS-2 and to confirm whether the 26-items cohere to form a unidimensional construct indicative of overall academic stress. The results were discussed according to dimensionality, item characteristics and item-person performance for all the LASRS-2 items. Finally, a CFA was performed. The CFA agreed with Rasch Modeling results.
Rasch Modeling residuals showed the LASRS-2 to be unidimensional after a PCA was performed. Analysis of the Overall LASRS-2 provided strong evidence of acceptable fit to the Rasch Model. The item and person separation statistics showed adequate separation and reliability. Hence, the LASRS-2 is reliable in measuring varying levels of academic stress, meaning that much of the variation in person measures are assumed to not be due to random error. Subsequently, this study concluded that measured differences on the academic stress scale are not due to error of measurement. Good person separation and item reliability estimates provided further evidence that the LASRS-2 is a reliable measure of academic stress responses (Linacre, 2020). The results confirmed confidence in the replicability of scores for the LASRS-2 due to sufficient item separation, agreeability, and that scores formed a continuum along the measurement scale.
The results suggested items had more agreeability than the person academic stress measures, on average, which meant the LASRS-2 better measured higher thresholds of academic stress than lower academic stress thresholds. This is not considered a concern, first, because the 5-point Adjectival Rating Scale spans most of the person sample reasonably well, and in any case, LASRS-2 is intended for research, clinical, and educational settings and has been researched at a tertiary level during exam periods at each stage of its development (2006, 2009, 2012, and 2016).
Regarding individual item characteristics, the MSQ and the standardized infit and outfit values provided insight into which items did not fit well with the rest of the scale. Item 1, Item 13, and Item 18 were the most concerning but they met the threshold values (Scott et al., 2009) even though they represented the greatest deviation from the model. Removal of Item 1 or Item 13 or Item 18 (individually or a combination of) did not improve the LASRS-2 person reliability statistics or alter the dimensionality of the instrument in any important way. The high values of the Point-biserial coefficients indicated that all items in the scale had an acceptable relationship between each item and construct. It was concluded that all 26-items were to remain within the LASRS-2 to maintain the diagnostic power of the instrument.
Inspection of the Overall LASRS-2 Wright-Map, notwithstanding the 4-logit span of the rating scale, showed a moderate mismatch between the item agreeability distribution and the person stress distribution. This supported that the scale may be improved by including items that measured low academic stress (Green & Frantom, 2002). However, the LASRS-2 is intended to be used on tertiary student populations experiencing high academic stress, hence, this finding does not indicate a limitation. Regarding the 5-point Adjectival Rating Scale, the probability curve, and Step Measures confirmed that it was adequate for the academic stress trait being measured as all categories were utilized and behaving according to expectations for the Overall LASRS-2 (Linacre, 2020). Finally, the CFA Model Validity Measures and the Rasch Modeling person reliability statistics are above 0.95, therefore, supporting the claim that the LASRS-2 is likely to yield reproducible academic stress measures. These findings supported the LASRS-2 as a reliable and valid measure of academic stress responses.
The ongoing benefit of the refined LASRS-2 is that it measures academic stress along one continuum and in one psychometric scale rather than two or more. The LASRS-2 has eliminated the cumbersome use of multiple instruments and psychometric scales within one study. Potential researchers have the benefit of increased simplicity and the statistical accuracy that the LASRS-2 now provides. Hence, the refinement of the LASRS-1 to develop the LASRS-2 is a valuable contribution to research and the literature in the area of academic stress. Importantly, the refined LASRS-2 has the ongoing benefit of better supporting researchers, clinicians, and educators in the amelioration of academic stress.
Limitations
The LASRS-2 may not measure lower levels of academic stress well but rather focused upon higher levels of academic stress. It is also important to note that the 5-point Adjectival Rating Scale implemented covers 4 logits of the persons range (1 SD below and 2 SD above persons M). This indicated that the LASRS-2 is highly accurate in terms of Rasch Modeling outcomes. However, exposing the LASRS-2 to analysis outside of academically stressful events (e.g., exam times) to further develop base-line data should be researched for completion. Anomalous results from students who complete the LASRS-2 have not been addressed within this study and a Rasch Keyform Plot needs development to address this issue when guiding students from differing cultures, faculties, and levels of education suffering academic stress. This study focused on Australian university students with demographic data collected to specify cultural background and faculty enrolment. The current study has not explored outcomes in relation to academic stress within differing cohorts. Study outcomes in these areas need to be extracted from the current data-set. Gender Invariance (Measurement Invariance) testing is needed (via Rasch Modeling Gender Differential Item Functioning testing) to determine if there is a difference between Male and Female responses for each of the individual 26-items. Provisional Therapeutic-cut-off-score requires development, and no Interval Scaling has been developed and as such, one cannot determine whether tertiary level students are suffering normal, mild, moderate, high, or severe academic stress. This study was conducted in an uncontrolled manner throughout the university environment across two separate two-week periods in the 1 year. Therefore, respondents did not complete the questionnaire in a controlled environment and not all participants completed the LASRS-2 in the same context. The design was quasi-experimental, which was not ideal as it lacked a control group. The four Domains (Affective, Behavioral, Cognitive, and Physiological) theoretically represented separate sub-groups of stress. Hence, the stability of the Overall LASRS-2 scores and its four diagnostic Domains is unclear as no test-retest analyses have occurred as yet. Each Nationality (Culture) of Origin was grouped together based upon broad assumptions and categorization. The same can be said for Educational (Degree) Level, Faculty (Department), and Gender. Language may have also been a barrier as many of the students who participated in the study did not have English as their first language. One issue that has not been addressed concerns those students who were too academically stressed and had already dropped-out and therefore were not recorded in this data-set. There is no way to determine the direct impact that this cohort may have had on the results within this study. It must also be noted the LASRS-2 does not currently have the capacity to measure or assess if a student is faking their self-reported responses to gain advantage within their academic environment.
Future Research
For the LASRS-2 to be widely applied in research, clinical, and educational settings Measurement Invariance needs to be determined by instigating a Gender Invariance study to establish that each of the 26-items can be viewed identically by respondents regardless of Gender. In addition, because the Overall LASRS-2 is unidimensional the four Domains do not currently define separate factors or dimensions. Therefore, after adjusting for the difficulty of each Domain one may expect a student who fits the Rasch Model to obtain similar scores on each sub-scale (or Domain). This suggested a diagnostic opportunity that is, when a participant is found to perform differently on one or more of the sub-scales than one would expect based on his or her Overall LASRS-2 score that an aspect of the student’s experience may need to be explored individually, on a case-by-case basis. Future research will focus on this diagnostic aspect of the LASRS-2 Domains. Interval scaling for Optimal-cut-points is required and a Therapeutic-cut-off-score for when intervention should be instigated needs to be defined to determine when academic stress is nearing a critical level. This would ensure the LASRS-2 can be applied in research, clinical, and educational settings with confidence. To support the interval scaling and scores of the Overall LASRS-2 and its Affective, Behavioral, Cognitive, and Physiological Domains a Rasch Keyform Plot should be designed to be able to identify anomalous academic stress presentations. The Rasch Keyform will also allow for ongoing statistical data and informative collection so that eventually the LASRS-2 can be implemented to measure academic stress from pre-high school and high school onwards. Data within the current research relating to Gender (Male and Female), cultural background and faculty enrolment responses to academic stress need extraction to determine individuated outcomes to be able to better support tertiary students and the amelioration of their responses to academic stress. The above outlined future research is currently underway and will be published in the coming months. Also, the LASRS-2 requires further research in differing cultural and language contexts in the future so that it develops the broad application of its predecessor (LASRS-1). Most importantly, academic stress requires investigation during and after the COVID-19 pandemic event to measure how the changing academic environment has impacted the individual student with regards to face-to-face learning versus online learning and the resulting shift in social interactions with fellow students, lecturers and academic mentors. Another important focus for research would be in the area of faking LASRS-2 answers to gain advantage within particular university or college environments. Research in this area would aid in avoiding undue pressure being placed on the tertiary educational system.
Conclusion
The LASRS-2 is a valid and reliable psychometric tool. Most significantly, the scale is a unidimensional construct. Subsequently, the Overall LASRS-2 can be confidently applied to research, clinical, and educational settings. Specifically, the LASRS-2 is best applied to measure high levels of academic stress with a focus on tertiary level learning. As the LASRS-2 has four Domains (sub-scales) embedded within the overall scale it will be possible to identify the Affective, Behavioral, Cognitive, and Physiological impacts of academic stress suitable for some diagnostic purposes. Thus, the LASRS-2 is positioned to give direction to the researcher, clinician, and educator to aid in the amelioration and diagnosis of academic stress in tertiary level students and it has the potential to give insight into the impact of the COVID-19 pandemic on academic learning.
Footnotes
Acknowledgements
The author thanks Professor Jan Coles for her input into the design of the study and Dr. Chris Barton for reviewing and editing the manuscript. I would also like to thank Dr. Mark Moulton for his time, enthusiasm, editing, professional expertise and practical experience regarding Rasch Analysis and Rasch Modeling.
Data Availability Statement
I affirm availability of the data, the specification of the used software (WINSTEPS 4.5.5), according to the standards of research reproducibility.
Declaration of Conflicting Interests
The author declared no potential conflicts of interest with respect to the research, authorship, and/or publication of this article.
Funding
The author received no financial support for the research, authorship, and/or publication of this article.