
Abstract
The Perceived Academic Stress (PAS) scale is commonly used to assess academic stress among university students, but there is limited evidence on its accuracy and structure. This study investigated the reliability, validity and structure of the PAS scale in a large sample of Italian engineering students. A total of 5,499 participants (61.7% men; mean age = 22.9 years) completed the PAS. To ensure robust results, the sample was randomly divided into three groups to perform reliability tests, exploratory factor analysis (EFA), confirmatory factor analysis (CFA), and tests for measurement invariance (MI). The results showed that the original three- and four-factor structure of the PAS was not fully supported. Instead, the revised scale includes 16 items organized into three new factors: 1) Concerns related to academic work and examinations, 2) Concerns about expectations, 3) Positive self-perception as a student, including time management skills. Two items from the original scale were removed due to inconsistencies. The revised PAS had high reliability and was consistent across genders, that is, men and women students interpret and respond to the items in a similar way. This updated version of the PAS provides a more accurate instrument for assessing academic stress in students. It can help faculty and university support services identify key stressors, improve student well-being programs, and develop targeted interventions.
Introduction
In recent years, the academic quality of life of students has been the subject of research interest, including several studies. For college students, academic life is an important phase of their education that can promote positive social and learning experiences. At the same time, the transitional nature of this period, which for most students coincides with the developmental tasks of emerging adulthood (Arnett, 2000), can mean that academic life is a stressful experience. In a recent review (Pascoe et al., 2020), students were found to frequently report high levels of academic-related stress, highlighting its cross-cultural nature and impact on many psychosocial outcomes. Indeed, stress and anxiety have been identified as two of the main causes of poor academic performance and dropout (Jiménez-Mijangos et al., 2023; Sohail, 2013), as well as deterioration in mental health, well-being and quality of life (Berrío-García & Mazo-Zea, 2011; Misra & Castillo, 2004; Pascoe et al., 2020; Ribeiro et al., 2018; Watson & Watson, 2016). Following Lazarus and Folkman’s transactional stress theory (Lazarus & Folkman, 1986), stress can be described as the way in which an individual deals with expectations and pressures from the environment that they experience as threatening or overwhelming. Therefore, academic stress can be conceptualized as a specific relationship between the student and the academic environment that is perceived by the student as a burden or exceeding personal resources and may jeopardize their well-being (Portoghese et al., 2020). There is evidence for the main causes of academic stress being due to both academic factors such as performance pressure and workload, and psychosocial factors related to family and social circumstances such as unrealistic expectations and lack of emotional support, poor study-life balance, financial worries, and psychological resources such as self-esteem or coping styles (Britt et al., 2017; Denovan & Macaskill, 2017; Huda et al., 2021; Slimmen et al., 2022). In terms of socio-demographic factors, the literature confirms that female students are more vulnerable to academic stress than male students (e.g., Bert et al., 2020; Evans et al., 2018; Farrer et al., 2016; Lee et al., 2021), demonstrating important gender differences in student development. More recently, these issues have been further developed and evaluated in light of the challenges associated with Covid-19 (e.g., Barbayannis et al., 2022; Berdida, 2023; Green et al., 2021; Romeo et al., 2021), highlighting the need for universities to develop programs aimed at managing sources of stress and improving students’ quality of life.
According to the international literature, Italian college students have a higher risk of mental health problems compared to the general population (Franzoi et al., 2021; Romeo et al., 2021). Research in this context has primarily focused on samples of medical students who have moderate to high levels of stress associated with poor mental health and risk behaviors (Bert et al., 2020; Carpi et al., 2022; Leombruni et al., 2022; Portoghese et al., 2020; Volpe et al., 2019), whereas little is known about students in other disciplines (Bert et al., 2022; Riboldi et al., 2022) and particularly engineering students, who otherwise make up a significant proportion of the higher education student population nationally. Data from the National Engineering Council (2024) show that in 2023 almost 26,700 people obtained a Master’s degree in engineering from Italian universities, one of the highest values ever if compared to 2013, when the number of graduates was 16,380. Due to the expansion of the labor market in sectors requiring skills in biomedicine, telecommunications, and information technologies, environment, construction, and new materials, academic institutions offering engineering subjects are therefore destined to receive more and more students. In addition to this positive trend, studying engineering is also associated to negatively influence students’ health than other degree programs (Backhaus et al., 2020). Nevertheless, a recent systematic literature review shows that the state of research on mental health, stress and related psychosocial risk factors in engineering students is still underdeveloped at the international level, with a lack of research and studies in some countries, including Italy (Asghar et al., 2023). Available evidence at the international level has shown that engineering students experience a variety of mental health problems that negatively impact their academic experience and quality of life, such as anxiety, depression, and post-traumatic stress disorder, with stress being the most common (Ibidem). As described by various authors (Danowitz & Beddoes, 2018; Jensen & Cross, 2019; Jensen et al., 2023), engineering disciplines are considered demanding due to the challenging materials and complexity of concepts, the heavy workload and time pressure to complete the workload, which is exacerbated by competitiveness and sleep disturbance. At the same time, it is concerning that a culture of high stress and hardship is prevalent and even normalized in engineering and STEM fields, while mental health issues and help-seeking behaviors are stigmatized (Beddoes & Danowitz, 2022; Lipson et al., 2016; Mirabelli et al., 2025). Furthermore, the discrepancy between the stress levels and poor mental health of female and male students in engineering disciplines, which have been described as “less welcoming to women” (Godfrey, 2007), is exacerbated as the masculine and competitive culture that characterizes these disciplines reinforces the stereotype that women are inherently unsuited to the study of these disciplines and to a professional future. Having established the relevance of the phenomenon under study and the need to deepen our understanding of engineering students’ experiences of stress, valid and reliable assessment tools are needed. In fact, as indicated by Asghar et al. (2023), there is a lack of evidence on the construction and validation of instruments for research related to stress in engineering education. In general, it is noted that stress perception in the academic context has been measured mainly with instruments that provide relatively simple and less contextualized measures of stress, such as the Perceived Stress Scale (Cohen et al., 1983). On the other hand, several instruments have been developed to analyze students’ evaluation of sources of academic stress. Although these instruments help to assess the factors that can influence the perception of stress in the academic context, they also raise some critical issues. For example, some of them are unidimensional or do not provide multiple dimensions to assess different sources of stress, such as the SISCO (Manrique-Millones et al., 2019). Others provide non-academic factors, such as financial or parental problems, which are assessed with the Student-Life Stress Inventory (Gadzella, 1994), the CSSS (Feldt, 2008) and the USS (Stallman & Hurst, 2016). This scenario leads to a high number of dimensions and poor psychometric properties when adapting to other cultural contexts (Portoghese et al., 2020).
One instrument for measuring sources of stress perceptions among engineering college students is the Perceptions of Academic Stress (PAS) Scale, developed by Bedewy and Gabriel (2015). The PAS has been used in several studies addressing students of different disciplines from different countries, like the United States (Barbayannis et al., 2022; James, 2017; Kahn et al., 2023), Australia (Fisher & Pidgeon, 2018), India (Sharma, 2018), Afghanistan (Green et al., 2021), the Netherlands (Slimmen et al., 2022), Italy (Procentese et al., 2020) to name a few. The PAS scale was developed considering the main sources of academic stress highlighted by the literature, that is, a) stresses related to workload, b) factors related to academic expectations and pressure to perform, and c) student academic self-perception (Bedewy & Gabriel, 2015). In the original study (ibidem) The psychometric properties were assessed using a sample of 100 students between 19 and 26 years old at the University of Egypt, distributing the 18 items that make up the scale into four factors according to exploratory factor analysis: Factor 1 “Pressures to perform,” Factor 2, “Perceptions of workload,” Factor 3, “Academic Self-Perception,” and Factor 4, “Time restraints.” Despite the authors hypothesis of a three-factor structure, while revealing a four-dimensional semantic structure, most of the studies using the PAS scale evaluated either a single score or considered the three theoretical hypothesized by the authors, for which there is still little empirical evidence. Indeed, although the PAS is widely used at an international level, to the best of our knowledge it was evaluated for validity and adaptation to other cultural groups and language differences among Pakistan humanistic college students (Khan & Saleem, 2021), while França and Dias (2021) tested the instrument among a small sample of Brazilian engineering students. Findings of these two studies provided good internal consistency of the four factor model but without evaluating the psychometric properties of the tool through Confirmatory Factor Analysis (CFA) and the possibility of reducing the number of items to refine the instrument. Therefore, there is a need for evidence of other psychometric parameters, verifying the factor model of the PAS scale measured among larger samples of students in other cultural contexts, such as Italy where engineering disciplines are expanding, and the number of enrolled students represents a significant percentage of the academic population.
In light of these assumptions, the purpose of this study was to assess the structure of the perceived academic stress construct as measured by the PAS, that is, to test its construct validity in an Italian sample of undergraduate engineering college students. Furthermore, the study aimed to test the functioning of the scale for subgroups of participants, with the aim of identifying a gender-invariant tool to measure students’ (perceived) stress produced by the academic experience. This is of greater importance given the higher vulnerability to academic stress and worse mental wellbeing experienced by female students compared to their male peers.
Participants and Procedure
On behalf of the rector, all students of a northern Italian university of engineering received a link (via email or cell phone) to an online questionnaire related to psychological well-being during education. 26.2% of the students (N = 9171) decided to voluntarily participate in the survey, although some opted out when completing the questionnaire or were not included in the database. The final sample of the study consisted of 5,499 participants with an average age of 22.9 years (SD = 3.4). It was comprised predominantly of men (61.7%), which corresponds to the composition of the population in the study programs under consideration. A proportion of 57.6% of respondents were enrolled in the first 3 years of study (3-year degree course), while 37.7 and 4.7% respectively were enrolled in Master’s or doctoral degree courses at the time of the survey. Only 4.3% of those surveyed were “out of course,” that is, they were behind schedule with the examinations prescribed in their study plan. The students voluntarily participated in the study without receiving any reward and after being guaranteed anonymity of their answers and results. The study design minimized potential risks to participants, as it involved completing an online self-report questionnaire on psychological well-being, without any medical or invasive procedures. Participants could withdraw from the study at any time without consequence. The benefits of the research, particularly in providing insights for positive actions and interventions to support student well-being in academic settings, were considered to outweigh the minimal risks involved. Informed consent was obtained through a two-step process, where participants first reviewed the study information and then confirmed their consent by selecting two boxes: “I have understood the information provided” and “I authorize the use of my responses for the purposes of the study and in accordance with the procedures outlined in the study.” Data collection was carried out in compliance with the General Data Protection Regulation (GDPR, EU Regulation 2016/679). Data were anonymized and analyzed in aggregate form.
Statistical Analysis
The sample was randomly divided into three subsamples, each comprising approximately 1/3 of the participants: S1, S2, and S3 (hereafter). The socio-demographic composition of the three subsamples is shown in Table 1. The structure of the PAS scale was examined using exploratory and confirmatory factor models. Preliminary tests of sampling adequacy (Kaiser-Meyer-Olkin test, KMO) and sphericity (Bartlett test) were conducted to assess the suitability of the dataset for factor analysis. The tests yielded good results for all samples: KMO values were 0.772, 0.785, and 0.789, respectively, while Bartlett’s test was always significant (p < .001, df = 153). Sample 1 was used to examine the functioning of the items and the dimensionality of the PAS. Reliability was assessed using item analysis, Cronbach’s alpha and McDonald’s omega, while the dimensionality of the scale was examined using principal component analysis (PCA), as in the study in which the PAS was proposed, and exploratory factor analysis (EFA), as these techniques make it possible to test the relationships between the items and the factors without a priori constraining the loading values. Although EFA and PCA are similar, they have different applications and interpretations. In particular, EFA is best suited to understand how many latent factors are responsible for the relationships between a set of observed variables (Alavi et al., 2020). Based on the preliminary results, a confirmatory factor analysis (CFA) was conducted with the S2 dataset. The models were estimated using the MLR method as the data violated the assumption of multivariate normality tested using Mardia’s (1970, 1974) tests for skewness and kurtosis (Chi = 7,361.958, p < .001). Based on the theoretical solution and the empirical solution presented by Bedewy and Gabriel (2015), several model specifications were tested. Additional models were then proposed to obtain a valid, meaningful and generalizable factor structure. Comparative fit index (CFI), root mean squared error of approximation (RMSEA) with the associated 90% confidence interval (CI) and root mean square of residuals (RMSR) were used to assess the fit of the alternative models. Recognized values were taken as criteria for a satisfactory model fit to the data: CFI greater than 0.9; RMSEA value close to or less than 0.08; SRMR value close to or less than 0.06 (Brown, 2006; Hu & Bentler, 1999). The most satisfactory factor solution was then subjected to gender invariance using the S3 dataset. Following Putnick and Bornstein (2016), four steps of measurement invariance were established: (1) configural, equivalence of model form; (2) metric (weak factorial), equivalence of factor loadings; (3) scalar (strong factorial), equivalence of item intercepts or thresholds; and (4) residual (strict or invariant uniqueness), equivalence of item residuals or unique variances. Satorra and Bentler’s chi-squared difference test (Δχ2) was used to compare model fit. Next, we also examined differences in CFI (ΔCFI) and RMSEA (ΔRMSEA), with a cutoff value of −0.010 and 0.015, respectively, indicating invariance (Cheung & Rensvold, 2002). Preliminary analyses were conducted using IBM SPSS statistical software (v. 27), while the PAS scale was modeled using MPLUS 8.1 software.
Subsamples Composition: Age, Gender, and Academic Degree Course Affiliation.

Measures
Perception of Academic Stress Scale (PAS). The PAS consists of 18 items divided into three subscales representing different sources of academic stress: Stress related to academic expectations (e.g., for the item, “My parents’ unrealistic expectations stress me out”; α = .61), stress related to faculty work and examinations (e.g., for the item, “I think that the amount of work assigned is too much”; α = .79), and stress related to students’ academic self-perception (e.g., for the item, “I think that my worry about examinations is a character flaw”; α = .75). Participants responded on a 5-point Likert scale: strongly disagree (1) to strongly agree (5), with a high score indicating a higher perception of stress among students. The scoring of 5 items (D1–D5) was reversed in order to avoid response patterns.
Results
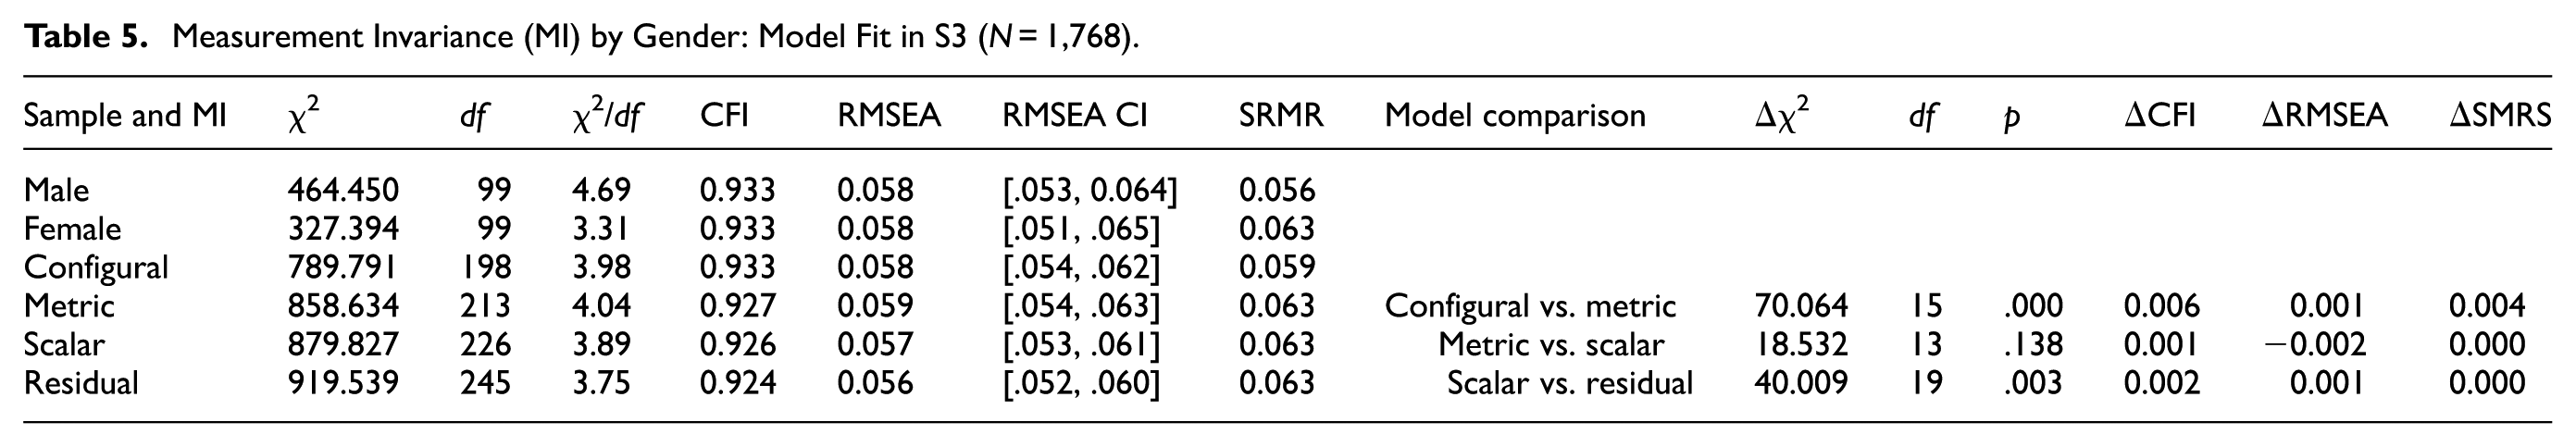
Item: The items had quite high mean values, which were close to 3 on a 1 to 5 Likert response scale. The spread of responses around the respective mean values of the distributions was at least one point, even if the standard deviation reached values of around 1.6 for some items. Most participants agreed with a very positive statement: “I am sure that I will be successful in my future career” (D2), while they agreed least with the availability of time to relax (D5). This indicates a fairly strong self-confidence in the face of stressful courses (at least in terms of time commitment). As for the item distributions, the shape indices did not show any significant violations, even though the distributions were quite platykurtic, especially those of items D7 and D13. The reliability analysis, which was carried out for the entire scale, yielded quite good results (Table 2): The Cronbach coefficient was 0.727 and the McDonald coefficient was 0.608, both around the minimum threshold of 0.7, indicating a low level of internal consistency. Some items (D3, D4, D5, D8, and D18) were inconsistent within the scale, achieving low item-total correlation values and weak R2 values (both below 0.3); some others (D2, D6, D9, D13, D14, and D18) showed low correlation with the total scale, even though they largely overlapped with the other items in terms of multiple squared correlation. The reliability coefficients obtained by grouping the items into three subscales according to the theoretical model were quite satisfactory (F1: stress related to academic expectations, α = .738; F2: stress related to faculty work and examination, α = .744; F3: stress related to self-perception, α = .528). The results worsened when the items were divided into four subscales to reproduce the empirical solution proposed by Bedewy and Gabriel (F1: pressure to perform, α = .364; F2: perception of workload, α = .692; F3: self-perception, α = .600; and F4: time pressure, α = .347). Dimensionality using principal component analysis and EFA in sample1. The first indications of the dimensionality of the PAS scale were obtained through a principal component analysis. Four dimensions were extracted, both on the basis of the criterion of eigenvalues (greater than 1) and by conducting a parallel analysis. The four dimensions explained 56.1% of the data variance and were essentially uncorrelated (maximum correlation equal to 0.147); therefore, we opted for a varimax rotation. The principal components differed from the four subscales adopted in the initial validation study of the PAS scale: The items loaded on each component do not reproduce the empirical structure found by Bedewy and Gabriel (2015), even though each item has at least one coefficient above 0.3. Estimating a more robust EFA model using the principal axis extraction method yielded a four-factor solution (explained variance 45%, REPR 10%) in which the fourth item loaded on only 2 items (D10, D11) regarding the amount of work. In order to achieve a simpler specification and to test the structure originally proposed by the authors, the items were forced to load on three factors instead of four: The solution and latent factors appeared reasonable and could be interpreted as “concerns about academic work and examinations” (factor 1), concerns about “expectations” (factor 2), and a “positive self-perception as a student,” including time management (factor 3). All items achieved a loading of greater than 0.3, with the exception of D5 and D13, but the factor structure again differed from that reported in the original PAS scale study. The solutions obtained in the three analyses are presented in Table 3, with the theoretical and empirical model proposed by Bedewy and Gabriel in the second and third columns to illustrate the deviation of the results from the original specifications. Dimensionality by confirmatory factor analysis in sample 2. Table 4 illustrates the fit of the different estimated models for Sample 2. The factor loadings were freely estimated and the variance of the latent variables was fixed at 1.0. Both the theoretical (M1) and empirical (M2) models proposed by the PAS authors had unsatisfactory fit indices; conversely, the fit of the three-factor model (M3a) estimated based on the previous EFA (PAF estimation method) achieved a reasonable fit (χ2 (130) = 834.78, p < .05; RMSEA = 0.055 (90% CI [.051, .058]); CFI = 0.926; SRMR = 0.056). The model (M3a) is characterized by two codominant items (D12 and D17 with significant loading on both Factor 1 and Factor 2) and three covariance errors between items (D6-D9, D15-D16, D10-D11) that have the same semantics and were worded very similarly. In addition, 2 items (D5 and D18) were weak in this model, with an R2 coefficient of less than 0.2; these were omitted from the next specification. The final model (M3b), shown in Figure 1, further improved model fit (χ2 (99) = 584.71, p < .05; RMSEA = 0.052 (90% CI [.048, .0586]); CFI = 0.946; SRMR = 0.053). Measurement invariance by gender in sample 3. Table 5 shows the fit of the models testing the measurement invariance of M3b between genders. The fit of all models, from the least constrained (the configural model) to the most constrained (the scalar model), was excellent. First, the metric model, which requires equality of male and female factor loadings in addition to equality of factor counts, was compared with the configural model. The chi-square difference test showed a significant difference between the two models, but the changes in CFI, RMSEA, and SRMR were reasonable (lower than the expected cutoff value of −0.010 and 0.015). Subsequent comparison between the scalar model, which included an additional constraint of equality of axis intercepts, and the metric model yielded entirely satisfactory results: The chi-square difference test (Δχ2) was significant, and the deviations in CFI, RMSEA and SMRS were completely negligible. Finally, the most constrained model (the residual model) showed acceptable values for the fit indices. Therefore, we can conclude that the three-dimensional model of the PAS scale reduced to 16 items shows a strict degree of gender invariance: in both subsamples of men and women, the number of dimensions, factor loadings, item intercepts, and unique variances were the same.
Item Analysis and Reliability in S1 (N = 1,908).

Note. M = mean; SD = standard deviation; S = symmetry; K = Kurtosys.
Original PAS Model and Results: Pattern Matrices With Varimax Rotation Using Principal Components Analysis and EFA-Principal Axis Extraction on S1 (N = 1,908).

Note. The theoretical model of PAS is structured on stresses related to (A) academic expectations, (B) faculty work and examination, and (C) students academic self perception; the empirical model of PAS proposed by its authors is F1 = pressures to perform, F2 = perceptions of workload, F3 = academic self-perception, and F4 = time restraints.
Confirmatory Factor Analysis: Model Fit in S2 (N = 1,823).

Note. *p > .05.
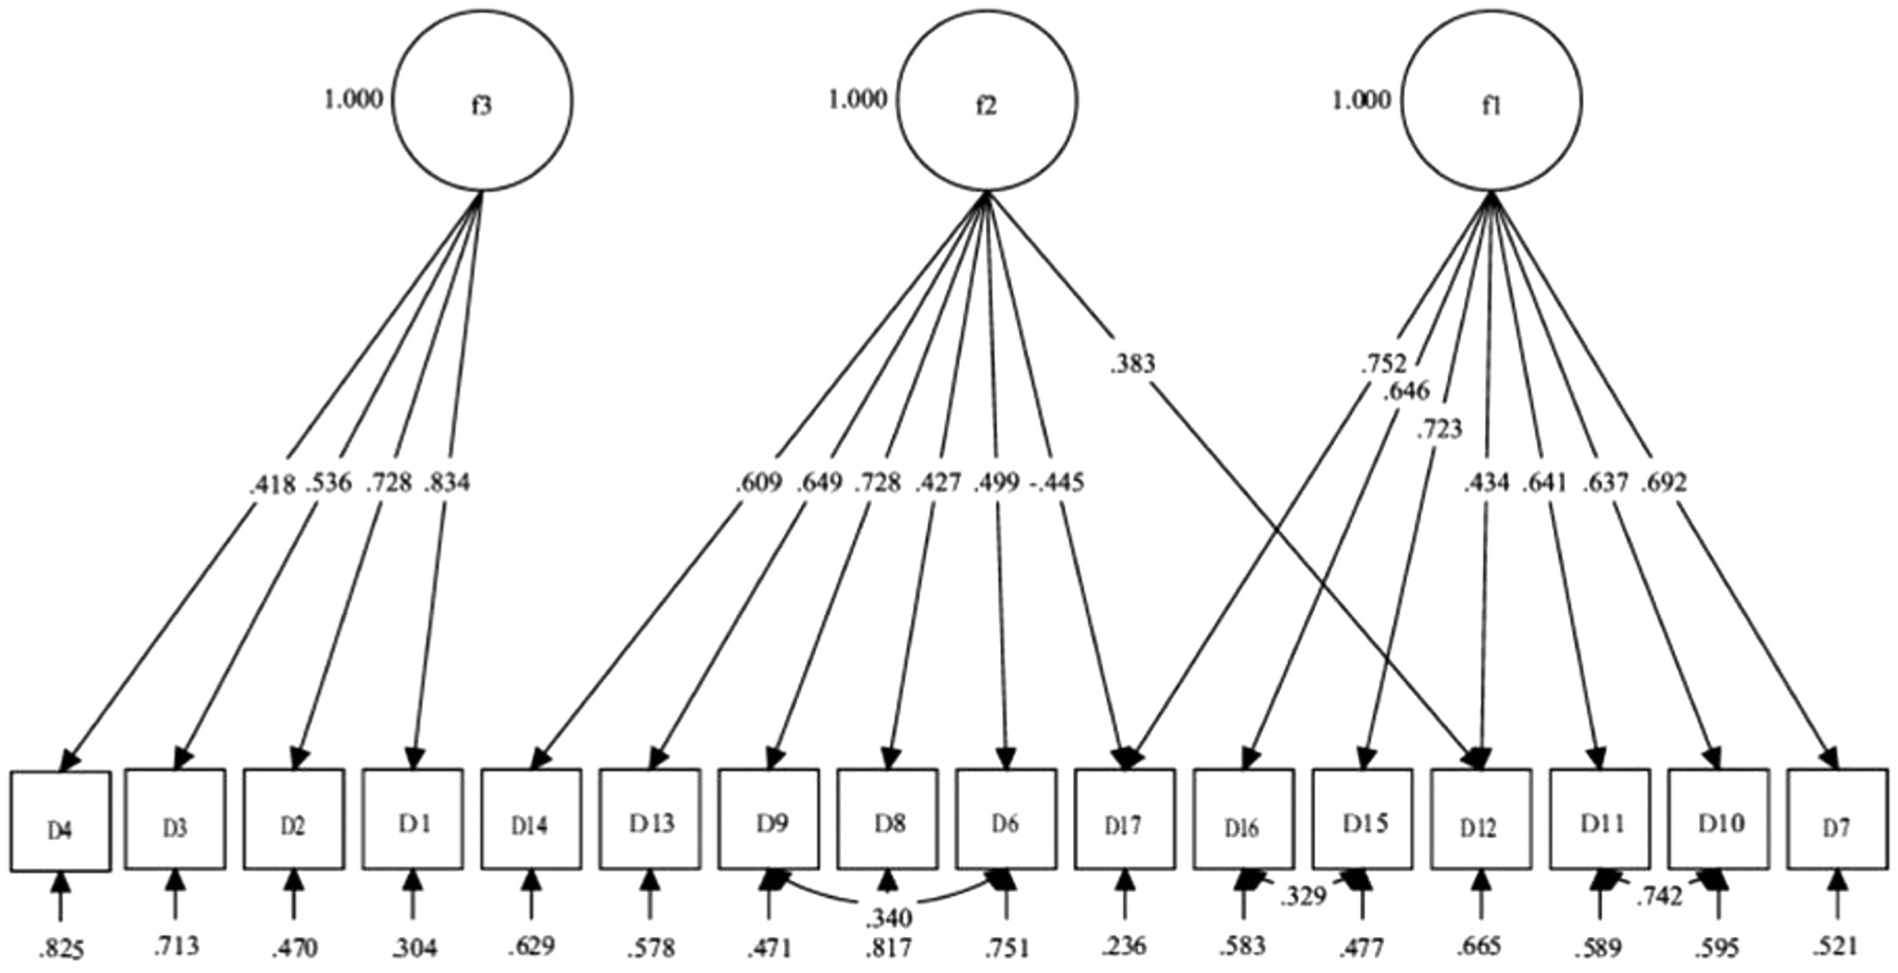
Final model (M3b): standardized solution in S2.
Measurement Invariance (MI) by Gender: Model Fit in S3 (N = 1,768).
Discussion
The Perception of Academic Stress (PAS) scale is currently used as a valid instrument to measure students’ stress during their academic careers and has been used in numerous studies focusing on the assessment of stress variations in college students in relation to their well-being and mental health, the quality of academic life (e.g., Berdida, 2023), and interventions such as psychotherapy and health education (Chandra, 2021; Ekwelundu et al., 2023) both before and during the Covid-19 pandemic. The wide use of the instrument, as evidenced by the numerous citations in recent years, demonstrates both the relevance of the topic and the need to provide more evidence on the psychometric characteristics of the instrument. Currently, the evidence for the construct validity and reliability of the PAS is based on the results of the original study by Bedewy and Gabriel (2015). After an extensive literature review and interviewing a panel of experts to demonstrate content validity, the authors of the original PAS version (ibidem) developed the scale primarily by identifying three main components that characterize sources of academic stress in a rather small sample (N = 100). In general, the scale is used to calculate the three partial scores of a) academic expectations (4 items), b) workload and examinations (8 items), and c) students’ academic self-perception (6 items), as suggested by the PAS authors. However, as shown in the very first article validating the instrument (Bedewy & Gabriel, 2015) and in the results of two studies conducted with small samples of humanistic Pakistani (Khan & Saleem, 2021) and Brazilian engineering students (França & Dias, 2021), respectively, the PAS has a four-dimensional semantic structure that contradicts the theoretical structure originally adopted to formulate the items of the instrument.
Although the instrument has been used in numerous international research studies, validation studies are needed to further evaluate the psychometric properties of the PAS using a heterogeneous and larger sample of students in different educational settings and cultural environments. Therefore, the aim of this study was to fill these gaps by testing the basic psychometric properties of the scale, starting with its reliability and construct validity using a large sample of Italian engineering students, a student population that has been significantly underrepresented in stress research and measurement instrument validation, especially in European countries such as Italy. Furthermore, the study aimed to test the functioning of the scale for subgroups of participants to find a gender-invariant instrument. The reliability obtained by grouping the items into the three subscales was, as predicted by the theoretical model, quite satisfactory when using the alpha and omega coefficients. In contrast, both coefficients were unsatisfactory when reliability was assessed using items grouped into the four subscales reproducing the empirical solution proposed by Bedewy and Gabriel (2015). In addition, some items (D2, D3, D4, D5, D6, D8, D9, D13, D18) showed item-total correlations and R2 values of less than .30. The results of the EFA and PCA analyzes do not yield either the theoretical three-factor structure hypothesized by the authors or the four-factor structure empirically determined by the authors, although the methodology of the analysis was the same.
Our exploratory analysis showed a good fit for a model characterized by three factors relating respectively to “concerns related to academic work and examinations” (factor 1), concerns related to “expectations” (factor 2), and a “positive self-perception as a student,” including time management (factor 3). This model was confirmed by CFA and is characterized by 2 items that loaded on both Factor 1 and Factor 2, as well as three covariance errors of items (D6-D9, D15-D16, D10-D11) that have the same semantics and very similar wording. The deletion of 2 items (D5 and D18) with R2 values below 0.20 further improves the fit of the model. The final version of the Italian PAS scale consists of 16 items and has more than adequate validity. The three-factor structure was structurally stable across gender subgroups: the multi-group analysis yielded results well above the values required to consider the scale invariant between male and female engineering students. Therefore, the number of dimensions, all factorial saturations, item intercepts and unique variances were the same for both genders. Overall, our results demonstrate adequate psychometric properties for the construct validity of the PAS and suggest that its three-part structure allows for appropriate and meaningful comparisons of scores between males and females. In contrast to previous studies that have examined the reliability of the instrument using EFA and internal consistency assessment in small samples of non-European students (Bedewy & Gabriel, 2015; França & Dias, 2021; Khan & Saleem, 2021), the results of the EFA and CFA show a three-factor structure of the instrument that partially follows the theoretical structure originally proposed by Bedewy and Gabriel (2015). The three-factor structure invariant between men and women, thus characterizes the PAS as a valid and reliable instrument for the purpose of assessing sources of stress for Italian engineering students, corresponding to the specific characteristics of engineering disciplines that make them particularly stressful (Asghar et al., 2023). As already explained, the academic context of engineering is perceived by students as very demanding in terms of the study load to which they are exposed, both in terms of the content of the subjects, which are considered particularly complex, and the time pressure involved in completing the tasks (Danowitz & Beddoes, 2018; Jensen & Cross, 2019; Jensen et al., 2023). In addition, it is a predominantly male context with a high degree of competition among peers and high performance expectations in a stress-normalizing culture (Asghar et al., 2023; Jensen et al., 2023), in which adequate self-perception of self-confidence in academic tasks can lead to significant protective factors for worry and tension.
Despite the relevance of the results of the present study and the fact that it focused on a large sample of engineering students, there are also limitations. The data was collected at a single higher education institution with a cross-sectional design. In addition, the results may also be influenced by self-selection bias, as the participants themselves decided whether or not to participate in the study, resulting in a sample that may not represent the total population and limiting the generalizability of the results. Finally, the results may also be influenced by self-report bias. To limit such biases, the PAS scale should also be examined for validity and factorial invariance across groups of students from different academic disciplines, environments, and cultural affiliations and longitudinal designs could also provide information on the consistency of the scale across different measurements. Finally, future studies should incorporate random sampling or strategies to ensure a more representative sample to reduce self-selection bias, as well as utilize data triangulation in which physiological measures of stress are available alongside self-reported data and social desirability is controlled.
Conclusion
Empirical findings from research on the mental well-being and quality of life among college students now consistently show that this population group has a higher prevalence of mental disorders compared to the general population (Odriozola-González et al., 2020; Romeo et al., 2021). For college students, entry into the academic context appears to be a crucial experience for both the onset of psychophysical symptoms and the adoption of risky lifestyles and behaviors, where specific segments of this population like engineering students appearing to be at higher risk (Backhaus et al., 2020). We must therefore consider the fact that the demands of the academic context can be important sources of stress. Given the increasing vulnerability of students to mental health problems, involvement in health-risk behaviors and the associated risk of dropping out, academic institutions are therefore increasingly called upon to activate services for students, such as psychological counseling or psychoeducational interventions to promote mental health, stress management or prevention of risk behaviors. Considering the results of the present study, the PAS scale can be used as a reliable tool for the evaluation of interventions to cope with academic stress and to promote well-being in academic contexts. In particular, in the context of individual counseling and psychological support services, the PAS scale can be used for a better understanding of the person’s state of distress in relation to sources of academic stress. Considering the different dimensions measured by the PAS scale, the intervention can focus on coping with “concerns related to academic work and examinations” by improving students’ personal resources, for example, coping strategies to deal with academic pressure and anxiety. Concerns related to “expectations” can focus the intervention on helping students to manage significant others’ expectations and to develop a more mature self-image as a student that is in line with their own values and interests. At the same time, assessing the level of “positive self-perception as a student” can guide the intervention to support the student’s level of self-efficacy and self-confidence. In addition, the PAS scale can be used to evaluate the effectiveness of health promotion interventions such as psychoeducational groups aimed at promoting students’ emotional awareness, reducing anxious-depressive symptoms mostly related to academic stress, and enabling students to better cope with tasks and demands related to the academic path and personal growth process. In a highly competitive and stressful culture that pervades the academic context of engineering in particular (Bacci et al., 2024), peer group intervention can provide the context in which knowledge, openness, comparison and reflection allow participants to gain useful insights for understanding and managing their emotions and to build a shared culture of stress awareness and adaptive coping skills. Finally, the PAS scale can also provide useful information for academic staff in redefining the workload required of students or in making interpersonal relationships with students more functional and supportive when difficulties arise in coping with academic demands or excessive student expectations. At the same time, these strategies can improve the reciprocity between students’ well-being and that of teachers and professors (Martini et al., 2019; Loera et al., 2024) and thus support the overall quality of study and work life at universities. To this end, the results of this study provide evidence that the PAS can be used as a reliable and valid instrument to measure academic stress in the Italian context, considering some issues that should be addressed in future validation studies to improve its psychometric properties. The final model contains covariances between the error terms, which in fact reflect the specificity of some items and their semantic overlap. The scale seems to suffer from linguistic noise: the wording is redundant and should be improved and perhaps simplified. Finally, the psychometric properties of the PAS should also be assessed using IRT models, as suggested by modern best practices for the construction and validation of measurement instruments. IRT models represent a psychometric methodology that has changed the rules for developing, scoring, and evaluating tests (Embretson & Reise, 2000). Such a methodology is widely used in psychological assessment (Reise & Waller, 2009; Loera et al., 2018; Molinengo et al., 2023) and is increasingly gaining the attention of funding organizations and test publishers. As the PAS scale is widely used worldwide, further studies should evaluate its psychometric properties in contexts other than the Southern European one in which it was currently evaluated.
Footnotes
Acknowledgements
The authors would like to thank the Rector and the university’s administrative and academic staff for supporting the development of the research. Special thanks go to the participants who generously contributed their time and insights.
Ethical Considerations
All participants were fully informed about the objectives of the study, the voluntary nature of their participation, and their right to withdraw at any time without consequences. Participation was unpaid, and no financial or other forms of compensation were provided.
Consent to Participate
Written informed consent was obtained from all participants prior to data collection in accordance with Section 8.05 of the APA Ethical Principles of Psychologists and Code of Conduct. All data were collected and processed in compliance with the General Data Protection Regulation (GDPR, EU Regulation 2016/679), ensuring anonymity and confidentiality.
Author Contributions
Conceptualization, Project Administration: BL, DC, and GM; Supervision: DC; Methodology, Software, Data curation, Formal Analysis: BL and GM; Writing-original draft: BL, GG, and GM; Writing—review and editing: BL, GG, DC, and GM.
Funding
The authors received no financial support for the research, authorship, and/or publication of this article.
Declaration of Conflicting Interests
The authors declared the following potential conflicts of interest with respect to the research, authorship, and/or publication of this article: All authors agree to be accountable for all aspects of the work, ensuring that any questions related to the accuracy or integrity of any part of the work are appropriately investigated and resolved.
Data Availability Statement
The data supporting the findings of this study are available from the corresponding author upon reasonable request. The data are not publicly available due to restrictions imposed by Italian privacy legislation (Legislative Decree 196/2003 and EU Regulation 2016/679).