
Abstract
This paper explored the effects of urbanization and industrial structure change in contemporary China using the data of 26 cities in the Yangtze River Delta (YRD) between 2006 and 2017. We analyzed the spatial characteristics of the regional economic growth by calculating the Global Moran’s I and the Local Moran’s I. We investigated the relationship between urbanization, industrial structure upgrade, and economic growth through a spatial econometric approach and tested the panel thresholds. Our findings included: (1) spatial autocorrelation is an important driver of urbanization and industrial structure upgrade; (2) the upgrade of the industrial structure leads to a structural economic deceleration which slows down the regional economic growth in the YRD; however, the positive effect of industrial structure upgrade on the regional economic growth still exists; (3) a synergy effect of New-type Urbanization and industrial structural upgrade positively affects the economic growth in the YRD; (4) the empirical results indicate that only when urbanization and industrial structural upgrade develop coordinately, will they play better roles in promoting the economic growth.
Keywords
Introduction
Since the reform and opening-up in 1978, China has experienced high-speed economic growth. With an average annual growth rate of 9% between 1978 and 2018 (The World Bank), China has become the second largest economy in the world. The urbanization of population and land is one of the critical developing strategies of China. According to the Chinese National Bureau of Statistics, China’s urbanization rate has increased by 1.2% annually over the past 5years; by the end of 2019, China’s urban residents reached 848.43 million with a 17.06 million annual increase, while rural residents decreased by 12.39 million to 551.62 million. Rapid urbanization caused huge changes in population structure and industrial transformation, offered economies of scale and agglomeration economies through knowledge and technology spillover (Amin et al., 2020; Chen et al., 2020; Wang, Deng et al., 2019). Urbanization is not only the construction of urban facilities but also the transition of villagers to citizens (Meyer-Clement & Zeuthen, 2020; Zhan, 2018). Even though the urbanization rate keeps climbing, the economic growth has slowed down significantly in recent years after decades of rapid growth.
Scholars believe that China’s economy has met the middle-income trap, where at specific middle-income levels, economies with hyper growth rates encounter slowdown (Cai, 2012; Giap et al., 2016). In fact, China has entered the “New Normal” era which emphasizing the sustainable, quality but slow-downed development of economy (Lu, 2017). In 2014, the National New-type Urbanization Plan (2014-2020) (hereinafter referred to as NUP) was officially released to sustain economic growth and push structural transformation. The NUP aims at intensive, efficient, rural-urban integration, harmonious and sustainable urbanization models (Guan et al., 2018). One of the most important goals of the NUP is to create city clusters and promote regional development through coordinating regional collaboration, developing coordination plans, and encouraging government funding and other sources of supports (Li et al., 2016).
However, scholars find no evidence that links the extent of urbanization either to the economic growth or the productivity levels (Bloom et al., 2008; Henderson, 2003). China’s urbanization is unique and different from the urban development in western counties and other developing countries not only because its large and dynamic population and market base but also its Communist leadership and the critical role of the party and the state (Hamnett, 2020; Tan et al., 2016). Thus, studying the NUP in China will allow us to get more insight into the unique urban development process in China. Even though the goal of NUP is to provide cultural and public urban services and high-quality livable places instead of pursuing the scale of urban, spatial, and population expansion, whether enhancing quality of development will help with the “middle-income” trap is still unknown. Meanwhile, the effect of sustainable urbanization on economic growth is still underinvested. Our study thus focuses on the quality of urbanization and its influence on economic development in developing countries.
This paper explored the effects of urbanization and industrial structure change in contemporary China using the data of 26 cities in the Yangtze River Delta (YRD) between 2006 and 2017. We provide empirical evidence that the co-interaction of urban and industrial development alleviates the structural deceleration problem. Our research made several contributions. First of all, the research methods and models in this paper systematically and scientifically examined the relationships between the variables. The spatial econometrics model and the panel threshold model showed not only the spatial differences but also the mutual relationships. Thus, this paper enriches the regional economy literature by extending existing dual relationship between urbanization, industrial structure, and economic growth to the integrated effect of urban-industrial development on regional economy.
Secondly, we established a systematic, comprehensive, and innovative evaluation system for New-type Urbanization. Since traditional urbanization is associated with crowding, environmental degradation and other impediments to productivity, the rationale for encouraging urbanization as part of a strategy for economic growth is weakened. However, the New-type Urbanization and the industrial structure upgrade aim at improving the quality of development. In addition, our findings indicate that sustainable urbanization and industrial structure change both have spatial spillover effects.
Thirdly, existing empirical studies investigating China’s economic growth mostly use provincial level data (Ding & Lichtenberg, 2011; Jin et al., 2005; Lin & Liu, 2000). The city-level panel data we used in computing the spatial matrixes provide better weights than provincial data and give more detailed information about regional and sectorial aggregation.
Lastly, we considered the spatial heterogeneity and dependence of regional economic development. With the development of market-oriented economy in China, economic activities such as resources reallocation and technology diffusion increase frequently among regions, thus inevitably leading to spatial connections among cities.
This paper is structured as follows. Section 2 presents a review of existing literature on urbanization, industry structure economic growth, while Sections 3 and 4 presents our research design and research methods. Section 5 is the empirical results and interpretations based on data from 26 cities in the YRD. The paper then concludes in the last section.
Related Literatures
Urbanization and Economic Growth
Scholars always address the co-development of urbanization and economic growth. The urbanization process helps maintain the sustainable and healthy development of the economy in terms of increasing income, stimulate domestic aggregate demand, and increase investment in public facilities. Scholars studied the dynamic linkage between human capital accumulation, urbanization, and economic growth, and found that the interaction between urbanization and human capital decreases environmental degradation (Ahmed et al., 2020). Some scholars found that population growth and human capital positively influences regional economic growth (Peterson, 2017; Prasetyo, 2020). Other scholars studied the relationship between urbanization, economic growth, and sustainable development; empirical evidence indicates that urbanization is positively associated with economic growth (Singh et al., 2013); Maparu and Mazumder used 10-year panel data in India to examine the causal relationship between urbanization and economic growth and the results are supported (Maparu & Mazumder, 2017).
However, some scholars also questioned whether urbanization could promote economic development. Urban workers are proven to be more productive and earn more than rural workers. Productivity growth is found to be faster in regions surrounded by regions with fast growing productivity (Fingleton, 2001). The proportion of the population living in urban areas is highly correlated with its level of income due to that urban areas provide economies of scale and richer market structures; Although agglomeration of population in cities may generate more per capita GDP, it also bring environmental degradation and overwhelming the cities’ capacities (Bloom et al., 2008). Scholars also pointed out that due to energy consumption, population growth, and urbanization, the agricultural sector as well as the regional environment in China is facing serious challenges (Elahi, Khalid, et al., 2022; Elahi, Zhang, et al., 2022).
Moreover, current urbanization literature focuses on the population urbanization, and measure urbanization mostly as the ratio of urban population to total population (Elgin & Oyvat, 2013) instead of studying the effect of urbanization. Other than population structure change, indicators of urbanization process (such as green cover ratio, lawn cover ratio, street cover ratio, etc.) also needs to be taken into consideration from a stakeholder point of view.
Industrial Structure and Economic Growth
In the book the Conditions of Economic Progress by Colin Clark, the definition of the components of the economic lexicon was first established; Clark described a tripartite economic structure consisting of primary, secondary and tertiary economic activates (Clark, 1940) and defined structural change as the reallocation of economic activities across agriculture, manufacturing, and services sectors.
Scholars have explored the relationship between industrial structure change and economic growth. Industrial structure change is one of the core driving forces for economic growth (Kuznets, 1968; Liu & Hu, 2019). Peneder, Kaniovski, & Dachs revealed that industrial structure upgrade means a more effective market environment, and improved distribution and mobility of production elements, thus promoting regional economic growth (Peneder et al., 2003). Fagerberg used industrial statistics to analyze labor productivity using shift-share analysis and explore the effect of industrial structure change and technology innovation on productivity growth in manufacturing (Fagerberg, 2000). With the rapid economic growth in China, many scholars have shifted their research focus to industrial structure change in China, and they found that industrial structure change and resources reallocation promotes industrial development both from the demand side and from the supply side by enhancing productivity (Chen et al., 2011). Shi studied 53 coastal cities in China and found that rationalization of industrial structure significantly promotes costal economic growth (Shi, 2020). As one of the critical factors that influencing technology innovation, higher education development promotes technology innovation and diffusion, thus leads to industrial structure change toward more sustainable ways of economic growth (Wu & Liu, 2021). Researchers also found that even though there is still space for China’s industrial structure upgrade, the structure bonus promotes economy at a decreasing rate. Industrial structure change gradually shifts the labor force from the secondary to the tertiary industry, while the productivity of the secondary industry is much higher than the tertiary industry, causing a structural slowdown of economic growth. Scholars found that industrial development is still the core driver for the economy in China at the current stage and the industrial structure upgrade has effectively coordinated the relationship between environmental degradation and economic growth (Wang et al., 2020). Learning from the development of the global economy, the economic growth rate rises in the beginning and decreases after due to industrial structure change (Eichengreen et al., 2011).
Urbanization and Industrial Structure
Although many empirical literatures have examined the relationships among urbanization, industrial structure change, and economic growth, few of them examined the relationship between the co-interacting effect of urbanization and structure change on economic growth.
Industry development is the foundation of urbanization; at the same time, the selection effect brought by urbanization will lead to industrial agglomeration. The expansion of the scale of cities causes the agglomeration of population and industries. Traditional urbanization and industrial development account for air and water pollution, leading to global warming and climate change (Zhu & Xia, 2019). However, the construction of the New-type urbanization and industrial structure upgrade both aim at sustainable development and environmental-friendly economic growth. The present paper builds on the existing literature but differs in that we considered not only the structure transformation away from agriculture but also tracked the relocation of economic activities into each sector during the urbanization process. China’s economy has entered the era of “structural economic deceleration,” and the “structural bonus” brought by the pre-industrialization period has gone. The development focus is transferring from the primary industry to the secondary and tertiary industry during the process of urbanization. In this paper, we emphasize the synergy effect of structure transformation and sustainable urbanization, investigating quality of urban-industrial development, and sustainable economic growth.
Description of the Data
The sample cities in our study were obtained from the China Statistical Yearbook and the China City Statistical Yearbook between 2006 and 2017, from which we kept only cities in the Yangtze River Delta.
Dependent Variable
Economic growth
We calculated our dependent variable, economic growth, as the gross domestic product (GDP), measured in ten thousand RMB. We used GDP in 2006 price as a deflator to eliminate the effect of price inflation. We used the natural logs of GDP.
Explanatory variables
New-type urbanization
Compared with traditional urbanization, our explanatory variable New-type Urbanization focused on the quality and sustainability of urban-rural development. Building on existing literature (Gates et al., 1989; Tong & Kang, 2021) and the NUP official documents, we employed ten indicators of urbanization according to the NUP, shown in Table 1.
Ten Indicators of New-type Urbanization.

We used the entropy-method to determine the weight of the evaluation criteria.
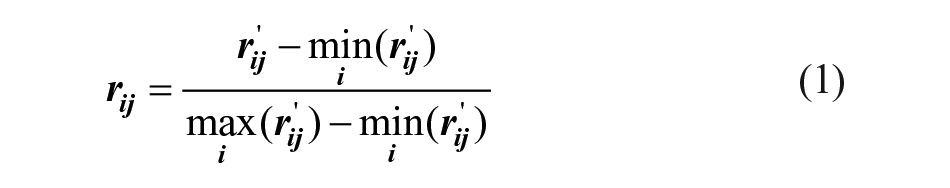
Standardization of indexes
The attribute value of the

The entropy of the
th index
According to the definition of entropy, the entropy of the

wherein,
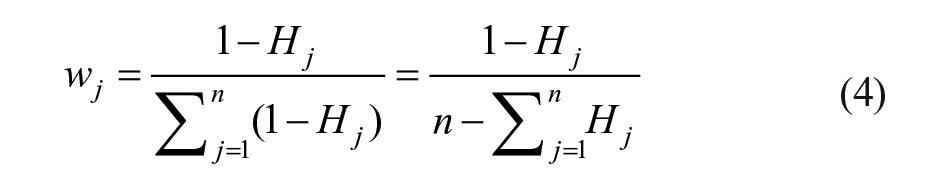
Calculation of the index’s entropy weight
Entropy weight of the
The New-type Urbanization Index
After calculating the level of New-type Urbanization of 26 cities in the YRD economic zone between 2006 and 2017 (Table 2), we find that significant spatial differences gradually lead to spatial distribution characteristics synchronizing regional economic development. Among the 26 cities, the level of New-type Urbanization is higher in more economically developed areas such as Shanghai, Wuxi, and Nanjing; Meanwhile, the level of New-type Urbanization of cities in Anhui province is lower than that of cities in Zhejiang province. One possible explanation is the imbalanced development of the regional economy in Anhui, which leads to low attribute value in the per capita index.
Level of New-type Urbanization and Rank of 26 Cities in the YRD.

Industrial structure
We used the weight of primary, secondary and tertiary industry in GDP as an indicator of structural change because it shows the relocation of economic activities and capital (Cheng et al., 2018; Wang, Wu et al., 2019).
Thus, we calculated the structural upgrade index as:

where the 1, 2, and 3 are the weight of primary, second, and tertiary industry, representatively. The higher the index, the higher the industrial structure level.
Control variables
Foreign direct investment
Foreign direct investment indicates the openness of investment and economy, which is also an important factor affecting economic growth. In this paper, we used the proportion of FDI in GDP.
Technology progress
We used the proportion of science and technology expenditure in GDP to measure a city’s level of technological progress.
Methodology
Exploratory Spatial Data Analysis (ESDA)
The ESDA technique explores the spatial autocorrelation through the identification of spatial dependence and heterogeneity (Acharya et al., 2018; Dai et al., 2010; Liu et al., 2013). We used commonly used ESDA indicators, Global Moran’s I (GMI) and Local Moran’s I (LMI), in this paper.
We calculated the GMI index as follows (Liu et al., 2018):

where
The range of the GMI index is [−1, 1]. The attributed value of GMI greater than 0 implies a positive spatial autocorrelation. The closer the attributed value of the GMI index is to 1, the greater spatial agglomeration is present. When the attributed value of the GMI index is closed to 0, it indicates a random pattern spatially. The attributed value of the GMI less than 0 implies a negative spatial autocorrelation.
While the GMI reflects the trend of spatial autocorrelation in total, while we still need to identify local spatial heterogeneity. The equation we used for calculating the LMI index was as follows (Anselin, 2010; Shen et al., 2016):

where
A positive LMI value shows a similar observed value in surrounding cities and a spatial autocorrelation, while a negative value indicates diverse observed values in surrounding cities. The Moran Scatterplot shows the observed value of each city and its surrounding cities, which are distributed in four quadrants—HH, HL, LL, and LH. The HH cluster and the LL cluster indicate a spatial association of similar values, and the HL and the LH cluster spatial association of dissimilar values (Anselin, 1996; Liu & Xia, 2019; Lukongo & Rezek, 2018). Details of spatial characteristics are shown in Figure 1.

Moran scatter plot of 26 cities in the YRD.
The Spatial Weight Matrix
To further identify the degree to which urbanization and industrial structure change promote economic growth and to measure the spatial spillover effect, we conducted two spatial weight matrixes. The spatial-lagged variables were obtained by pre-multiplying the original variables by the spatial weight matrixes.
Inverse-distance weight (IDW) spatial matrix

where
Economic weight matrix
The economic weighting matrix also plays a critical role in determining the appropriate form of the spatial model. To reveal the spatial influence on regional economic variables, we established an economic distance matrix and computed as

where
The Spatial Econometrics Model
We followed the Spatial Durbin Model (SDM) proposed by LeSage&Pace, which not only indicates the spatial autocorrelation between our dependent variable and explanatory variables but also reveals the spatial impact of the random shocks.
Based on the SDM model, we established two models that approximate the solo effects and the synergy effects of our explanatory variables on our dependent variable. The two models are specified in equations (11) and (12):
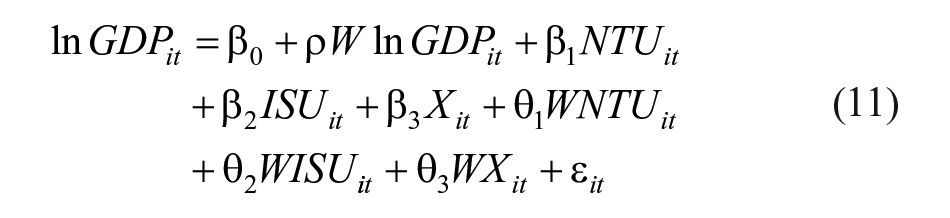

where
The Threshold Effect
The “Tiber selection” mechanism of urbanization stimulates the industrial structure change. At the same time, the industry agglomeration promotes urbanization. Due to the interrelated relationship and diverse levels between urbanization and industrial structure change, we also investigated whether there is a threshold effect of the coordinating development of urban and industry on economic growth. Thus, we followed the threshold model (Seo et al., 2019) and established to panel threshold estimation models, using New-type Urbanization and industrial structure upgrade as threshold variable respectively:
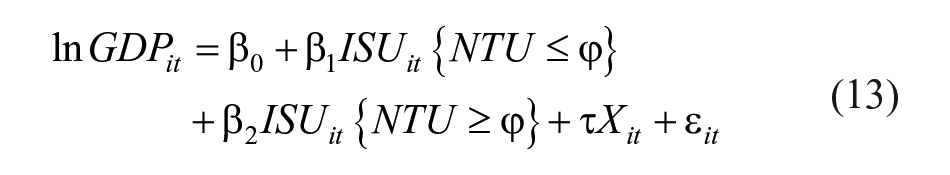

where
Empirical results and interpretation
The Spatial Autocorrelation of Economic Growth
Global spatial correlation analysis on economic growth
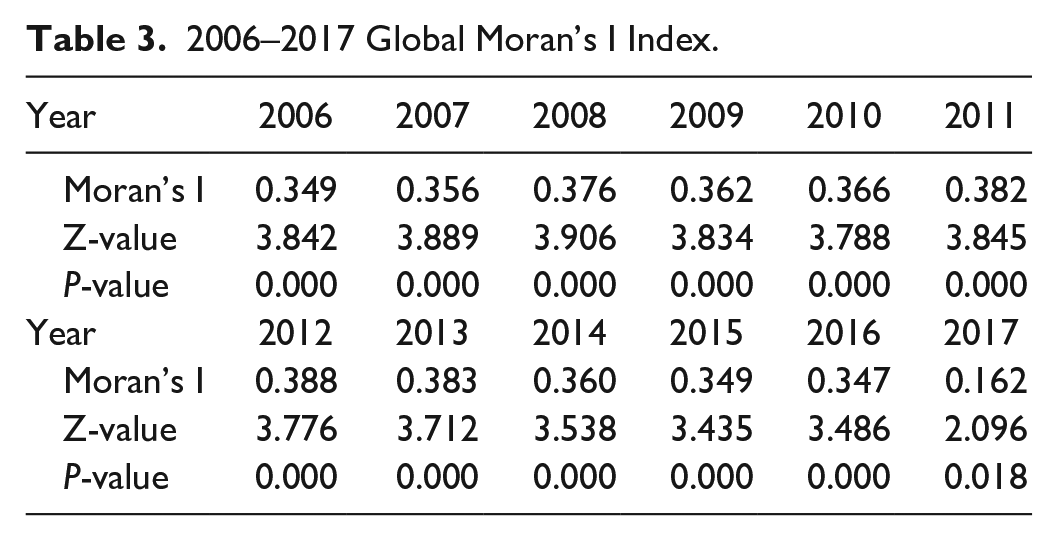
Tables 3 and 4 displays Global Moran’s I values for economic growth in 26 cities in the YRD during the period 2006 to 2017. During our period of observation, the GMI index for economic growth was significantly positive, which indicates the spatial dependence of economic growth and cross-city interaction of economic growth.
2006–2017 Global Moran’s I Index.
Descriptive Statistics.

Global spatial correlation analysis on economic growth
To further investigate the spatial heterogeneity in the YRD, we conducted a single tail test combing with a Moran scatterplot using the LMI index of the year 2006, 2010, 2014, and 2017. As shown in Figure 1, most of the scatters were distributed in the first and third quadrants, indicating a stable spatial dependence of economic growth in the YRD.
The spatial econometric analysis
The relationships of urban and industrial development and economic growth
From the preceding spatial distribution analysis, we conclude strong spatial autocorrelation exists in economic growth. Given that spatial dependence exists in our data, traditional non-spatial regression methods lead to bias. To avoid such bias, we used several spatial panel models to estimate the effects of New-type Urbanization and industrial structural upgrade on economic growth. Table 4 shows descriptive statistics of variables studied in this research.
After conducting the Hausman test, the results indicate that fixed-effect models give us better estimations. We used SAR, SEM, and SDM with the two different weight matrixes, and the estimated results are shown in Table 5. Under both weight matrixes, the results were consistent in all three models even though there were slight differences between the coefficients in each model.
Solo Effect of New-type Urbanization, Industrial Structure Upgrade.

Note. NTU = New-type Urbanization; ISU = Industrial Structure Upgrade; INTP = Technology Progress (log); INFDI = Foreign Direct Investment (log)
The numbers in the parentheses are the t statistic; ***,**, and * indicate the significance level at 1%, 5%, and 10% respectively.
As shown in Table 5, New-type Urbanization was positively associated with economic growth under either weight matrix. Consistent with existing theoretical expectations that urban diverse industry generates knowledge spillover, which is an important source of innovation and agglomeration economies (Collier & Venables, 2017; Tao et al., 2019). Large, diversified urban areas benefit the spatial agglomeration of emerging industries and specialization (Guevara-Rosero et al., 2019; Kang et al., 2020), thus provides human capital and technological resources of higher quality and further promotes productivity. The SAR and SDM panel data model results showed that the coefficients of ISU are significantly positive, demonstrating that increases in the level of industrial structure improve economic development. Even though the YRD is undergoing a shifting of the labor force from the secondary industry to the tertiary industry, the positive effect of the industrial structure change on economic growth still exists.
The synergy effect of urban and industrial development on economic growth
Given the interdependence between urbanization and industrial structure, we also tested their interacting effect on economic growth. As shown in Table 5 the coefficient of the interacting term is significantly positive, indicating a positive effect on economic growth. Further, the effect is larger under the geographic spatial weight matrix than under the economic spatial weight matrix. On one side, urbanization promotes the modernization of traditional primary industry and agglomeration of industries. On the other side, industrial structure change promotes productivity and the quality of production resources. The synergy development of urban and industry attracts new investment, promote local competition and specialization, and thus drives economic growth.
In Table 6, the coefficient of
Synergy Effects of Urban and Industry Development.

Note. NTU = New-type Urbanization; ISU = Industrial Structure Upgrade; INTP = Technology Progress (log); INFDI = Foreign Direct Investment (log)
The numbers in the parentheses are the t statistic; ***,**, and * indicate the significance level at 1%, 5%, and 10% respectively.
Spatial Spillover Effect
To further investigate the spatial effect of urban-industry development on economic growth, we conduct a decomposition analysis.
A shown in Table 7, the coefficients of New-type Urbanization and industrial structural upgrade and their interaction are significantly positive under both weight matrixes in the direct, indirect and total models, which indicates strong spatial autocorrelation across the cities. Therefore, the development of urban and industry do not only depend on a cities’ accumulation of human capital and technology, but also the growth of its neighboring regions.
Direct, Indirect, and Total Effects of SDM Models.
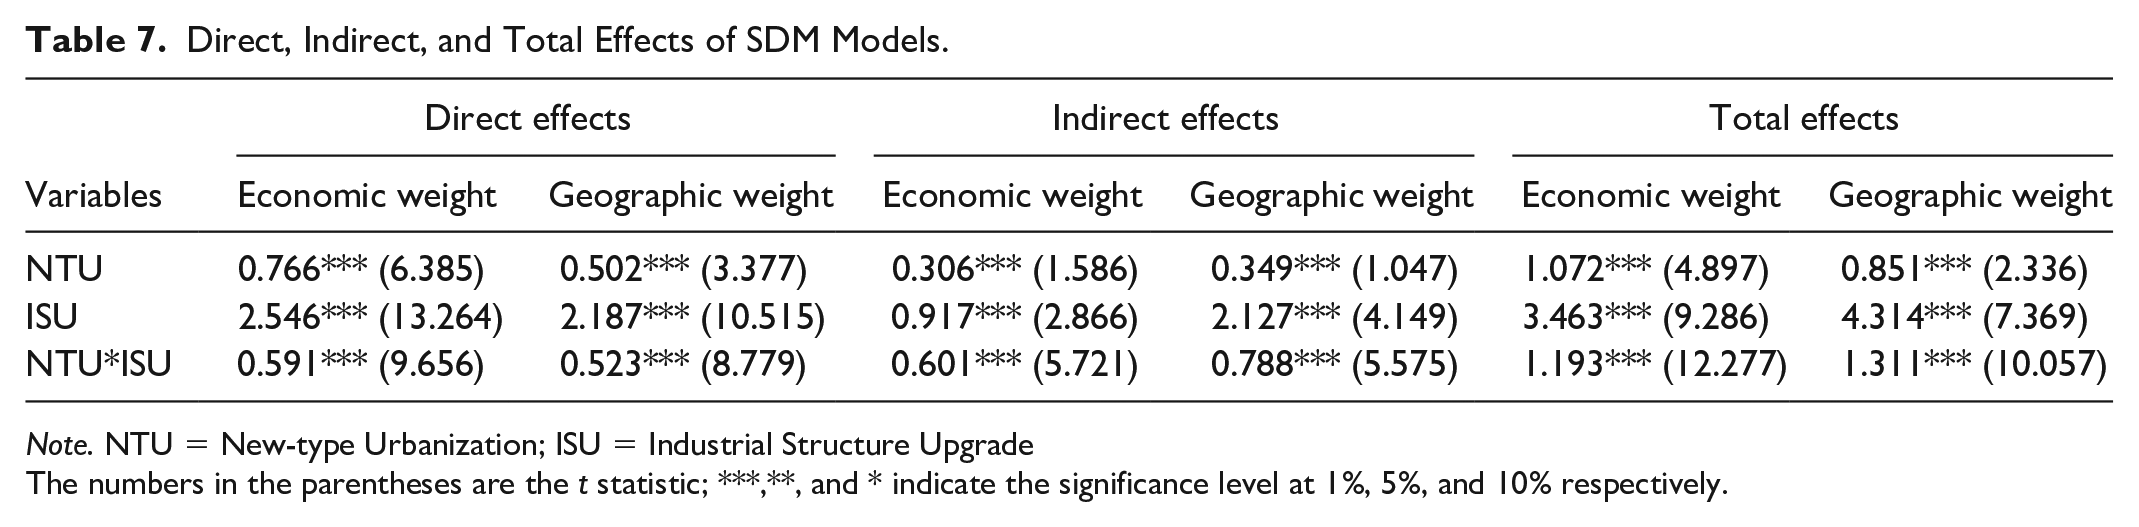
Note. NTU = New-type Urbanization; ISU = Industrial Structure Upgrade
The numbers in the parentheses are the t statistic; ***,**, and * indicate the significance level at 1%, 5%, and 10% respectively.
The Panel Threshold Analysis
The results of our empirical study on the threshold effect of New-type Urbanization and industrial structure change on economic growth are shown in Table 8. As shown in Table 8, the single threshold estimation for New-type Urbanization was significantly positive, with a threshold attribute value of 0.238. The single and double threshold estimations for industrial structure change were positive with an attribute threshold value of 2.433 and 2.520. Threshold estimation and confidence intervals are shown in Figure 2.
Threshold Test.

Note. NTU = New-type Urbanization; ISU = Industrial Structure Upgrade.

Threshold estimation and confidence intervals.
Based on the threshold test, we conducted threshold regressions using New-type Urbanization and industrial structure upgrade as thresholds. As shown in Table 9, the threshold estimation of NTU showed that once the NTU attained the estimated threshold of 0.238, the coefficient of the industrial structure upgrade increased from 0.513 to 0.530, demonstrating that the synergy effect of urban and industrial development exist when urbanization level pass the threshold. Similarly, using industry structure upgrade as the threshold gave us an increase in the coefficient of urbanization from 0.082 to 0.173.
Threshold Regressions.

Note. ***, **, and * indicate the significance level at 1%, 5%, and 10%, respectively.
From the threshold analysis, we conclude that urban and industrial development is dependent on each other, and their effect on economic are larger together than separate.
Conclusion and implications
As one of the most promising economic zones, the economic growth the YRD has attracted considerable attention from scholars and policymakers. In attempt to examine regional heterogeneity and patterns in economic growth, this paper first estimates the spatial agglomeration of economic growth using global and local spatial autocorrelation measure. This paper also explores the quality of urbanization using New-type Urbanization measurement and tracks structure change by calculating the proportion of each industrial sectors each year. In doing so, we were able to study their effects on economic growth using the spatial panel regression technique and the data of 26 cities in the YRD from the period 2006 to 2017. We also conduct threshold estimations to measure the threshold effects.
The results indicate that the global Moran’s I values for economic growth is significantly positive, which demonstrates a strong spatial dependence of economic growth. The results of our estimation of local spatial autocorrelation demonstrate two categories of clustering in the spatial distribution of economic growth: an HH cluster, which centered on cities in Zhejiang province and Shanghai; and an LL cluster, centering on cities in Anhui province. Given that the economic development of in certain cities and their surrounding region tend to be similar, there are no significant differences noted between the cities in the YRD, which take on quite similar spatial patterns.
This paper estimated the co-interacting impact of New-type Urbanization and industrial structure upgrade on economic growth. From the results, we found a significantly positive relationship between the synergy effects and economic growth. After the threshold analysis, we find the threshold after which will the synergy effect benefit economic growth.
The conclusions drawn in this paper also constitute important references for policymakers. First of all, New-type Urbanization generates a selection effect, which gives rise to the agglomeration of high-tech industries and the transformation of traditional industries with high pollution, energy consumption, and water consumption. Policymakers need to consider not only economic growth but also sustainability and potential markets of high-tech industries.
Secondly, given the structural slowdown of economic growth in contemporary China, future policy should take into account the agglomeration economics along with the coordinating development of city and industry. Entrepreneurial firms and emerging industries should be encouraged and provided with subsidies and beneficial policies, which pushes the upgrade of industrial structure.
Thirdly, urbanization is one of the most critical driving forces of domestic demand and economic development. However, the threshold of the synergy effect of urbanization and industrial structure upgrade on economic growth should be taken into consideration. The threshold effect implicated that the development of industry and urbanization should proceed simultaneously to better promote economic growth.
Footnotes
Declaration of Conflicting Interests
The author(s) declared no potential conflicts of interest with respect to the research, authorship, and/or publication of this article.
Funding
The author(s) received no financial support for the research, authorship, and/or publication of this article.