
Abstract
Artificial intelligence (AI) education is becoming increasingly important worldwide. However, there has been no measuring instrument for diagnosing the students’ current perspective. Thus the aim of this study was to develop an instrument that measures student attitudes toward AI. The instrument was developed by verifying the reliability and validity by 8 computer education PhD using a sample of 305 K-12 students. This scale made students’ attitudes toward AI operational and quantifiable. Accordingly, educators can use it to diagnose the current status of students or verify the effectiveness of new AI education methods.
Introduction
Artificial intelligence (AI), according to Coppin (2004, p. 4), is the ability of machines to adapt to new situations, deal with emerging situations, solve problems, answer questions, device plans, and perform various other functions that require some level of intelligence typically evident in human beings. At present, AI is becoming a key variable in the fields of the technology, economy, and politics. The Fourth Industrial Revolution would most probably be determined by the relationship between humans and AI (ETRI, 2019). As a result, AI education is gaining prominence, and many countries, including the United States, Singapore, China, Korea, Australia, and those in the European Union, are exploring ways to effectively integrate AI education into their K-12 curriculum (Chiu, 2021; Heintz, 2021; J. Kim & Park, 2019; Steinbauer et al., 2021).
Scholars are, therefore, primarily concerned about what needs to be taught in AI education (Ali et al., 2019; E.-K. Lee, 2020; Touretzky et al., 2019). For example, Yoo (2019) divided AI-related education into 40 items and examined the importance and performance of each item for graduate students. Yoo found that enhancing openness toward learning about AI was the primary prerequisite for developing other elements of AI education. However, knowledge on openness to learn AI or attitudes toward learning AI are mostly public opinions (Ikkatai et al., 2022; Schepman & Rodway, 2020). While we can gain some insights about motivation, perception, and sentiment toward AI from previous studies that measured attitudes toward various forms of technology-enhanced learning (Cheung & Vogel, 2013; Dunn & Kennedy, 2019) and attitudes toward science, technology, engineering, and mathematics (STEM) education (Cherry et al., 2020; Cukurova et al., 2020; Gaines-Ross, 2016; Gherheș & Obrad, 2018; Manikonda & Kambhampati, 2018), none of them specifically focused on attitude toward AI education.
If students do not develop a positive attitude toward professional skills learning, they are less likely to master it regardless of the effectiveness of their education (Ajzen, 1991; Fredrickson, 2001). Thus, measuring attitudes toward AI can be an important factor in the success or failure of AI education. Our review of the literature showed that many of the studies on learners’ attitudes toward AI for learning either measured only computational thinking (K. Kim, 2019) or used unvalidated modified instruments (K. Kim, 2019; Y. Lee, 2019) and self-developed surveys with open-ended questions (Y. E. Kim & Kim, 2019; Park & Shin, 2017; S. Shin et al., 2017, 2018; N. M. Shin & Kim, 2007). Most importantly, of these studies have not used measurement instrument that have been developed to be reliable and validated. The purpose of our study, therefore, is to develop a standardized instrument that measures K-12 student attitudes toward AI. Specifically, we would like to identify questions that can be used to objectively measure learners’ attitudes toward AI. We would also like to further test the validity of categorizing student attitudes toward AI by the traditional approach that suggests attitude is made of three components—cognitive, affective, and behavioral. Our study, we believe, is significant because it would be the first study that presents K-12 perceptions on AI and brings AI education into operational and quantifiable areas.
Theoretical Background
Attitude
In modern times, attitude is described as a “psychological tendency, expressed by evaluating a particular entity with some degree of favor or disfavor” (Eagly & Chaiken, 1993). The traditional approach defines attitude as consisting of three complementary and not mutually exclusive components (Bagozzi, 1978; Fishbein & Ajzen, 1972; Metsärinne & Kallio, 2016): (1) the emotional component signifies the positive-negative emotional relations or feelings one has toward an object or activity; (2) the behavioral component indicates the action tendencies one has to respond to an object in a particular way; and (3) the cognitive component marks the content of one’s thoughts, such as one’s beliefs regarding what constitutes a fact.
The following approaches are useful in investigating attitude as a determinant of the use of IT or other new technologies: the theory of reasoned action (TRA; Fishbein & Ajzen, 1975), the theory of planned behavior (TPB; Ajzen, 1991), and the technology acceptance model (TAM; Davis et al., 1989). TRA maintains that one’s attitude toward a particular behavior and the subjective norms that condition that behavior encourage or discourage performance of that behavior. TPB adds perceived behavioral control to the two factors affecting intention in TRA. The TAM considers perceived usefulness, which is “the prospective user’s subjective probability that using a specific application system will increase his or her job performance within an organizational context” (Davis et al., 1989), and perceived ease of use, which is “the degree to which the prospective user expects the target system to be free of effort” (Davis et al., 1989, p. 985); both affect attitude and behavioral intention. Indeed, many studies have investigated how attitude predicts and affects behavior (Bohner & Dickel, 2011; Glasman & Albarracín, 2006; Gorges et al., 2012; Petty et al., 2009; Steinmetz et al., 2016).
As for education, these attitude-behavioral intentions may appear as learning intentions as confirmed by studies related to mathematics (Huang et al., 2016), science (Khine, 2015), and engineering education (Alias et al., 2018). According to the TPB (Ajzen, 1991) students’ attitudes toward professional skill learning play an important role in whether they actually acquire that skill, while at the same time positive attitudes toward learning positively influence students’ learning intentions. Accordingly, it has been found that students’ positive attitudes can improve learning achievements (Alias et al., 2018; Cukurova et al., 2020) and help curriculum developers and teachers optimize lessons (Dunlap & Dugger, 1991; Yu et al., 2012). This is also related to the idea that “people’s general attitudes toward AI are likely to play a large role in their acceptance of AI” (Schepman & Rodway, 2020). Therefore, to successfully implement AI education, there is a need to measure and understand students’ attitudes toward AI.
Attitude Measurements
This study draws from the methodology used in previous studies to determine the reliability and validity of instruments used for measuring attitudes. References include attitudes toward technology (Ardies et al., 2013; Choi et al, 2009; C. S. Lee 2008; Svenningsson et al., 2018), mathematics (Hannula et al., 2016), STEM (Benek & Akcay, 2019), engineering (Choi et al., 2009), and science education (Glynn et al., 2009), as well as evaluations of the effects of software (SW) education on attitude (Park & Shin, 2017). Further, we referred to the study by Schepman and Rodway (2020), where a scale was developed to measure the general attitudes toward AI.
Materials and Methods
Research Procedure
First, to solve research problems, related literature and previous studies as shown in Tables 1 and 2 were examined, and 52 preliminary questions for measuring attitudes toward AI were selected. Second, a 3-point Likert scale consisting of the following choices: “essential,” “useful but not essential,” and “not necessary” (Likert, 1932), was used to examine experts’ opinions about the validity of each item. Content validity refers to how well a survey or test measures the construct that it sets out to measure. The data were examined by using a content validity ratio (CVR) test (Lawshe, 1975). A total of 26 items that did not satisfy the CVR value were removed. Third, the remaining 26 questions were gathered into a questionnaire that was administered to 305 upper-elementary, middle, and high school students in Seoul, Korea. Students were asked to respond to statements using a 5-point Likert scale ranging from 1 (strongly disagree) to 5 (strongly agree). Lastly, exploratory factor analysis (EFA) and confirmatory factor analysis (CFA) were conducted, and the final questions were selected. Descriptive statistics and distribution of total scores were prepared for student responses. The study procedure is shown in Table 3.
Previous Studies on Attitude Measurement (Attitude Scale).

Note. SW = software education.
Measurement and Evaluation in Previous Studies of AI Education (AI Education Scale).

Research Procedure.

Preparation of Test Questions
Two categories of studies were referenced to develop the attitude scale for AI. First, studies related to attitude measurement conducted in Korea, the United States, Turkey, and Sweden were considered (Table 1). The purpose of the studies was to measure attitudes toward SW, STEM, and science education. As a result of analyzing the sub-elements classified in these studies, it was possible to categorize them into nine categories such as learner’s career, experience of interest in each subject, necessity of learning each subject in school, perceived usefulness (for the learner), perceived usefulness (for the society), acceptance of each subject, career related to each subject, each subject for all genders, and perceived ease of use of each subject. These tests had a range of 14 to 58 questions with either true/false and 5- or 7-point Likert scale responses.
Second, the category of studies that we referred to were all AI-based (Table 2). All these studies used open-ended questions and were administered to students at different grade levels to understand their perceptions about AI and robots.
A total of 52 items were set up through the process of referring to the range of these items, integrating common items among the questions related to the research problem, and excluding unrelated items.
Expert Validity Test
Experts who participated in the preliminary item validity evaluation included professors of computer education and doctors who majored in computer education. The panel had eight members, which is acceptable (Lynn, 1986). The CVR was verified through a 3-point Likert scale (Lawshe, 1975). The formula for calculating the CVR is as follows.

The CVR score for this panel should be 0.75, which means that more than seven out of eight respondents designate an item as “essential” (Lawshe, 1975).
The CVR is mostly adopted to select or exclude individual items testing its validity (Wilson et al., 2012). Among the initial 52 items, 26 items did not satisfy the CVR value requirements. Our final student questionnaire, therefore, consisted of the remaining 26 items (listed in Appendix 1).
Main Survey for Students
In public schools in Korea, AI classes are not part of the regular curriculum. Therefore, students with experience in SW education, most relevant to AI education, were surveyed. The survey was conducted twice from November 2019 to December 2019, and in December 2021. Both surveys were conducted with the same tool, which is presented in Appendix 2. Dataset 1 was provided by 119 students from grades 5 to 6, and Dataset 2 was provided by 186 students from grades 6 to 11 (listed in Table 4). All procedures performed in this study were in accordance with the ethical standards of the Institutional Review Board Sungkyunkwan University (approval number SKKU2019-11-012). Consent from the relevant guardians was obtained.
Demographics of Respondents in the Main Study.

Exploratory Factor Analysis
EFA is one of a family of multivariate statistical methods that attempts to identify the smallest number of hypothetical constructs that can parsimoniously explain the covariation observed among a set of measured variables (Watkins, 2018). EFA was conducted on Dataset 1, the result of 119 students’ responses, and through this, the validity and relevance of sub-factors and items were reviewed. Prior to factor analysis, the Kaiser–Meyer–Olkin (KMO) test was conducted, and the suitability of factor analysis was identified using Bartlett’s test. Subsequently, to understand the validity of the constituent concept of the 26 selected scale questions, EFA was performed to extract potential factors using the varimax method and principal component analysis. Additionally, Cronbach’s alpha was used to check the reliability of the instrument.
Confirmatory Factor Analysis
CFA is a type of structural equation modeling that deals specifically with measurement models-that is, the relationships between observed measures or indicators and latent variables of factors (Brown, 2015). In such CFA, validity is secured when the standardized λ value is .5 or higher, the average variance extracted (AVE) is .5 or higher, and the construct reliability (CR) is .7 or higher. Additionally, the absolute fit index, an index that absolutely evaluates the degree of conformity between the collected data and the research model, was investigated. The incremental fit index, which compares the index indicating the accuracy of the structural equation model of the study with the model in which correlation between variables was not set, was also investigated.
Results
In the expert validity test, a group of eight experts verified the content validity of 52 items constructed through literature research. They evaluated the content validity according to a 3-point scale. Consequently, ambiguous expressions with the phrases “anyone” or “make everything good,” items about gender differences in attitude toward AI, and 26 negative questions, such as AI is difficult, were rejected as they did not meet the CVR value. Thus, the final survey questionnaire for students included the remaining 26 question items.
The result of EFA using Dataset 1 showed a KMO value of 0.937, indicating that the item selection was good. Additionally, Bartlett’s sphericity was found to be significant (χ2 = 2,645.682, df = 325, p = .000); common factors existed and were appropriate. Accordingly, three sub-factors were extracted, and factor 1 was named “Behavioral,” factor 2 was named “Affective,” and factor 3 was named “Cognitive.” Cronbach’s alpha of all factors indicated excellent reliability (Tavakol & Dennick, 2011). The above results and the eigenvalue and cumulative percentage for each factor for the development of the instrument that measures attitudes toward AI are shown in Table 5.
Results of Exploratory Factor Analysis.

Note. Extraction method = principal component analysis; rotation method = varimax with Kaiser normalization.
Bold text indicates the same category.
A CFA was performed using Dataset 2 to confirm the validity of the items. Validity is secured when the standardized λ value is .5 or higher, the AVE is .5 or higher, and the CR is .7 or higher. After performing a CFA on the sub-factors for each component, standardized, and appropriate λ, AVE, and CR values were all secured, as illustrated in Table 6, indicating the model used in the study was valid.
Results of Confirmatory Factor Analysis.
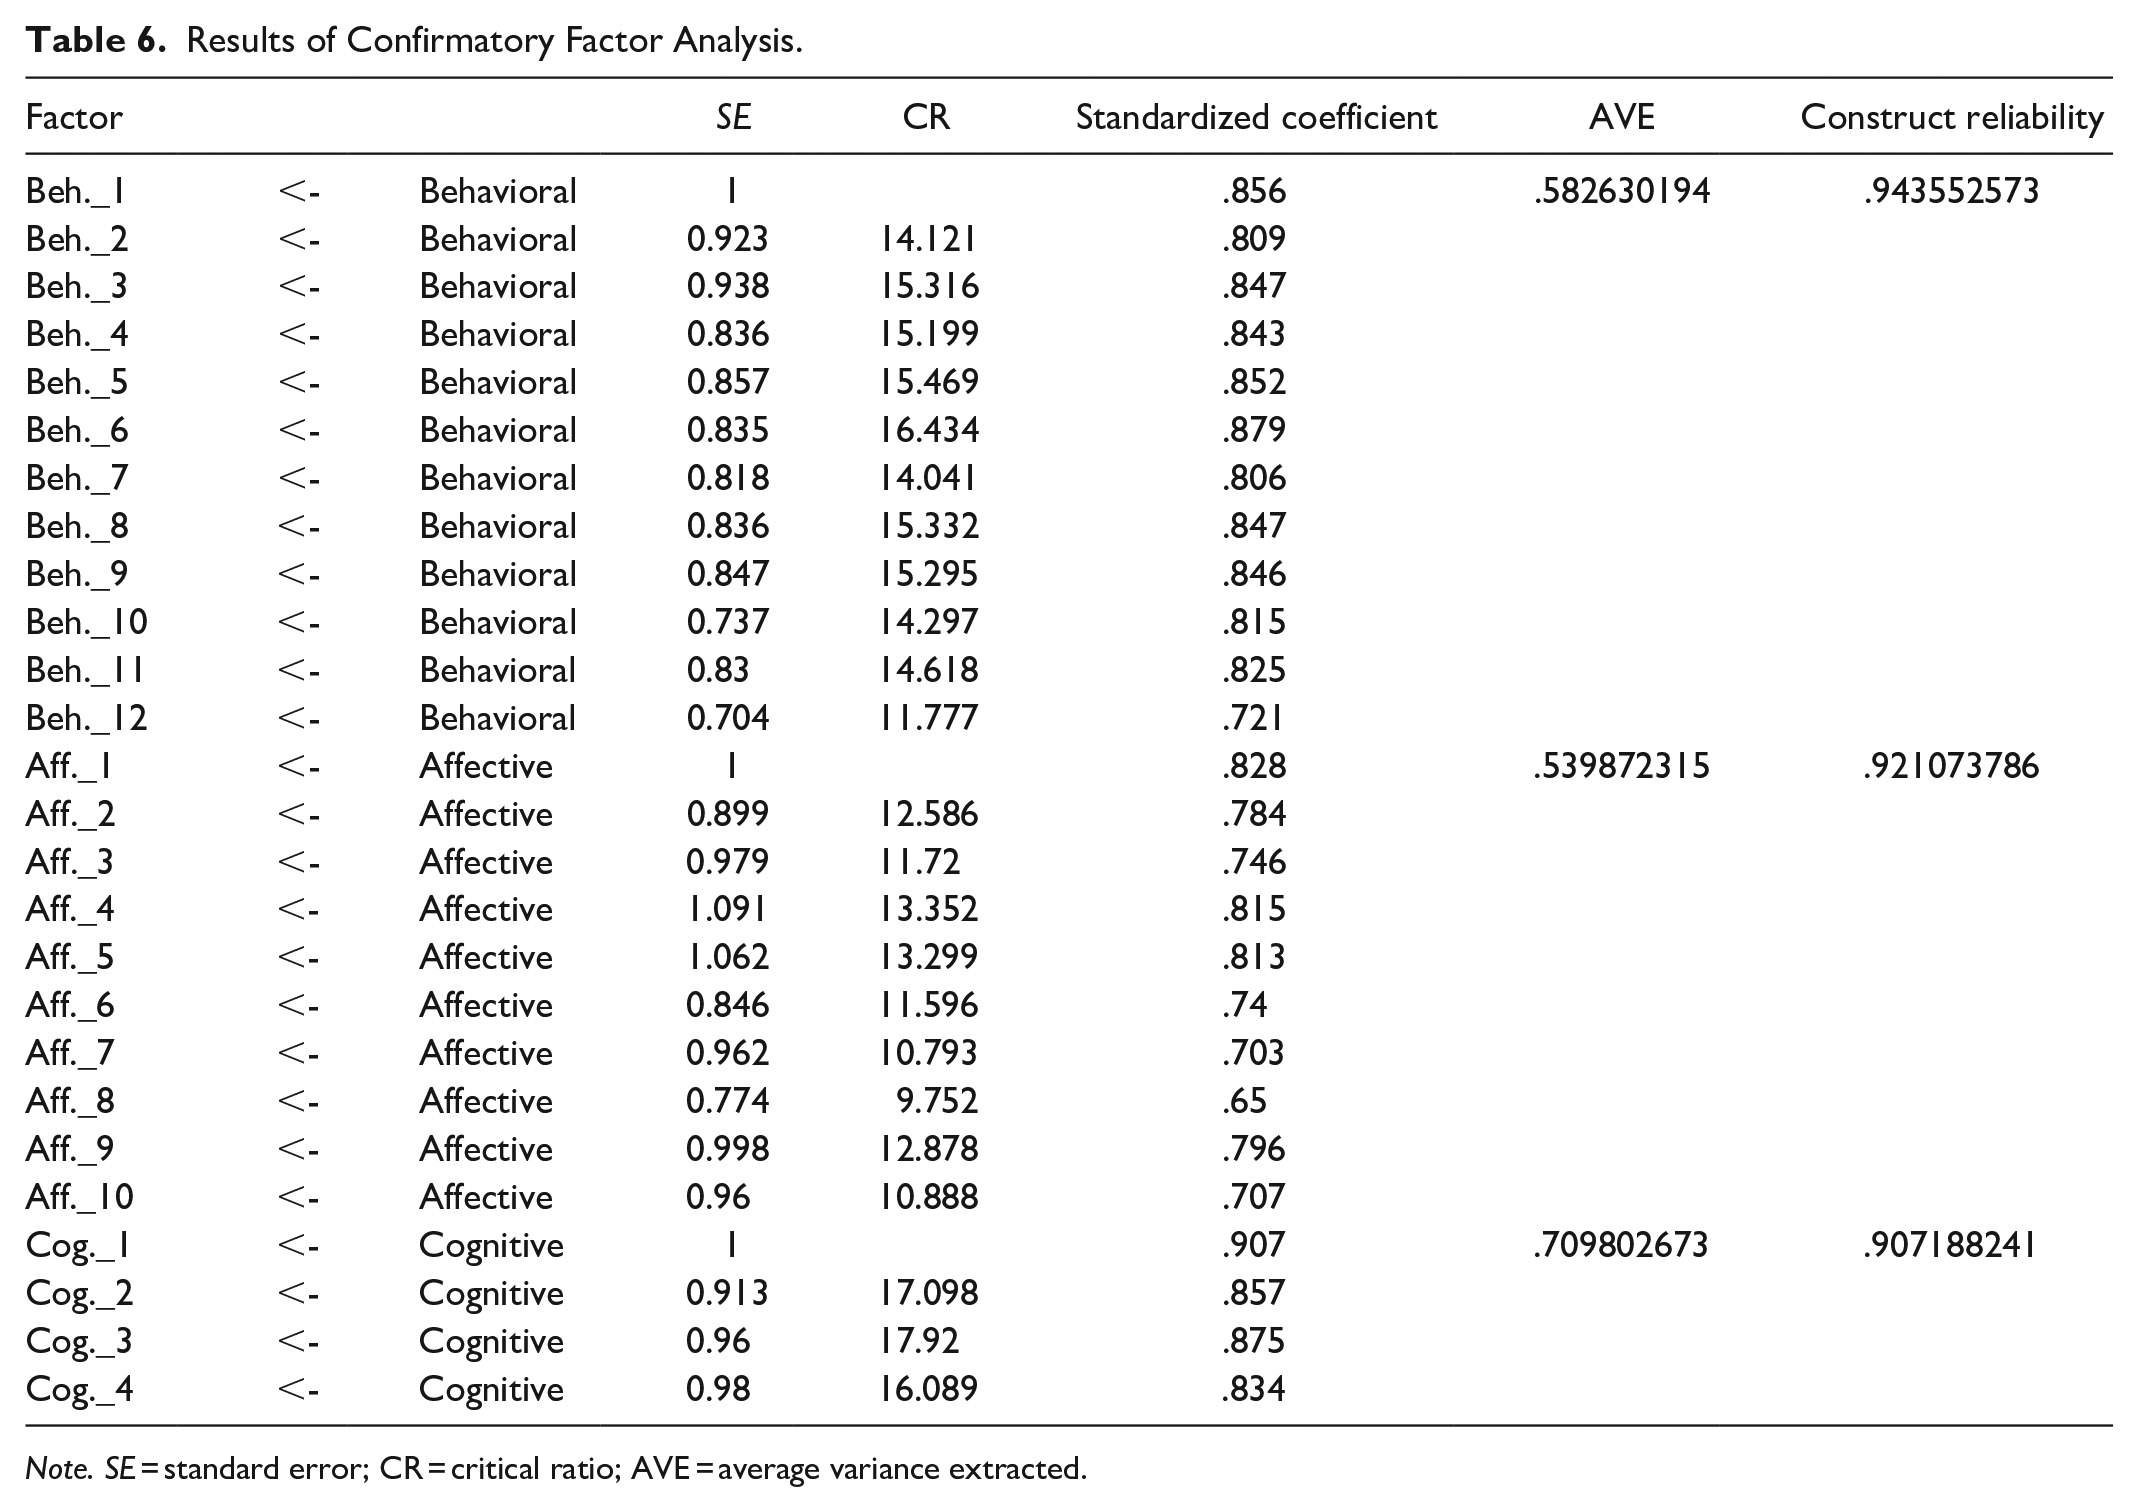
Note. SE = standard error; CR = critical ratio; AVE = average variance extracted.
Among the absolute fit indexes that can be recognized, it is appropriate for the root mean square error of approximation (RMSEA) to be between 0.05 and 0.1, and the standardized root mean square residual (SRMR) to be less than or equal to 0.5. Furthermore, among the incremental fit indexes, both the Turker–Lewis index (TLI) and the comparative fit index (CFI) are considered to be 0.9 or higher. In the model adopted for this study, RMSEA was 0.075, SRMR was 0.047, TLI was 0.928, and CFI was 0.937. In other words, all the mentioned goodness of fit were satisfied.
To summarize, 3 factors and 26 questions were found to be the most appropriate. This measurement instrument was named “Student Attitude Toward Artificial Intelligence” (SATAI). The detailed questionnaires are the same as those in Appendix 2.
Discussion
SATAI was developed and validated after a literature review using two groups of respondents. In particular, the results of the EFA for Dataset 1 showed the SATAI scale’s factor structure. The SATAI scale consists of 26 items comprising 3 components (cognitive, affective, and behavioral factors), and each question is measured using a 5-point Likert scale ranging from 1 (strongly disagree) to 5 (strongly agree). The scores for these items can be summed (ranging from 26 to 130) to represent a student’s attitude toward AI: a higher score indicates a positive attitude toward AI and the likelihood that a student will be an active participant of AI education.
For example, descriptive statistics on the responses of a total of 305 students who participated in this study are as follows. The average of Cognitive Components consisting of four questions was 3.57 (SD = 0.986), the average of Affective Components consisting of 10 questions was 3.72 (SD = 0.841), and the average of Behavioral Components consisting of 12 questions was 3.16 (SD = 1.068). The mean and standard deviation of each item can be confirmed in Table 7.
Descriptive Statistics of the 305 Student Responses.

Figure 1 shows the distribution of the total score of the questions answered by 305 people. According to this, the total distribution of students tends to gradually increase to 1.3% at 26 to 40, 6% at 41 to 55, and 30% at 56 to 70, and then slightly decreases afterwards. Table 7 and Figure 1 make it possible to confirm the characteristics of AI of the 305 students who responded in this study. That is, “the average of these students” attitude toward AI considering the Affective component was the highest at 3.72, with the Cognitive and the Behavioral Components at 3.57 and 3.16, respectively, and “The distribution of total scores is the highest in the middle” can be seen. Through these examples, we confirmed that the students’ attitudes toward artificial intelligence have become measurable areas. In other words, the distribution scores obtained through the SATAI can be used to operatively diagnose and compare attitude changes in students before and after integrating AI into education.

Distribution of total scores.
In previous studies, open-ended questions of subjective criteria were used to verify the effectiveness of AI education (Y. E. Kim & Kim, 2019; Park & Shin, 2017; S. Shin et al., 2017, 2018; N. M. Shin & Kim, 2007). Other studies used instruments to measure attitudes toward other subjects, without validating them (K. Kim, 2019; Y. Lee, 2019). The SATAI can be differentiated from conventional research because it was developed specifically for AI education, thus enabling teachers to quantify students’ attitudes toward AI.
Conclusions
This study is relevant in that it develops a scale that measures student attitudes toward AI and tests the validity of that scale. First, the importance of attitudes toward AI education was confirmed through a literature review. Literature revealed that learners of AI education felt that they were encountering a new subject. Thus, measuring their attitudes can provide instructors with ideas for curriculum design that encourage students to have a positive attitude toward AI learning (Ajzen, 1991; Khine, 2015). As for education through AI, AI appeared as a new technology to learners, which reinforced the importance of attitude through the TAM. Hence, in our study, a standardized instrument for measuring a learner’s attitude toward AI was developed with attention to students’ cognitive, affective, and behavioral attitudes. On the one hand, AI education is new, so there are no traditional curriculum or teaching methods (E.-K. Lee, 2020; Touretzky et al., 2019). On the other hand, SATAI can help teachers objectively measure students’ attitude toward AI. Moreover, instructors can use the test scores to design, modify, apply, and customize educational programs to meet learner needs. These advancements contribute to the emerging philosophical cornerstones of AI education. SATAI results, we believe, can be applied to verify the effects of AI-related education for other K-12 students outside the population used in this study.
This study has a few limitations. First, the measure developed can be used to verify the students’ attitudes toward AI, but cannot measure conceptualizations of AI. Therefore, future researchers should develop a scale that measures a learner’s concept of AI. Second, although the results of CFA on this dataset are strong evidence that the tool does not leverage age-related differences, there may be limitations in the generalization of the study by surveying 305 elementary, middle, and high school students. Future studies should include a wider range of participants, including individuals in other regions.
Footnotes
Appendix
Student Attitudes Toward AI (SATAI).

| Domain | No. | Item | 5 | 4 | 3 | 2 | 1 |
|---|---|---|---|---|---|---|---|
| Cognitive components | 1 | I think that it is important to learn about AI in school. | |||||
| 2 | AI class is important. | ||||||
| 3 | I think that lessons about AI should be taught in school. | ||||||
| 4 | I think every student should learn about AI in school. | ||||||
| Affective components | 5 | AI is very important for developing society. | |||||
| 6 | I think AI makes people’s lives more convenient. | ||||||
| 7 | AI is related to my life. | ||||||
| 8 | I will use AI to solve problems in daily life. | ||||||
| 9 | AI helps me solve problems in real life. | ||||||
| 10 | I will need AI in my life in the future. | ||||||
| 11 | AI is necessary for everyone. | ||||||
| 12 | AI produces more good than bad. | ||||||
| 13 | AI is worth studying. | ||||||
| 14 | I think that most jobs in the future will require knowledge related to AI. | ||||||
| Behavioral components | 15 | I want to work in the field of AI. | |||||
| 16 | I will choose a job in the field of AI. | ||||||
| 17 | I would participate in a club related to AI if there was one. | ||||||
| 18 | I like using objects related to AI. | ||||||
| 19 | It is fun to learn about AI. | ||||||
| 20 | I want to continue learning about AI. | ||||||
| 21 | I’m interested in AI-related TV programs or online videos. | ||||||
| 22 | I want to make something that makes human life more convenient through AI. | ||||||
| 23 | I am interested in the development of AI. | ||||||
| 24 | It is interesting to use AI. | ||||||
| 25 | I think that there should be more class time devoted to AI in school. | ||||||
| 26 | I think I can handle AI well. |
Note. The scale uses 5 points for strongly agree, 4 points for agree, 3 points for neutral, 2 points for disagree, and 1 point for strongly disagree.
Author Contributions
All authors contributed to the study conception and design. Material preparation, data collection, and analysis were performed by Woong Suh. The first draft of the manuscript was written by Seongjin Ahn and all authors commented on previous versions of the manuscript. All authors read and approved the final manuscript. Woong Suh and Seongjin Ahn are co–first authors.
Availability of Data and Materials
The data that support the findings of this study are available from Sungkyunkwan University, but restrictions apply to the availability of these data, which were used under license for the current study, and so are not publicly available. Data are however available from the authors upon reasonable request and with permission of Sungkyunkwan University.
Ethical Approval
All procedures performed in this study were in accordance with the ethical standards of the Institutional Review Board (IRB) at Sungkyunkwan University (approval number SKKU2019-11-012-003).
Informed Consent
Written informed consent was obtained from all the guardians of students who participated in this study.
Declaration of Conflicting Interests
The author(s) declared no potential conflicts of interest with respect to the research, authorship, and/or publication of this article.
Funding
The author(s) received no financial support for the research, authorship, and/or publication of this article.