
Abstract
This study aims to examine the direct and indirect links between behavioral biases and investor’s investment decisions via the mediating role of risk perception through structural equation modeling. The study is conducted among individual investors who are engaged in investment for several years in Pakistan Stock Exchange. Purposive sampling technique was used for data collection and the sample size was consisted of 450 questionnaires. The findings contribute that risk perception mediates between blue-chip stocks and investment decisions. Furthermore, risk perception does not play the mediating role between herding bias, disposition effect, and investment decisions. However, the disposition effect has a strong direct relationship with risk perception. The study is beneficial to individual investors who can make investment decisions by self-estimation rather than to follow the others’ opinion. The proper training and education to the investors is also an appropriate path to overcome these biases. Risk is the major factor that discourages investment decisions but blue-chip stocks are a major risk eliminating factor while building investment decisions. Most of the prior studies focused on behavioral biases and investment decisions of individual investors but this study contributed to the mediating effect of risk perception. Human capital, anomalies, computer literacy, and artificial technology could also be used as a mediator and moderator for future orientation.
Keywords
Introduction
Behavioral finance endorses to understand the different factors of an investor’s behavior like judgment, emotional, social, intellectual factors, and restricted cognitive capabilities which are significant drivers of stock market (Trifan, 2020). Investment decision making based on those factors is quite difficult and intricate for investors, hence seeking an expert advice is more pragmatic in these circumstances. Moreover, the recent developments and enormous growth of artificial intelligence application in financial services are well suited for client’s needs in terms of transparency, cost efficiency, and accessibility (Shanmuganathan, 2020). After the integration of financial markets in the world, investors need to be better informed, more aware, and knowledgeable when it comes to monitoring and managing their finances. This becomes essential due to the complexity of financial products and services offered to the public, which requires informed decisions (Hastings et al., 2013). Investors do not act rationally all the time, indeed the emotions, heuristic and behavioral biases are substitally associated with investment decisions (Bakar & Yi, 2016; Baker et al., 2019; Bhatia et al., 2020). This is irrational behavior which happens due to misrepresenting in perception and false judgment of investors that he or she is a perfect rational investor of the stock market (Babajide & Adetiloye, 2012). The repeated pattern of irrational behavior in the decision-making process includes inconsistency, inability, or incompetency in the way of investment choices under uncertain conditions (Bernstein, 1996; Jain et al., 2015). The irrational behavior makes them biased that deviates the market from its actual position.
The investor has an attitude of risk avoidance while investing in a smooth and stable level of risk tendency (Douglas & Wildavsky, 1982), risk perception (Weber et al., 2008), and risk propensity (Combrink & Lew, 2020). Investor’s risk attitude becomes stable but the risk perception is dynamic in nature which can be changed in different situations. Risk perception increases the transaction frequency and reduces the investment in stock market (Cho & Lee, 2006). It means the perception of risk harms the decision-building of investors to invest in the stock market. All investors have different visions and they behave differently which is considered equally important as they act on behalf of other individuals. These investors are behaviorally biased for investment patterns which in return create over reaction and under reaction in the market (Zahera & Bansal, 2018). Market participants follow the herding behavior because of low-risk propensity and perception that adversely affect their investment decisions. Herding behavior greatly affects the financial choice and decision-making process of investors (Kudryavtsev et al., 2013). Baddeley et al. (2010) studied that herding behavior widely affects the process of individual investor’s decision-building power to buy and sell stocks.
Every single investor prefers to invest in more profitable and highly liquidated stocks. They always act wisely in choosing the stocks and being an investor it must be clear that where investors should invest. But they are psychologically biased in their personal decisions and do not make fair judgments that would ultimately cause to change in investment decisions. Consequently, the disposition effect has been incurred in the market (Frydman et al., 2014). It is the tendency of investors who sell winners’ stock too early and hold losers for a long time until these stocks convert into the winning ones (Frydman et al., 2014; Henderson, 2012). It heavily affects the decision making (Arshad & Ashraf, 2018; Henderson, 2012). Pompian (2011) gave the strong indications that every investment statement comes from an investor’s profile, and it is the most efficient process to control the behavioral biases. The investment statement about an investor’s profile helps to identify the behavioral bias in the choice of investment. Behavioral biases (herd bias, anchoring, mental accounting, and overconfidence bias) have a strong relationship with the decision building process of investors (Kartašova, 2013; Parveen et al., 2020). Overconfidence investors and managers notably drive the firm value upward with lack of precise directions (Shah et al., 2018).
Here, the phenomenon of “Blue chip” is considered for investment choice. Blue-chip stocks represent the market’s benchmark which holds maximum capital (Annaert et al., 2011). These stocks are well established and have a strong reputation in the market (Çal & Lambkin, 2017). Blue-chip stock plays a vital role as a risk eliminator for some products of a firm or a firm considering it as perceived advantage over the risk factors (Bailey & Ball, 2006). The organizations that have blue-chip stocks, brand equity, and strong goodwill in the market make a positive impact on the company’s financial performance (Aspara, 2013; Seddon & Currie, 2017). Investors investing in blue-chip company’s stocks have low risk perception and they are optimistic about investment in those stocks. They have risk averse attitude that enforce them to invest in blue-chip stocks. These firms pay huge returns on investments (Casidy & Wymer, 2016) which are helpful for the reduction in perceived risk of investors with investment in blue-chip stocks (Liébana-Cabanillas et al., 2018).
In Pakistani markets, behavior widely influences the investment decision of investors which means Pakistani investors do not have any idea about the rationality principles in their decisions (Akbar et al., 2016). Pakistan is designated by a collectivist culture rooted in strong community and family networks where investors are perhaps less risk-averse. It has been argued that collectivist societies cause individuals to be trapped more by behavioral biases (Kim & Nofsinger, 2008). Investors’ decisions in collectivist culture are subjective to peer pressures and social influence rather than the processing based on private information. This study addresses the unexplored area of Pakistan where the supremacy of behavioral factors in the presence of risk perception and investment decisions may considerably be higher than other countries due to collectivism. Risk perception is the main influential factor in behavioral biases that mainly affects risky investment decisions. The exact nature of the relationship of behavioral biases with investment decisions under the mediating role of risk perception is not well understood. The independent impact of behavioral biases on investment decisions in the presence of risk perception is still under discussion. Although some of the researches have been conducted in Pakistan; but the combined effect of all these variables helps to identify the intensity of strengths and weakness of those particular factors (Riaz & Hunjra, 2015). It would also help us to understand the weight attached to each factor by investors while making investments.
A closer look at the literature reveals several gaps and shortcomings. The studies conducted in Pakistan focused on behavioral biases and investment decision making of investors (Ali et al., 2021; Anum, 2017; Asab et al., 2014; Aurengzeb, 2022; Ayub, 2018; Badshah et al., 2014; Farooq & Sajid, 2015; Ishfaq, 2015; Khan et al., 2018, 2021; Mahmood et al., 2020; Mumtaz & Ahmad, 2020; Parveen et al., 2021; Quddoos et al., 2020; Rasheed et al., 2018; Raza, 2014; Rehan et al., 2021; Zafar & Siddiqui, 2020). This study contributes to explore the investment behavior in blue-chip stocks with mediating role of risk perception. It gave a new dimension related to this area of research. In general, prior work is limited to a subset of western countries which focused on economic, social, and behavioral determinants of stock market investments but is limited in Pakistani region (Akbar et al., 2016). Another condemnatory factor that findings of studies conducted in the western world are burdensome to generalize in emerging and developing nations due to difference in values, culture, literacy level, and financial market infrastructure. Therefore, it becomes necessary to see what behavioral biases affect investment decisions in the presence of risk perception. The study identifies previously unexplored areas regarding economic, social, and behavioral aspects of investment decision making of investors in collectivist countries, particularly Pakistan. Hence, the contributions of the present study help the investors in designing the current and future portfolio of securities accordingly.
The remainder of this study as follows: Section 2 presents the related literature review and proposed hypotheses. Section 3 discusses the proposed research methodology while Section 4 represents the results and findings. Section 5 discusses the results and lastly, Section 6 provides the detail about the conclusion of study.
Theoretical Framework and Hypothesis Development
Prospect theory explains the risk avoidance tendency of investors relating to hold loser stock and sell winning one (Shefrin, 2002). It is expressed by Shefrin and Statman (1985) that price of stocks is a reason of disposition to avoid risk. The disposition effect is greatly dealt with prospect theory, regret aversion, self-control, and mental accounting bias. Investors make decisions to reduce losses and gain more to encourage them in holding losers’ stocks too long and sell the winning ones too early. On the other hand, herding behavior is another phenomenon in which investor ignores his or her own market information and follows the market participants. They observe the others’ information and discourage their own information (Bikhchandani et al., 1992). In financial markets, investors herd the other’s actions or stock market movement and completely ignore their private information (Baddeley et al., 2010). It is the human behavior that mimics the actions of major investors rather than private information (Lee et al., 2011). This behavior is due to investors’ sentiments that are connected with behavioral finance (López-Cabarcos et al., 2020). These sentiments are highly sensitive on account of upgrade and downgrade announcements, implying the analyst to yield the worthwhile trading indications to uninformed traders in the market (Kim et al., 2019). These sentiments are pessimistic due to the release of bad news, significantly affects the stock returns’ response to downgrade announcement. Thus, investor’s sentiment is one possible cause of stock market reactions to change the analyst recommendations.
Risk aversion theory is based on the phenomenon of risk avoidance by the investor. Blue-chip stocks perform the function of risk eliminator of stocks which emphasize on perceived gains and benefits (Bailey & Ball, 2006). Scholars considered blue-chip stocks in behavioral finance as an investment in strong and well reputed organizations in order to avoid risk (Çal & Lambkin, 2017). Foreign investors are more likely to invest in Blue-chip stocks (Umutlu et al., 2013). Financial decisions related to investment in stocks have a great concern with a high level of risk of losses (Aydin et al., 2005; Grewal et al., 1994). These financial decisions are correlated with the risk factor, especially in the purchase or sale of investment (Noussair et al., 2014). It contributes to the perceived risk of an investment. Perceived risk is referred to as the uncertainty and consequences related to a particular investment (Schiffman et al., 2011). Awais et al. (2016) defined that perception of risk and investments are negatively related to each other.
Grinblatt and Han (2005) used secondary data to identify the disposition effect and stock returns. The study suggested that disposition motivates the trading and price movement in the market. They explain that difference between market price and disposition effect are better predictor of expected future returns than past returns. Statman et al. (2006) measured the disposition effect and overconfidence through secondary data in NYSE. The behavioral factors significantly explain the stock returns. Consistent with this, Goetzmann and Massa (2003) used the secondary data that exposure to disposition factor seems to be priced. The behavioral factors capture the stochastic change in the percentage of disposition investors which negatively explain the stock returns. Ahmed et al. (2019) measure the herding behavior in Pakistani financial market through secondary data and found the significant herding behavior. In this connection, Rashid et al. (2019) reported that investors’ sentiment and momentum factors significantly impact the market risk, size, and value premiums in the prediction of stock returns.
Disposition Effect and Risk Perception
Disposition effect is the investor’s tendency to hold losing and sell the winning stocks immediately. Statman (1999), Barberis and Thaler (2003), and Kahneman and Tversky (1979) identified the number of factors causing the disposition effect, and now it has become closed toward individual investor’s trading behavior (Odean, 1998). It is the risk propensity of investors or perceived risk behavior based on prospect theory that evaluated the actual probability of uncertainty avoidance and optimization of value or gain (Combrink & Lew, 2020). Both risk perception and behavior did not yield the high propensity of taking the risk. Loss aversion in prospect theory explain the tendency of investors to hold loser stocks and sell the winner stocks too early due to risk perception (Genesove & Mayer, 2001). The disposition effect is always arisen due to short term investment rather than long term investment. They get profit from winners’ stock because they do not want any risk of investment (Ritter, 2003). Investors are risk-averse rather than risk taking because of the disposition effect in the market. They immediately sell the winning stocks after they get the profits on it (Singh, 2019). Razen et al. (2020) concluded about the risk perception between professionals and non-professional investors’ decision-making. Professionals hold the losing stock more eagerly than non-professional investors. It also contributes that investment decisions mitigate the disposition effect and professionals are more reluctant to realize losses and are more biased in risky decisions.
Herding Behavior and Risk Perception
Herding behavior is occurred due to the magnitude of risk perception with stock returns (Shah et al., 2017). Most of the investors follow the crowd or aligned with overconfidence biases for investment needs (Banerjee, 1992). The reason for this herding behavior is low-risk propensity or risk avoidance of investors, and they want to minimize the risk of loss (Ullah & Elahi, 2014). During herding, rational people start to behave irrationally by set forth the others judgment while making investment decisions (Kumar & Goyal, 2015). They do not want to take the risk of investment or they do not have any idea about how to invest and follow the opinion/directions of others (Islam, 2012). Huang et al. (2016) found a strong relationship of herding behavior with respect to risk and return within institutional investors. Bekiros et al. (2017) investigate the herding behavior with respect to risk and uncertainty. The study concluded that herd prevails in the US stock market. It shows that herding behavior was insignificant during the uncertainty/risk crisis but significantly reported after the financial crisis. Moreover, herding significantly moderates with risk in microfinance institutions in Pakistan. Microfinance faces more herding behavior under uncertainty in poorer areas where people have a shortage of investment and higher perceived risk (Monne et al., 2016). Hence, herding behavior causes to affect the risk perception and decision making of investors. The study identifies and hypothesizes that herding behavior has a relation with risk perception.
Blue Chip Stocks and Risk Perception
Blue-chip stocks perform the function of risk eliminator of stocks or prestigious stock (Billett et al., 2014; Çal & Lambkin, 2017), and it also emphasizes on perceived gains and benefits (Bailey & Ball, 2006). Scholars considered blue-chip stocks as an investment in strong and well-established reputed organizations in order to avoid risk (Annaert et al., 2011; Çal & Lambkin, 2017). Investors are highly focused to invest in blue-chip stocks to avoid risk (Amihud et al., 2012; Frank et al., 2009).
Risk Perception and Investment Decision Making
Financial decisions are correlated with risk factor, especially in the purchase or sale of investment (Noussair et al., 2014). High risk is connected with high returns in investment (Yitzhaki & Lambert, 2014). The higher risk perception lower the investment in stocks by investors (Awais et al., 2016; Sahul Hamid et al., 2013). On the other hand, Mallik et al. (2017) and Ishfaq et al. (2017) concluded that risk perception is significantly and positively induce the investment decisions. Aren and Zengin (2016) found that risk perception affects the individual investor’s decision making. It is an imperative cognitive attribute in financial behavior that affects investments (Lim et al., 2018). Many times the investors are vulnerable toward behavioral biases and cognitive errors and may opt non optimal investment choice (Bhatia et al., 2020). Risk perception and loss aversion behavior are the most important components of decision making under risk (Abul, 2019; Holzmeister et al., 2020). Dominic and Gupta (2020) contribute that risk aversion behavior has a significant influence on decision making. Investors consider those stock as a risk aversion phenomenon that affects their decision-making process (Çal & Lambkin, 2017). Riaz et al. (2012) found that risk aversion behavior has a negative impact on investment decisions of the investor. Perceived risk influences the investment behavior of investors in the stock market (Sarkar & Sahu, 2018).
Disposition Effect and Investment Decision Making
The disposition effect is the investor’s investment tendency to abstain from realized loss rather than expected realized gains (Pelster & Hofmann, 2018). Investors facing the disposition effect hold the stocks when prices go down and sell immediately whenever prices go up. Summers and Duxbury (2012) explain that there are some reasons or emotions which cause the occurrence of disposition effect. The winning IPOs have a consistent disposition effect in comparison to losing IPOs (Chong, 2009). The main motive behind this disposition effect is that investors get rid to avoid regret when they look at some capital profit (Muermann & Volkman Wise, 2006). It happens because of loss aversion behavior and wants to generate capital gains quickly (Kudryavtsev et al., 2013). Loss averts investors choose to sell better return stocks with a given risk level but are reluctant in realizing the loss (Hershfield & Kramer, 2017). The disposition effect outcomes an adverse investment behavior because losing investment performs negatively whereas the winning investments outperform in the market (Aspara & Hoffmann, 2015). Disposition effect negatively affects the investments but this effect is stronger in a long position than a short position (Madaan & Singh, 2019). Ploner (2017) found strong support for the existence of disposition effect on investment.
Herding Bias and Investment Decision Making
Every single investor in the stock market without any proper direction can create the herding bias (Braha, 2012). This ultimately affects the investment decision-making process. Many times, it is observed in stock markets that investors started to sell their stocks due to uncertainty and fear of loss. They see that other investors have more information and follow the market participants in selling their stocks. This happens due to fear of loss and greed (Landberg, 2003). Individual investors follow the crowd (herd) in a way of positive feedback strategy, in order to buy and sell stocks in bullish market trend (Kim & Ryu, 2021). Herding behavior positively interacts in bearish market trend while it negatively interacts in bullish trend (Shah et al., 2019). Herding behavior significantly affects the investment decision making (Almansour & Arabyat, 2017; Boda & Sunitha, 2018; Dominic & Gupta, 2020; Raheja & Dhiman, 2019). Awareness with respect to herding, demographic factors, and perceived risk attitude affect the investment behavior (Sarkar & Sahu, 2018). Baddeley et al. (2010) concluded that financial decision building of investors is affected by herding bias. Herding has been seen as collective imitation leading to a confluence of movements (Philippas et al., 2013). It asses the asymmetric risk and return relationship in financial markets (Bekiros et al., 2017). Information unavailability in the market most probably influences the herding behavior (Ben Mabrouk, 2018). Human nature has a common tendency to imitate, refer, and observe other’s behavior during irregular conditions in the market (Yu et al., 2018). Herding behavior harms the investment performance (Filiz et al., 2018). Managers and investors prefer to follow others’ beliefs and opinions for making investment decisions. Herding is more profound during market stress such a misrepresentation, price bubbles, and rumors (Mertzanis & Allam, 2018). Zheng et al. (2017) observed herd in 10 different Asian markets and observed herd at the industry, domestic market, and international markets. Herding is the psychological factor that affects the investors’ decisions (Abul, 2019). Shah et al. (2017) stated that herding exists in the Pakistan stock market which affects the investment.
Blue Chip Stocks and Investment Decision Making
Stocks with a well-established reputation pay off their investors due to their familiarity, goodwill, high-profit ratio, and credibility (Casidy & Wymer, 2016). The stocks have an established record of earnings and lowest risk which makes them most expensive (Chen & He, 2003). These stocks can pay off lump sum to investors. Blue-chip stocks increase the investment decision making power of investors and most investors prefer to invest in large size firm’s stock with no fear of loss. Investors preferred to invest in Blue-chip stocks that have a highly upward value/pricing trend in the financial market (Ali & Rehman, 2013). Foreign investors anticipated to invest in Blue-chip stocks ((Umutlu et al., 2013). A significant positive relation consists of blue-chip stocks and investment decisions (Umutlu et al., 2013). Ali and Rehman (2013) defined that investment in highly growing stocks with low risk is preferred.
Research Methodology
Population
Targeting the population means to identify the particular group of people from whom the data has been collected (Hair et al., 2010). People put more weights to recent patterns in data but give the little importance to population properties that generates the data (Fama, 1998). The population of the study is comprised of the investors who are involved directly or indirectly in stock’s trading in Pakistan Stock Exchange. It measures the general level of investment behavior within the population to evaluate the behavioral biases in equity market. The target population was confined to investors’ investing on two floors of Pakistan stock exchange (Lahore Stock Exchange and Islamabad Stock Exchange) as data was accessible from these regions of Pakistan.
Sample Size and Sampling Procedure
A total of 500 questionnaires were distributed among investors, 450 completely filled questionnaires in all aspects were used for final analysis. According to Krejcie and Morgan (1970), a minimum sample of 384 is required for unknown population which yields consistent results at 95% confidence interval. Purposive sampling is used where respondents selection continues until the data saturation point (Sahi et al., 2013) and found the respondents according to the topic of interest (Sibona et al., 2020). The purposive sampling better matches the sample with aims and objectives of research that rigorously improve the trustworthiness of data and results (Campbell et al., 2020). Consequently, the better credibility, confirmability, dependability, and transferability of results. It is also the subjective or judgmental sampling that reflects a particular of sample and sampling techniques that based on researcher’s judgment when it comes to data collection. We believe that this particular sampling technique would diminish the non response bias and the results obtained would be highly accurate with minimum margin of error. Moreover, purposive sampling technique was chosen due to its convenience in respect of budgetary and time constraints (Yalcin et al., 2016). Theoretically, purposive sampling draws the sample from population with smaller variance than target population (Guarte & Barrios, 2006). Therefore, Purposive sampling was utilized to collect the data from the investors of Lahore and Islamabad Stock Exchanges to investigate the mediating role of risk perception between behavioral biases and investors’ investing behavior.
Data Collection Procedure and Sources
The information regarding investors was collected from stock market brokers and they provided the information about male and female investors. The data were collected from them through a self administered questionnaires. The general perception regarding Pakistani investor is that they might face difficulty in understanding the financial terminologies. In the first place, questions were designed keeping in view the respondents ability. Additionally, author explained the terminologies, queries, and questions of respondents if they faced the difficulty in understanding the financial terminologies.
Analytical Techniques and Framework
As it is a cross-sectional and survey-based study, the quantitative technique is used to investigate the causal link between the variables analyzed. According to Saunders et al. (2008), survey-based questionnaires are commonly used for data collection in the field of business. The covariance-based structural equation modeling (CB-SEM) method was employed because it is the most recommended method of estimation by many researchers when dealing with more complex theories (Martínez-López et al., 2013; Shook et al., 2004).
Ethics and Reliability
The study intends to investigate the mediating role of risk perception between behavioral biases and investor’s investment decisions. The several practices were adopted to address the ethical issues associated with this research. The respondents’ consent was taken to participate in survey questionnaire. Moreover, the collected data would not be used for illegal purpose and will not be shared with any third party without prior permission from respondents. Maintaining respondent’s anonymity was the biggest ethical challenge for the author. To address this issue, the author did not ask the questions that might reveal the respondent’s personal identity. The present research doesn’t contain any unfair means or other ill methods in data collection process. Moreover, the sources of data collection are reliable and also ensure the reliability of methodology process.
Instruments
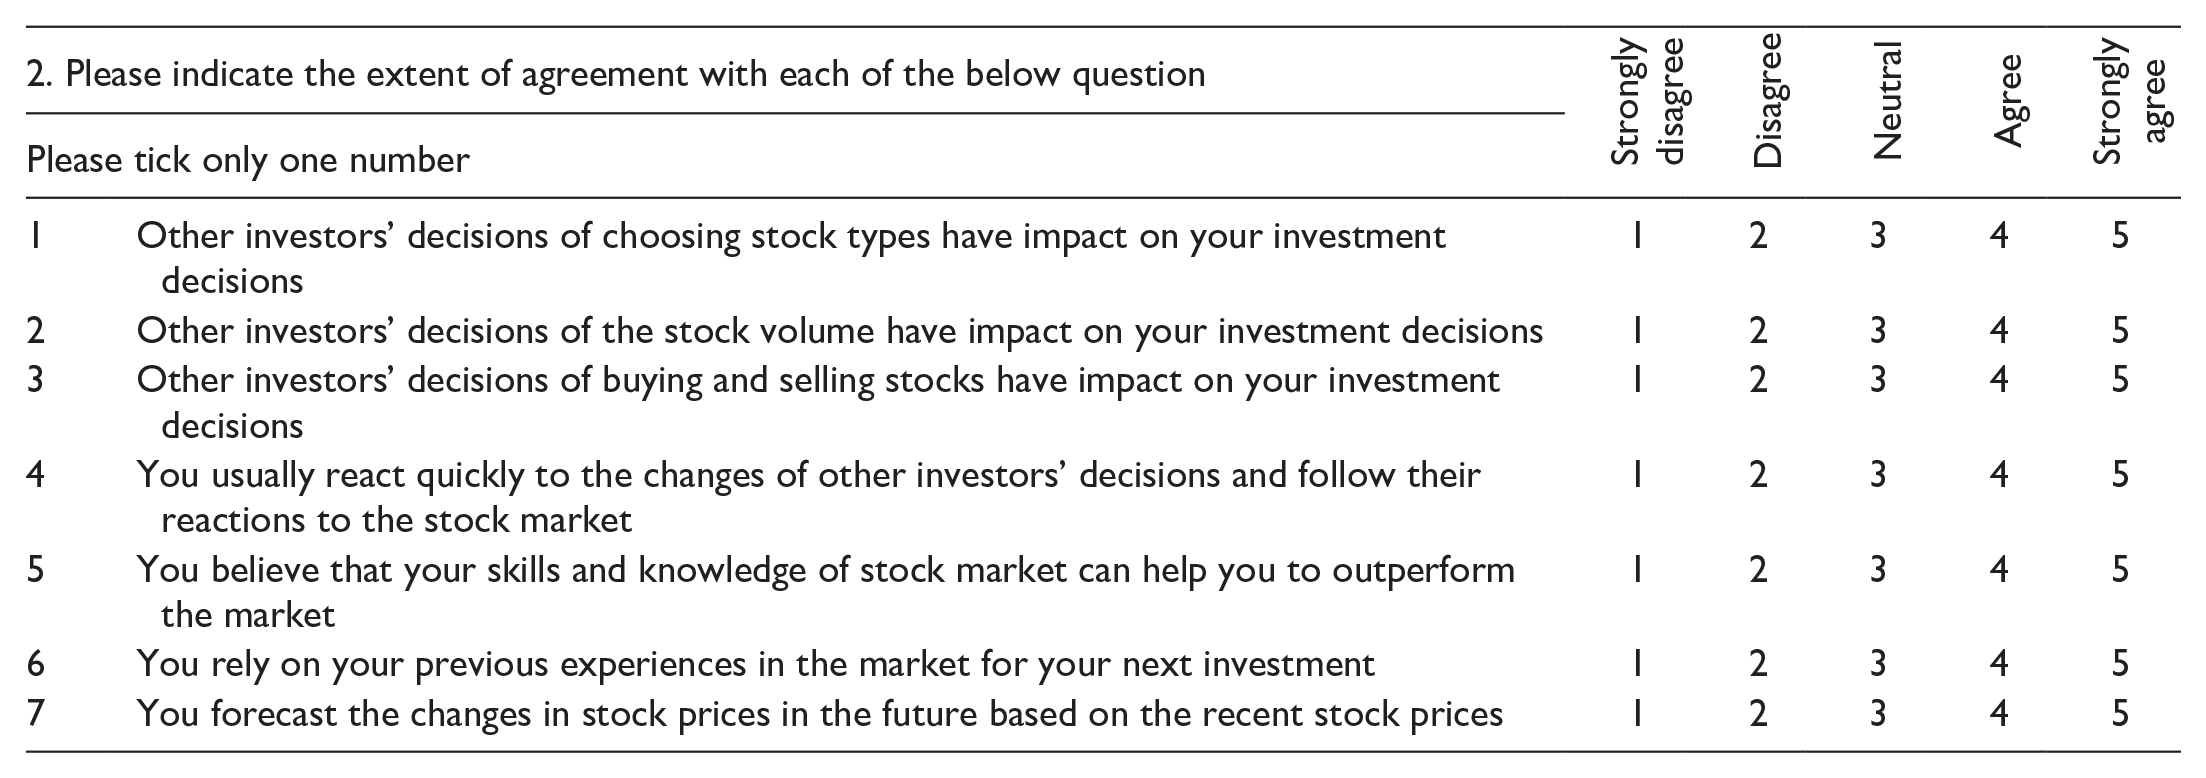
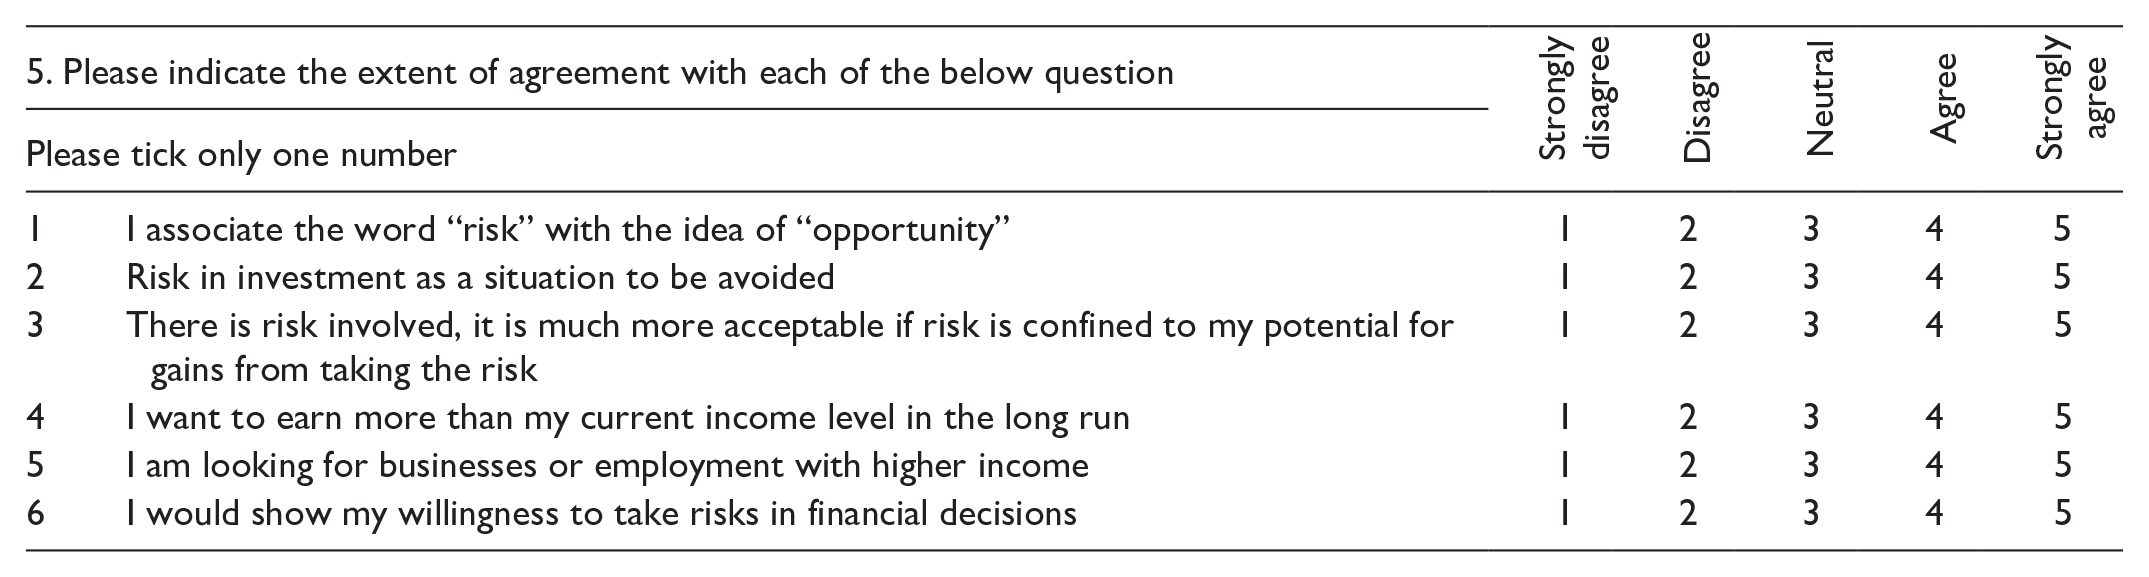
The designed questionnaire has been divided into five main sections. Two, three, and four sections are related to the main study explaining the effect of three independent variables that is, disposition effect, Herding bias, and blue-chip stock bias on dependent variable investment decision making. The scale related to blue-chip stock has five dimensions (1 = strongly disagree till 5 = strongly agree) (Pompian, 2011). The second scale of the independent variable is disposition effect which is measured by using five dimensional questionnaires (1 = strongly disagree tray (till) 5 = strongly agree) (Pompian, 2011). The third scale of independent variable is herding bias, which has five dimensions (from 1 = strongly disagree till 5 = strongly agree) (Kengatharan & Kengatharan, 2014). Three items are used to measure investment decisions (Waweru et al., 2008). Risk perception is the mediator which is measured with a five-point Likert Scale which is anchored as: (1 = strongly disagree to onward 5 = strongly agree) and adopted from (Saqib & Shama, 2016). Data were tabulated and refined into SPSS. After achieving the normality, data set was used for advanced analysis through Structural Equational modeling (SEM) by using the AMOS to testify hypotheses of the conceptual framework (Figure 1).

Conceptual framework.
Results and Findings
The study included correlation, descriptive stats, and multiple regression tests. Descriptive stats define the profile of demographics of respondents. To check that either collected sample is valid or not, reliability is checked through Cronbach’s alpha test. It answers whether the collected data is reliable or not. Correlation and multiple regression tests are used for additional investigation and discover the relation among different variables.
Demographic Factors
The demographic factors are shown in Table 1; we see the frequency and percentage of demographic variables like gender, marital status, qualification, and experience. We can see that the number of males is more than females; almost 66% are the males and rests are females which are equal to 34%. The marital status has a difference of 12% between the married and unmarried respondents. Furthermore, the respondents holding a master degree has frequency of 224 out of 450 in educational qualification variable. The experience contains 28% respondents who have an experience of 1 to 2 years with a frequency of 127 and respondents who have an experience of 7 years onward be near to 27.33%.
Demographic Factors.
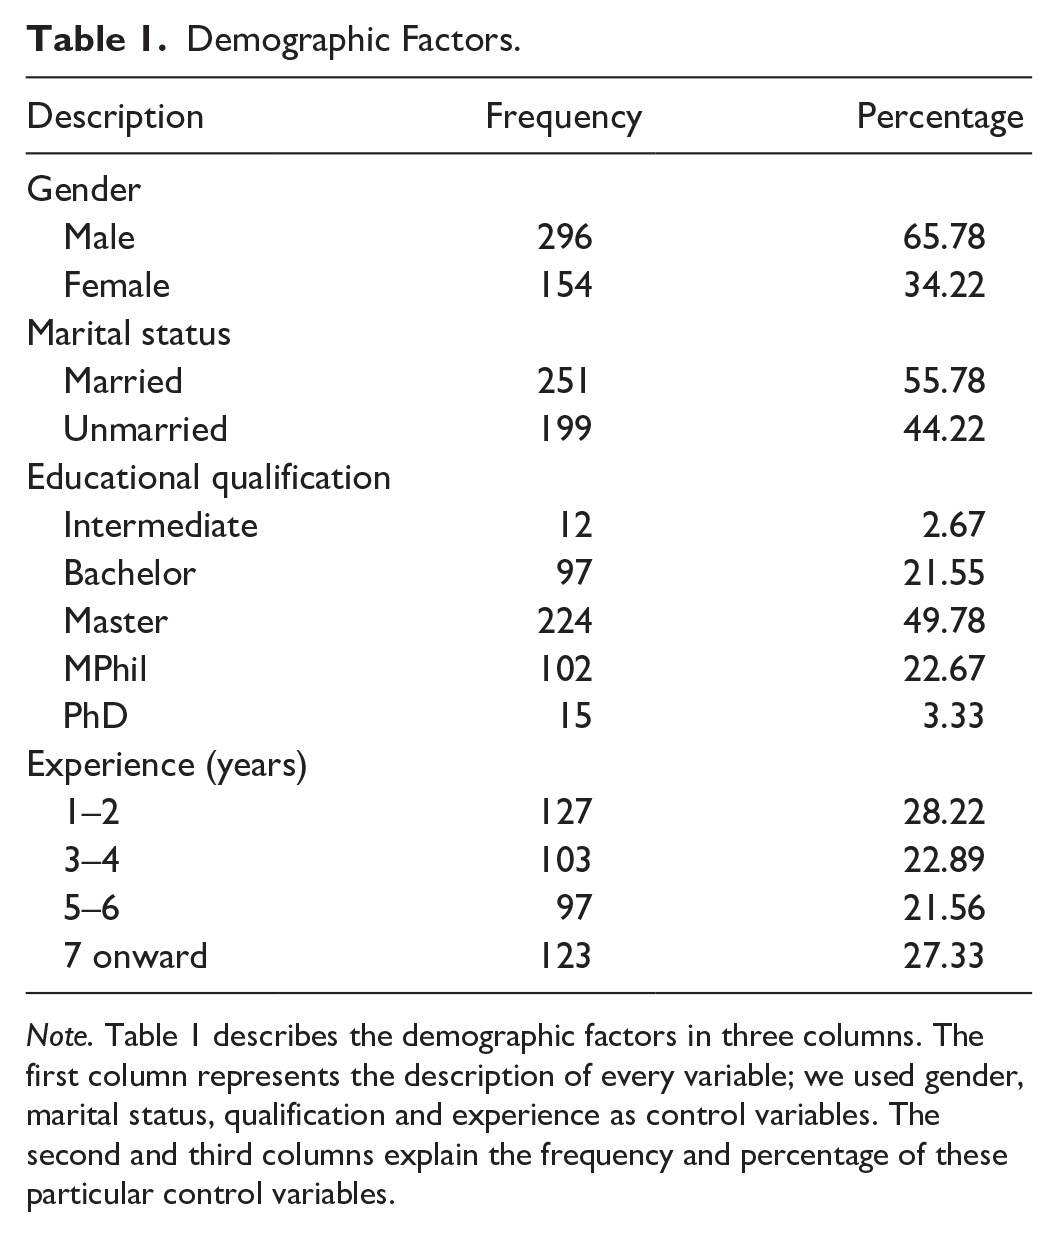
Note. Table 1 describes the demographic factors in three columns. The first column represents the description of every variable; we used gender, marital status, qualification and experience as control variables. The second and third columns explain the frequency and percentage of these particular control variables.
Summary Stats and Correlation Matrix
Pearson correlation is used to measure the direction or strength of the relationship of continuous data. An examination was led to investigate the underlying hypothetical connections among them has appeared in Table 2. It represents the summary stats and the correlation between the variables. We observed that investment decisions have a significant positive correlation with all other variables such as herding bias, disposition effect, and blue-chip stocks. On the other hand, an independent variable like herding bias has a significant positive correlation with all other variables. Disposition effect has a significant positive correlation with all other variables. Blue chip stocks only have positive significant correlation with all variables. Mediating variable risk perception has a significant positive correlation with all variables.
Descriptive Statistics and Correlation Matrix.

Note. The above table represents the descriptive statistics and correlation matrix of the variables of this study. The correlation is among investment decisions, herding bias, disposition effect, blue-chip stocks, and risk perception.
Correlation is significant at the .05 level (two-tailed).
Correlation is significant at the .01 level (two-tailed).
Correlation is significant at 1% level (2-tailed).
Five variables were used to test the hypothesis and each variable contains a different number of items. The maximum number of items is 7 and the minimum number of items is 3. We discussed the Cronbach alpha of each variable. The investment decision containing three items has a Cronbach alpha of .894 which is greater than .70. Herding behavior with seven items has the Cronbach alpha .937 while the Cronbach alpha for disposition effect is .927. Blue chip stock bias is measured through five items has .929 Cronbach alpha and risk perception containing the six items has .888 Cronbach alpha. It is observed that all the variables such as investment decisions, herding bias, disposition effect, blue-chip stock bias, and risk perception contain the Cronbach alpha value above .70. This indicates that all the variables in the study are reliable.
Factor Loadings, Composite Reliability, and Average Variance Extracted
Confirmatory Factor Analysis (CFA) has been utilized to examine the factor loadings (FL) of every observed variable on the latent variable. This allows the evaluation of constructs in terms of validity. As evident in Table 3, all the items retained have loadings above the threshold value that is, .50 (Hinkin, 1998). In addition, the Composite Reliability (CR) and Average Various Extracted (AVE) for each variable were also significantly acceptable.
Summary of Structural Model.

Note. The above table presents the factor loadings of every observed variable on the latent variable. This allows the evaluation of constructs in terms of validity. There are four columns in the above table, the first column contains the items of each variable, the second column having the values of Factor Loading (FL), the third column contains the Cronbach alpha of each item of the variable. Fourth column shows the Cronbach alpha of each variable while fifth and sixth column contains the Composite Reliability (CR) and Average Variance Extracted (AVE) values.
For discriminant validity assessment, the square root of AVE on diagonal must be greater than the correlation on off diagonal values (Barclay et al., 1995; Fornell & Larcker, 1981). The results about discriminant validity are reported in Table 4. It was observed that diagonal values of all constructs are greater than off diagonal values, indicating no discriminant validity issue or strong discriminant validity.
Discriminant Validity.
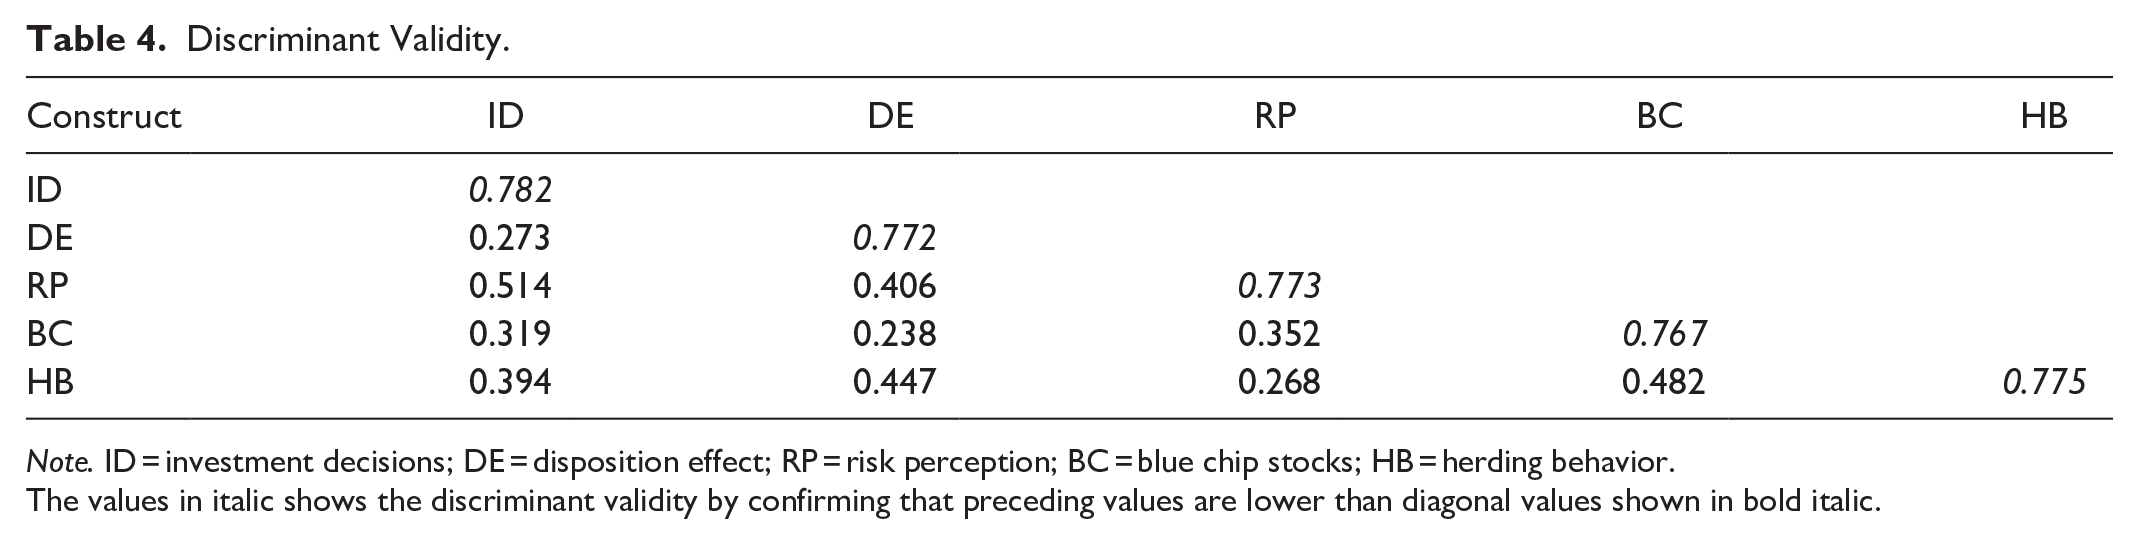
Note. ID = investment decisions; DE = disposition effect; RP = risk perception; BC = blue chip stocks; HB = herding behavior.
The values in italic shows the discriminant validity by confirming that preceding values are lower than diagonal values shown in bold italic.
Model Fit Indices
To test the structural validity of the measurement model, confirmatory factor analysis was performed. The results of model fit indices are presented in Table 5, showing the Five-factor model used in this research is best matched with the data. Accordingly, the fit indices for the five-factor model show the values of all tests are equal or greater than threshold figures including Normed Chi-Square (X2/df) = 2.45. It means that sample is overall fit after assessing the data discrepancy, therefore, the model fitness is perfect for this study. Comparative Fit Index (CFI) = 0.92, Tucker–Lewis index (TLI) = 0.98, the value of Goodness-of-Fit Index (GFI) = 0.96 shows the proportion of variance accounted for the estimated population covariance. Incremental Fit Index (IFI) = 0.96 clarified that the sample size of this study is adjusted to the degree of freedom appropriately. Root Mean Square Error of Approximation (RMSEA) = 0.05 which is the indication of the parsimony-adjusted index, the value near to 0 presents a good fit. All other models as presented in Table 5 have values in un-acceptable ranges except the five-factor model. The mentioned analysis exhibits the good reliability and validity of the variables in this research and is in the acceptable range.
Competition Model of Confirmatory Factor Analysis.

Note. Table 4 provides a single-factor CFA in which all the items comprising the five constructs are loaded on a single factor (Anderson & Gerbing, 1988). The five-factor CFA in which the items are loaded on their respective factors yields a good fit. The threshold of these values is indicated by Fetscherin (2019).
Direct Effect
The direct relation between the variables and hypothesis significance level through critical ratio and P-value is shown in Table 6. Keeping in view the hypothetical justification, the .05 significance level must have a critical value greater than 1.96.
Hypotheses Confirmation: Direct Effect.

Note. The above table defines the direct effect of our variables as well as represents the acceptances and rejection of the hypothesis. We perform the regression test to discover the association involving our study’s variables, and regression results. The table contains five columns, the first column is representing the hypothesis, the second column displays the path of the particular variable, the next column describes the regression coefficient and the last two columns explain the critical value (CR) and the acceptance and rejection of the hypothesis.
shows the 1% level of significance.
represent the 5% significance level.
shows the 10% significance level.
According to the results, the disposition effect has a direct relationship with risk perception (β = .212, p < .001), which accepts the hypothesis H1. Herding bias has a direct association with risk perception (β = .383, p < .001) leading to accept the hypothesis H2. Hypothesis H3 shows the inverse relationship between blue-chip stock bias and risk perception which is also accepted due to acceptable range (β = .218, p < .001). Hypothesis H4 indicating the link between risk perception, and the investment decision is not accepted (β = −.44, p < .001). Herding bias does not play a significant role for investment decision making. The link between disposition effect and investment decision exists directly (β = .748, p < .001) which accepts our hypothesis H6. In the end, the direct relationship between blue-chip stocks and investment decisions is significantly related (β = .186, p < .001) which accepts our hypothesis H7. Therefore, the direct relationship between the independent variables like (disposition effect, blue-chip stock bias) and dependent variable investment decision have been acknowledged (Accepted), expect the direct link between herding bias and investment decision (rejected). All the developed hypotheses were accepted except H4 and H5.
Indirect Effect of Mediator Between Behavioral Biases and Investment Decision
Mediation runs when a causal relationship occurs among independent and dependent variables and that relationship is explained by other variables (Shrout & Bolger, 2002). A mediator is a variable, which is in a causal sequence between two variables. It explains the relationship between variables by enhancing the understanding of the relation which is analyzed through bootstrap method. We investigated the mediating relationship among the variables through bootstrap method. The indirect relationship of behavioral biases (Blue-chip stock Bias, Disposition Effect, Herding Bias) with investment decisions under the mediating role of risk perception is shown in Table 7.
Hypotheses Confirmation: Indirect Effect.
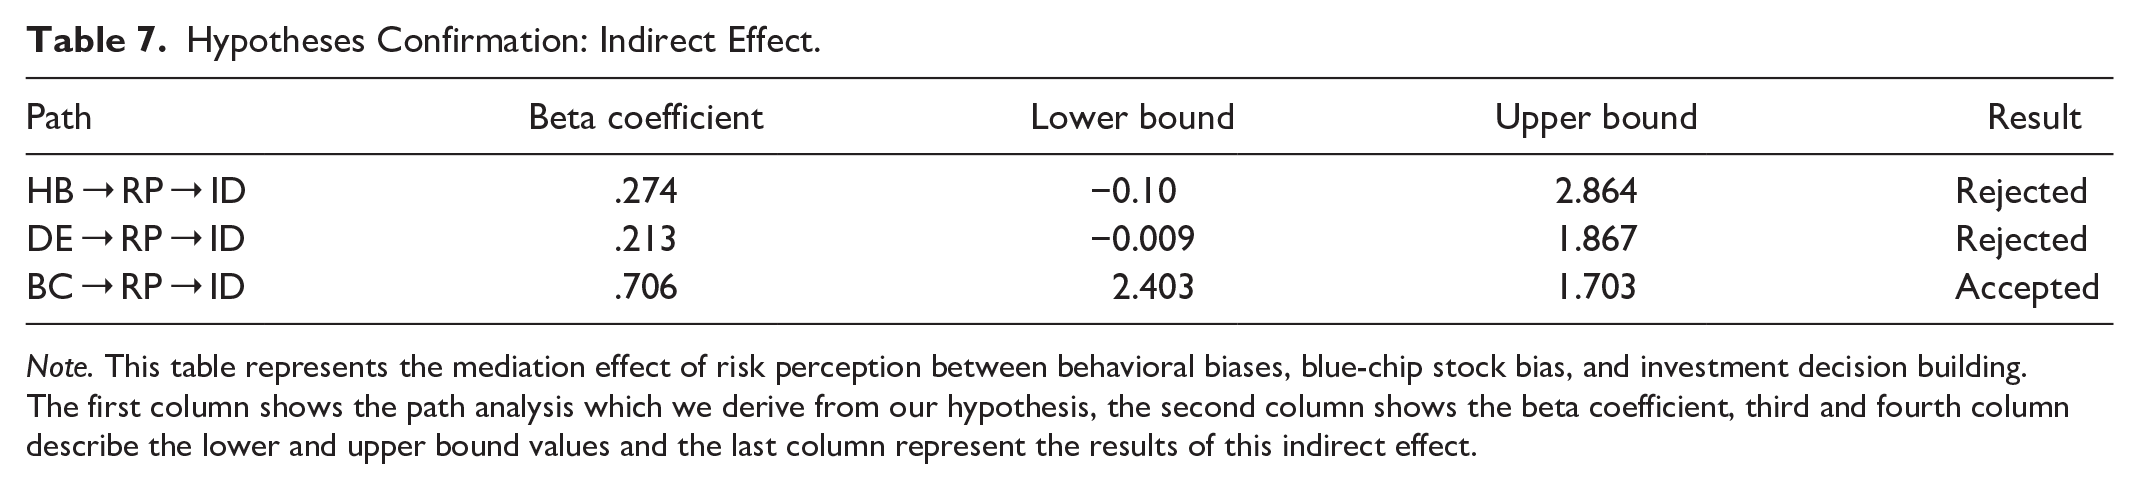
Note. This table represents the mediation effect of risk perception between behavioral biases, blue-chip stock bias, and investment decision building. The first column shows the path analysis which we derive from our hypothesis, the second column shows the beta coefficient, third and fourth column describe the lower and upper bound values and the last column represent the results of this indirect effect.
As evident in Table 7, the mediation among herding Bias, disposition effect, and investment decision was not supported as lower, and upper bound values contain 0. Due to this, zero does not support the upper and lower bounds (Cheung & Lau, 2008). Mediation was confirmed between the blue-chip stock bias and the investment decision. Risk perception may be positive or negative. A positive risk perception indicates that investors are optimists in their investments. Overconfidence investors have positive risk perception and they are most likely have a risky attitude that induces them to go for investments (Parveen et al., 2020). Besides, the negative risk perception would discourage the investments and create a biased attitude in the market.
Structural Model
The structural model is the second and key stage of analysis. It is the portion of model which specifies the way that how latent variables are related with each other (Field, 2013). The purposes of structural model to identify which latent constructs directly or indirectly affect the values of other latent constructs in the model (Kline, 2015). The overall model is depicted below in Figure 2.

Structured model.
Discussion
The study aimed to uncover the collision of behavioral biases (Blue chip stock bias, disposition effect, and herding bias) with investment decisions under the mediating role of risk perception. The outcome of the SEM points out that certain behavioral biases are strong predictors of investment decisions. Among the behavioral biases and stock selection, herding bias, disposition effect, and blue-chip stock bias are the strongest predictor of risk perception. This result validates the H1 that individual investors’ behavior is a significant factor affecting their risk perception in the stock market. Shefrin (2008) identify the influence of disposition effect and now it becomes narrow or closed toward individual investor’s trading behavior (Odean, 1998) to sell winnings stocks (Genesove & Mayer, 2001) too early due to their perception of risk. The disposition effect is always arisen due to short term investment rather than long term investment. They get profit from winners’ stock because they do not want any risk of investment (Ritter, 2003). Investors are risk-averse rather than risk taking because of the disposition effect in the market. They immediately sell the winning stocks after they get the profits on it (Singh, 2019).
Herding behavior is also a significant factor that significantly explains the risk perception of investors in the market. Herding behavior is occurred due to the magnitude of risk perception in relation to stock returns (Shah et al., 2017). The reason for this herding behavior is risk propensity or risk avoidance of investors to minimize the risk of loss (Ullah & Elahi, 2014). During herding, rational people start to behave irrationally by imitating the judgment of others while making decisions (Kumar & Goyal, 2015). It all happens in uncertainty because people have a shortage of investment and higher perceived risk (Monne et al., 2016). The results validate the hypothesis H2.
Our findings also show that blue-chip stock bias has a strong negative effect on risk perception. This validates our hypothesis H3 that blue-chip stocks perform the function of risk eliminator of stocks which also reiterates the perceived gain more willingly than the risk factors (Bailey & Ball, 2006). Erdem et al. (2004) contributed that stock of strong reputed organizations play a part to a reduction in risk by minimizing the perception of risk. Blue-chip stocks perform the function of risk eliminator of stocks or prestigious stock (Billett et al., 2014; Çal & Lambkin, 2017). Investors assign value to stock in terms of gain and loss under prospect theory—thus findings deviate from expected utility theory. The study reflects that investor more often follows the herding behavior in making the investment decisions in a developing country like Pakistan. However, in turn, they generate risk in the stock market.
Our results show that behavioral biases like disposition effect and blue-chip stocks (Stocks selection) have a strong positive relationship with investment decisions that lead to accept the H6, and H7. This may be caused for two reasons. First, most of the investors in Pakistan are less sensitive to loss that impacts their investments. A high percentage of samples were comprised of men, who have less risk-averse attitude than women. Secondly, Pakistan is designated by a collectivist culture rooted in strong community and family networks, investors perhaps less risk-averse. It has been argued that collectivist societies cause individuals to be trapped more by behavioral biases (Akbar et al., 2016; Kim & Nofsinger, 2008) risk-averse than women. High risk is connected with high returns in investment (Yitzhaki & Lambert, 2014). Blue-chip stocks increase the investment decision making power of investors and most investors prefer to invest in large size firm’s stock with no fear of loss. Investors preferred this option for deciding to invest in these stocks/Blue-chip stocks that have a highly upward value/pricing trend in the financial market (Ali & Rehman, 2013).
The results of mediation are only significant between blue-chip stocks and investment decisions. Stocks with a well-established reputation pay off their investors due to their familiarity, goodwill, high-profit ratio, and credibility (Casidy & Wymer, 2016). At some failure stage, these stocks can pay off lump sum to investors. It emphasizes the decision-making power of the investor. Investors prefer this option for the decision to invest in these stocks/Blue chip stocks that have a highly upward value/pricing trend in the financial market (Ali & Rehman, 2013). This particular behavior is due to a short term investment horizon because the investors show the disposition behavior when they do long term investment. Moreover, a high qualification level might show no disposition effect in the stock market (Dhar & Zhu, 2002). Overall, the findings are in support of prospect theory which explains the risk avoidance tendency of investors relating to hold loser stock and sell winning one (Shefrin, 2002). It is the risk propensity of investors or perceived risk behavior based on prospect theory that evaluated the actual probability of uncertainty avoidance and optimization of value or gain (Combrink & Lew, 2020).
Conclusion
The study aims to find the mediating role of risk perception between behavioral biases and investment decisions. Three behavioral biases like disposition effect, herding bias, and blue-chip stocks are used as independent observations to identify their effect on investment decisions through risk perception. For this purpose, the primary data is collected from investors investing on two floors of Pakistan stock exchange (Lahore Stock Exchange and Islamabad Stock Exchange) as data was accessible from these regions of Pakistan. The response is taken from 450 investors and concluded that investors follow the behavioral pattern before investing rather than a rational pattern in Pakistan. These behavioral biases (Disposition effect and blue-chip stocks) positively and directly impact the investors’ investment decisions. Disposition effect has an impact on the investment decision because the investors in Pakistan are risk-averse rather than risk-takers. They always prefer to do a short term investment rather than long term investment. However, herding behavior in Pakistan’s financial market does not show any significant relationship with the investment decisions of investors. Most of the investors do not perceive the risks and this is caused by behavioral biases during investments by the investors. Investment in blue-chip stocks reduces the risk perception of investors. They prefer to invest in companies that have strong goodwill and better prices in the market. Investing in Blue-chip stock gives the investors fewer chances of loss because these stocks normally earn a profit on their stocks and that’s why the investors in Pakistan prefer to invest in these stocks. Risk perception only mediates between blue-chip stock and investment decisions in Pakistan because of the investor’s preference in blue-chip stocks. Risk perception does not play the mediator role between disposition effect, herding behavior, and investment decisions due to the different mindset of investors. The investor already follows the behavioral pattern and this causes the direct impact on investment decision. The provided information helps the investors to make efficient investment decisions. This helps them to behave optimally in a given situation and they can get gain better returns on investment. Investment professions must consider the behavioral factors and risk perceptions while going for any kind of decisions. They must go for technical analysis of stock market and then go for investment decisions. In this way, they can avoid the huge financial loss in future. The study would help the investors in designing the current and future portfolio of securities accordingly. A key limitation of the study is that we consider only pre-identified antecedents of prospect constructs. The study is completed in the survey questionnaire which is criticized due to the number of factors especially generalization problems. It is not easy to get all the required information from the respondents in Karachi and other major cities due to time and cost limitations. In this research, risk perception was taken as a mediating role but various other variables can also be used as mediators and moderators between dependent and independent variables. Human capital, anomalies, computer literacy, artificial technology could also be used as a mediator and moderator for future orientation.
Questionnaire
Aslam-o-Alaikum/Greetings
We are conducting a research on attitudes and perceptions. The information obtained through this questionnaire will be confidential and only be used for research purpose. Therefore, it is requested you to please cooperate. Thank you

The following statements relate to your opinion about

The following statements relate to your opinion about
The following statements relate to your opinion about

The following statements relate to your opinion about

The following statements relate to your opinion about
Footnotes
Declaration of Conflicting Interests
The author(s) declared no potential conflicts of interest with respect to the research, authorship, and/or publication of this article.
Funding
The author(s) received no financial support for the research, authorship, and/or publication of this article.