
Abstract
This study presents a multivariate study regarding Bitcoin and its interactions with other financial assets of different classes. This is done by adjusting a multivariate semi heavy-tailed distribution to portfolios containing indexes, currencies, and commodities and one cryptocurrency. Later, a rolling window is deployed to obtain the dynamic parameters of the distribution in a weekly basis. With a Markowitz specification problem, the optimal portfolio weights are computed dynamically using the parameters of the multivariate NIG distribution as inputs. The results provide evidence that correlations of Bitcoin with other assets may provide certain degree of diversification to portfolios; nevertheless, the high volatility of this asset makes it unpractical to employ in significant weights. This paper is relevant for researchers and practitioners as it provides a new tool to manage portfolios with cryptocurrencies and more reliable weights to the asset allocation.
Introduction
One of the main features that humans possess is the continuous development of new tools and mechanisms to improve their life. In the 21st century the computational technology has stablished a new era of virtual objects and interactions among people. One of these was published after the 2008 financial crisis. In this period, Nakamoto (2008) presents the Bitcoin as a peer-to-peer payment system away from the traditional fiat money. This statement and innovation were mostly ignored by most of the population and used as an internet currency in specialized circles, mainly in black markets. Nevertheless, this planted the seed for others to develop similar decentralized currencies and eventually they became assets traded around the world. This explosion of the so-called cryptocurrencies leaded to important studies of their properties as new entities in financial markets.
In this context two main questions may arise: (1) What is the closest classification of Bitcoin in traditional assets? (2) What is its relationship with those as a possible hedge or diversifier? As Haubo (2015) states, the correct classification may lead to an improvement in risk management and portfolio selection. However, there are many methodologies that have approached the problems from several perspectives: each with its own limitations. From a theoretical point of view Buchholz et al. (2012) classify Bitcoin as something between fiat money and a commodity as it shares some, but not all, their properties. Even when the Bitcoin mining replicates the cost of metal extraction, the process creates a code and not a tangible material that require of storage in the physical world. Furthermore, the lack of recognition from central authorities creates barriers in order to cryptocurrencies to be employed in real economy.
Moreover, some considerations must be acknowledged, specially the volatility of the cryptocurrencies which may lead to the lack of store value, characteristic related to fiat money. As Ciaian et al. (2016) state, the supply side of these assets is completely deterministic, meaning that the demand side is responsible to move the market value. In such case, Bueno et al. (2017) mention that such conditions lead to volatilities never witness in global markets. These characteristics may lead to assets that, although show high return levels and in some instances the possibility to use them as diversifiers due to their low correlation levels with other assets, may be unpractical to use them in portfolios. The reason comes from the optimization problem which considers the perspective of a risk averse agent who seeks to reduce the volatility of the investments. In such case, the risk reward ratio of the assets may lead to low weights for seemingly attractive investments. In a risk manager position, the correct estimation not only of correlations but also of stylized facts as heavy tails and negative skewness play a central role in portfolio selection.
For such optimal selection, Markowitz (1952) presents in his seminal paper a theoretical and empirical framework to calculate the weights that solve the variance minimization of the portfolio. In such, the standard estimators of mean and variance from a normal distribution are taken as appropriate values to measure return and risk of the weighted sum that defines the portfolio. Nevertheless, multiple studies regarding the so-called stylized facts have proven that because of the high dispersion and volatility clusters, the cryptocurrencies do not have a univariate normal distribution (Bariviera et al., 2017). Alongside, Alvarez-Ramirez et al. (2018) showed that there is an important presence of heavy tail behavior in the left side of the distribution as well as asymmetry in returns for different periods. In such case, the direct application of standard portfolio selection procedure may lead to underestimate the risk for cryptocurrencies and its relationship with other major assets.
On the other side, Cont (2002) mentions that it is necessary to use a theoretical distribution with at least four parameters that provide enough flexibility to capture the stylized facts of traditional financial assets. If we consider that cryptocurrencies have proven to have exacerbated properties, then traditional approaches that rely on normality of the data may lead to sub estimation of risk and extreme events. On this regard, different families of theoretical distributions have been used to model the different cryptocurrencies’ returns. Chu et al. (2018) as well as Luo et al. (2019) present the Generalized Hyperbolic family as a flexible enough distribution to capture the different statistical properties of cryptocurrencies. This set of distributions was originally developed by Barndorff-Nielsen (1997). This family has been used in multiple disciplines; however, for the financial market, Eberlein and Keller (1995) present one of the first applications to model index returns. In subsequent studies, the capability of GH family to fit financial returns have been exploited for different asset classes with outstanding results in comparison to standard normality assumptions (Mota & Mata, 2016; Núñez et al., 2018; Shen et al., 2017).
Based on expectiles applied to Bitcoin and a group of assets (commodities, equities, currencies, and bonds). Zhang et al. (2021) found evidence of downside risk spillover (time dependent) from bitcoin to the other assets. With these results, a natural extension of univariate distributions is to consider the multivariate case. In such scheme the Bitcoin may be modeled alongside other financial assets of different classes. This study has the potential to identify the interaction of the main driver for cryptocurrencies (Ji et al., 2019) and other financial entities in a portfolio framework. The relevance of this work regards on both the investors and risk managers as it can provide a different perspective on the role of Bitcoin as a hedge or diversifier asset integrated in portfolios. Furthermore, the adjustment of a close distribution has the potential to show how does the covariance among assets have fluctuated over time and how the cryptocurrencies may be related to conventional definitions such as indexes (Dow Jones and SZSE), currencies (EUR/USD and JPY/USD), or commodities (Gold and WTI).
In order to do so, a rolling-window estimation of multivariate Normal Inverse Gaussian (NIG) distribution is calculated. With those, the dispersion matrix and expected value vector are used as the input for the portfolio optimization. Which, according to Markowitz (1952), may lead to an improvement of parameter and weight estimation. The contribution of this paper relies in the application of a classical theory in finance, with the relaxation of one of the main assumptions in financial literature: the data follows a normal distribution. This approach has the benefits of improving the results attained through it and to work with a parametrized distribution rather than copulas or even Dynamic Conditional Correlation models that are difficult to converge and have the exponential growth in estimators for large multivariate vectors (Engle, 2002). Furthermore, the portfolio optimization that considers Bitcoin only include two assets; while the present work presents sets of three and has the potential to extend to larger dimensions. To achieve this goal the paper is presented in the following structure: “Section 2” Literature Review, “Section 3” Data and methodology, “Section 4” Results, and “Section 5” Conclusions.
Literature Review
Bitcoin and the rest of cryptocurrencies represent a new deal and interaction in conventional financial markets. From an economic point of view, they could be interpreted as virtual money as it is intended to operate as a mean of payment (Grinberg, 2011). Nevertheless, Kubat (2014) presents a legal and economic analysis on whether the Bitcoin could and should be understood as fiat money. His argument states that because there is not a liability registered in Central Banks, then it does not fully satisfy this condition. Moreover, money is also understood as a universal mean of payment, once again, there is only a few products that can be purchased directly with cryptocurrencies. The final property of money is specially addressed by Yermack (2013), who, starting from this definition, provide evidence that high volatility and wide range of exchange rate between Bitcoin and US Dollar, then it does not fulfill the store of value feature. In his conclusion, Yermack catalogs Bitcoin as a speculative asset.
Caginalp et al. (2001) expose the argument, under the dot-com bubble period, in which the lack of a proper understanding of the assets traded by investors may lead to bubble episodes. On this regard, Fry and Cheah (2016) estimate the fundamental value of Bitcoin in zero; meaning that it could be interpreted as a purely speculative asset with a high probability of bubble episodes. To test this hypothesis, Zheng-Zheng et al. (2018) use the statistical technique developed by Phillips et al. (2015) to detect six bubbles in the Yuan and five in the US Dollar exchange rate with respect to Bitcoin with a weekly periodicity from June 16th, 2011 to September 18th, 2017.
To address the volatility issue, the univariate analysis literature has surround the GARCH type modeling. Works like Katsiampa (2017) prove a variety of these models and conclude that for the Bitcoin US Dollar exchange rate, the best model is the AR-CGARCH model. This result implies the dynamic behavior of volatility as well as the relevance to incorporate a short and long-term conditional variance. In this line, Cermak (2017) exposes through a GARCH(1,1) the interaction of Bitcoin with the real economy, finding that it corresponds to a safe-heaven asset in China. His results also show that volatility has decrease in the studied period, corresponding from 2011 to 2017. Estimating a forecast of this model, he concludes that high volatility will continue until 2019 when it might find levels like other currencies. This last result also coincides with Bouoiyour and Refk (2016), who state based on the same model that Bitcoin market is still immature but might eventually reduce its volatility. On the other hand, by applying the conditional correlation model Bouri et al. (2017) analyzed the properties of safe haven, hedger, and diversifier of Bitcoin using the Ratner and Chiu (2013) methodology. Bitcoin is useful as a diversifier, but the properties of hedging and safe haven depend on the daily or monthly frequency and the economic region.
These studies provided evidence that Bitcoin returns exhibit significant changes in correlation levels with other assets, in addition to the volatility clusters, the multivariate GARCH models became a feasible proposal to model such behaviors. Corelli (2018) proposes a multivariate study with the six major cryptocurrencies (Bitcoin, Ethereum, Ripple, Litecoin, Monero, and Dash) involving Granger causality test as well as a VECM model with exchange rates of Europe, Asia, Africa, and Oceania, all with respect to US Dollar. His results provide evidence of a strong correlation of Bitcoin and Ethereum with Asian currencies, especially Thai Baht, Taiwan Dollar, and Chinese Yuan. Baur et al. (2018) provide an extensive univariate and multivariate GARCH analysis of the correlation between Bitcoin, US Dollar, and Gold; finding that the relation of the cryptocurrency is almost zero with the other assets. Moreover, the univariate models show that the volatility processes are distinct among the traditional assets and the Bitcoin, being this the riskiest.
Extensions of such studies such as the one made by Al Mamun et al. (2019) propose a new indicator to explain the volatility of Bitcoin as well as the correlation with traditional assets. Their hypothesis present that geopolitical events may be drivers for risk premia volatility in Bitcoin. By implementing a DCC-GARCH model that allows for asymmetric response in volatility, they manage to determine that from a portfolio perspective, gold is the only asset to hedge Bitcoin; furthermore, geopolitical events do have direct impacts to abrupt price changes of cryptocurrency. Other methodologies such as the proposed by Bouri, Hussain, et al. (2020) which centers on tail behavior via a cross-quantilogram show that relation between cryptocurrencies and US market equities is heterogeneous and all of them share the same degree of safe-heaven property. Based on the quantile approach and using the lowest tail of distribution, Shahzad et al. (2019) studied a comparison of the safe haven property of the Bitcoin, gold, and commodity index for different country and global stock markets indices. The results indicated similar results for the weak safe haven property but depends on the market analyzed. On another perspective Corbet et al. (2018) employ the generalize variance decomposition to determine the sign and severity of spillover shocks from markets such as MSC GSCI, the US Broad Exchange Rate, SP500, gold, VIX, and Markit ITTR110 index. Their results indicate that cryptocurrencies are isolated from conventional markets and could be used as diversifier in portfolios. From a behavioral approach, Ababio et al. (2020) incorporate in the discussion the possibility to use Cumulative Prospective Theory (CPT) which incorporates into de original Markowitz optimization problem, some biases in the decision making of the agents like accepting extra risk to obtain a higher profit in their investments.
Hussain et al. (2019) abord this topic through an AGDCC-GARCH to model conditional correlation between gold and Bitcoin with the indexes of the G7 countries. Their findings bear out that the precious metal is a safe-heaven for the indexes; however, Bitcoin has a hedge strategy only with the Canadian one. The conclusion is that both assets may be used as diversifiers, but gold stands as the most consistent. Gil-Alana et al. (2020) use a fractional integration and cointegration approach with six of the major cryptocurrencies and stock market indexes (Bond, Dollar, Gold, GSCI, S&P, and VIX). With a bivariate analysis they conclude once more the disconnection of cryptocurrencies with stock markets, hence working as diversifier. Furthermore, they find no evidence of cointegration among cryptocurrencies and the indexes, finally they remark the use of these assets into portfolios of conventional instruments. Charfeddine et al. (2020) present a copula and multivariate GARCH approach to deal with portfolio strategies. By deploying bivariate models, they find that there is a weak relation between Bitcoin and Ethereum, and S&P 500, Gold, and Crude Oil. Also, their results show that the largest weights for cryptocurrencies are in the range of 11.62% to 24.25% and those correspond to oil portfolios. Other developments in this area include the work of Mba et al. (2018) in which a GARCH Differential Evolution t-copula is able to create dynamic weights in portfolios that can capture fat tails in the multivariate distribution for five cryptocurrencies. Similar approach was proposed by Bouri, Lucey, et al. (2020) analyzed properties of time variable diversification/hedging of five cryptocurrencies (Bitcoin, Ethereum, Ripple, Liteoin, and Stellar) respect four MSCI equity indices ( proxies of USA, Japan, Europe, and Asia-Pacific region). The results indicated that Bitcoin and Ethereum should be elected for Japan and Asia-Pacific region. Moreover, it is demonstrated that the inclusion of cryptocurrencies serves for the diversification of equity portfolios. Given the nature of cryptocurrencies market, Kristjanpoller et al. (2020) studied the multifractal relationship of a group of cryptocurrencies (Bitcoin, Monero, Litecoin, Ripple, and Dash) with respect six ETFs (aggregated and disaggregated), with cross correlation more persistent for small fluctuations. Additionally, these cross correlations are asymmetric in most of the cases.
One key assumption in conventional models corresponds with the normality of returns, either the univariate or multivariate case. Nevertheless, the stylized facts described by Bariviera et al. (2017) and Alvarez-Ramirez et al. (2018) present an entity that totally diverges from the usual assumption due to the presence of heavy tails, high kurtosis, and skewness. Regarding these characteristics, Barndorff-Nielsen (1997) presents the Generalized Hyperbolic distribution family, which is defined by five parameters. This flexibility was originally used by Eberlein and Keller (1995) to model DAX index with a GH distribution. Nevertheless, that same year Barndorff-Nielsen (1995) determined that a member of the family denoted as Normal Inverse Gaussian distribution manage to adjust the heavy tail behavior in a better way than any other member of this distribution. Alongside, this distribution is shown to have properties like Gaussian, such as mathematical tractability, close under convolution, and affine transformation and a parametric definition that represent lesser computational cost to estimate. Some developments in the inclusion of such Levy processes are made by Mba and Mwambi (2020) with a Markov Switching Continuous GARCH model that incorporates the properties previously discussed into a portfolio with cryptocurrencies. In such it is worthy of mention the implication of such mechanism to adapt changes in the market behavior.
With these characteristics in consideration, Chu et al. (2018) tried with members of the exponential and generalize hyperbolic families to fit Bitcoin returns. With a Value at Risk perspective, they conclude that Generalize Hyperbolic distribution is the best option due to having the greater extreme values. A similar result is presented by Luo et al. (2019) who manage to fit a Generalize Hyperbolic distribution for the four largest cryptocurrencies. In this case they use a statistical goodness of fit criterion to determine that GH distribution is the one which best model the returns. However, Núñez et al. (2019) provide evidence that NIG distribution, under statistical criterion, fits the returns of seven exchange rates of Bitcoin even in bubble periods. Alongside, a Value at Risk and Expected Shortfall estimation, prove that the advantages of using a GH distribution over a NIG do not overrun the laudable properties of the later.
Data and Methodology
The data to analyze corresponds to weekly periodicity of seven assets: Bitcoin, EUR/USD, and JPY/USD as the currencies, Dow Jones and SZSE for indexes, and Gold and WTI for commodities obtained from Investing.com. The reason to use weekly rather than daily periodicity relies on the difference in operative days. Cryptocurrencies operate on 7-days weeks, while stock indexes do in 5-days weeks, so in order to have a homogeneous time interval, the least common periodicity was used. The series consider the periods from 2013, December 1st to 2019, June 9th with a total of 290 observations. The data is displayed in Figure 1.
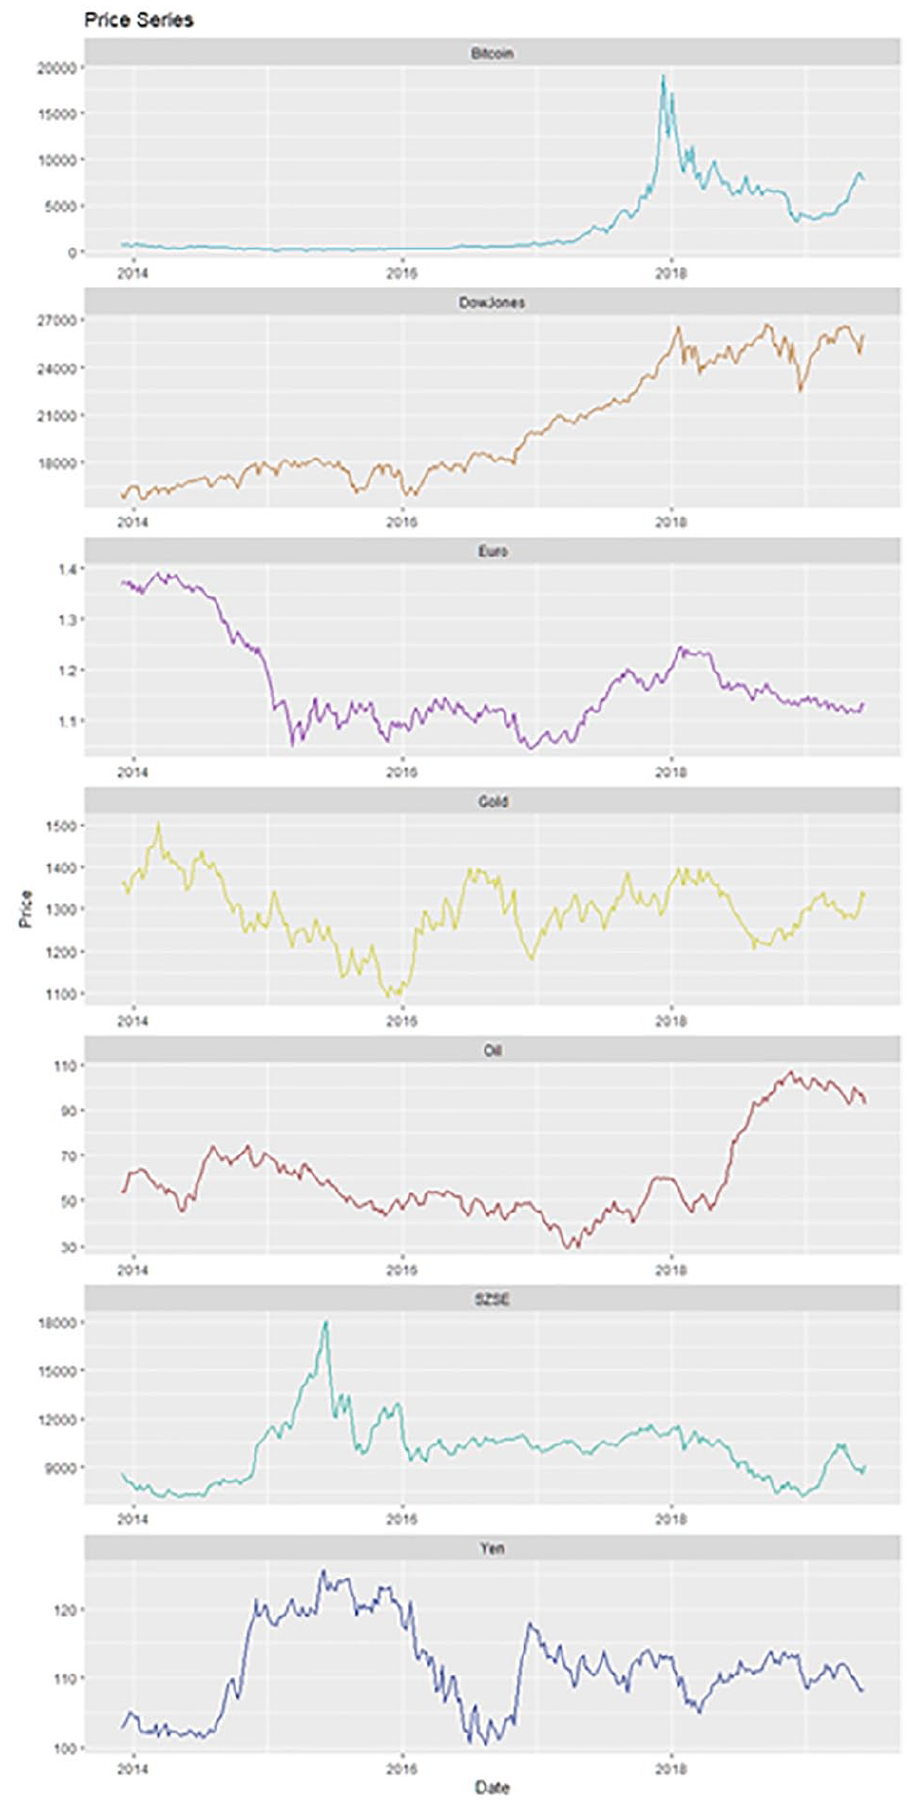
Assets’ price series from 2013, December 1st to 2019, June 9th.
For a proper statistical analysis, the unit root tests are applied to level data. The proofs correspond with the Augmented Dickey Fuller (ADF) and Phillips-Perron (PP) under the null hypothesis that series have unit root, while the KPSS test under the null hypothesis that the data is stationary. The contrast of the test is intended to provide robustness to this step. The p-values for the seven assets are presented in Table 1.
p-Values of Stationary Test for Prices and Returns.

Note. Stationary test’s p-values for level and logarithmic differences series. For ADF and PP the null hypothesis is constructed as the presence of unit root, while KPSS is the complement, that is, the series exhibit stationary behavior. Elaborated by authors with information from Investing.com.
It can be seen that the level series are consistent to not reject the null hypothesis of unit root in both tests; however for the complementary one, it is not possible to reject under a 95% confidence the hypothesis of stationarity for Yen and Gold, but can be at 90% level. As Campbell et al. (1997) stablish, for a statistical analysis that contains the ergodic principle, the prices need to be differentiated. In this case, the type of difference that suits the study is the logarithmic one. In the case of a time series of prices, the result of this operation corresponds with the continuous returns. The transformation only losses one observation and can be defined as follows:

Once the new series are obtained, the same tests are applied to return series. The new data is displayed in Figure 2; while the stationarity tests results are shown in Table 1.

Assets’ return series from 2013, December 1st to 2019, June 9th.
In this case, all the series reject the hypothesis of unit root and does not reject the hypothesis of stationarity, so these are the series that will be used, corresponding with a total of 289 observations. With this return series it is possible to obtain the descriptive statistics, which are presented in Table 2. Furthermore, the p-values of ARCH test are also included. As the GARCH (1,1) models may be interpreted as infinite order ARCH, the lag selection for the test was defined as 100 for all series.
Descriptive Statistics for Return Series.

Note. Descriptive statistics for logarithmic differences of series. ARCH effect test constructed under the null hypothesis that series present no ARCH effect at some lag value. For this p-values the lag was stablished to be 100. Elaborated by authors with information from Investing.com.
The histograms of the series are displayed in Figure 3. In it, as well as with the descriptive statistics, it is notorious that the cryptocurrency has a wider range, meaning the presence of higher frequency, and severity of extreme values in returns. To show this characteristic in other perspective the boxplots and violin plots are presented in Figures 4 and 5. In them, the most notorious feature is the quantity of relative extreme values for Bitcoin compared to other assets, as well as the distance from maximum to minimum observation.

Assets’ histogram for return series. The count of the bins is regular for all assets to show the differences of the returns’ densities.

Assets’ boxplot for return series.

Assets’ violin plot for return series.
As mentioned earlier, the methodology proposed is the estimation of a multivariate member of the Generalize Hyperbolic family. In this case the chosen one is the NIG as it has proven to be an adequate distribution (Barndorff-Nielsen, 1995; Núñez et al., 2019) to model Bitcoin returns. Being a case of the GH family, the generalization (Generalize Hyperbolic distribution) manages to provide a greater goodness of fit criteria; however, this gain corresponds only to a marginal one in a risk management perspective. Nonetheless, the unique properties of NIG have proven to be desired for financial models in valuation, risk, and portfolio optimization. In this case, the generalized form is defined as follows:

Such that


With

With
The interpretation of the parameters can be completely defined as follows:
Isolating the GIG component, the first two moments corresponding to the Expected Value and the Variance of the multivariate distribution are:

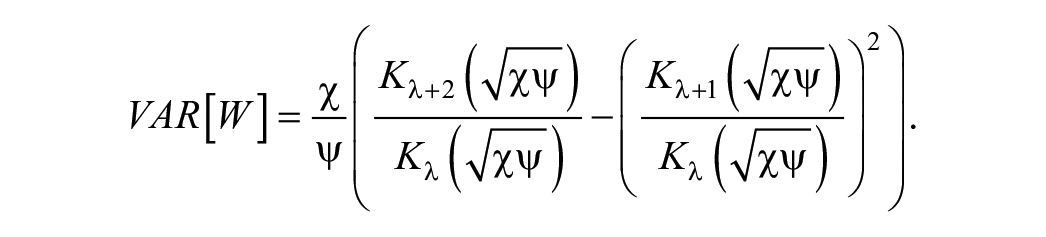
For the special case when


It is important to emphasize that the Expected Value contains the location, shape, and skewness parameters, while the Variance matrix does the same except for the location. The result of such definition becomes a more precise and flexible interpretation to model the expected returns and the covariance among assets. One more consideration to use is the shift of the parametrization to one more efficient. Let
For the portfolio selection, the framework originally proposed by Markowitz (1952) is deployed via the minimization of Variance. In this case, as the assets present high volatility levels, and the intention is to use a rolling window, the probability to get a corner solution is increased. To address this issue, the no short-sale restriction will be avoided. This specification allows for further interpretation of the weights’ changes through time allowing the free movement between positive and negative values. In this case, the no leverage restriction stills on as it works as a boundary to maintain plausible quantities of the assets. So, the final problem to solve may be interpreted as the quadratic problem of:


Where
With the employment of a rolling window, the procedure of fitting a multivariate distribution and then use its parameters as an input to obtain the optimal weights is repeated for every move in the window. The length of it is constant through all the periods and move week by week. The number of observations in each one corresponds to a total of 104. It was selected because it is required a quantity large enough to obtain the distribution parameters, as well as it represents the information of 2 years in history. The result of this tries to consider the short- and long-term information into account.
The use of the multivariate NIG distribution to model the returns is to obtain a cleaner version of parameters. It is assumed that the statistical estimators obtained from the data to determine a theoretical distribution have two main issues: the first is that one can only get an estimator, but not the population parameter. Second, for the multivariate case, the goodness of fit tests tends to lack robustness, so in general more than one test is required.
Results
The first criteria that will be tested is the goodness of fit for the multivariate densities. In this case, the seven assets will be packed into three trivariate portfolios representing the Indexes, Commodities, and Currencies. The goal of doing so is to determine the interaction between two conventional assets of the correspondent class and the inclusion of a cryptocurrency. The first hypothesis to contrast is that these trivariate vectors do not follow a multivariate Gaussian distribution. The statistical tests included are Kernel density (KDE) for two samples, multivariate Cramer and Ball Divergence (BD). All of them are constructed as non-parametric tests, that is, it is not required to specify a theoretical distribution, but to compare simulated values. This specification leads to the null hypothesis that the two samples come from the same distribution or are distributed in the same way. Tables 3 and 4 presents the p-values of such tests for the multivariate Gaussian and multivariate NIG distribution for the three portfolios.
p-Values for Goodness of Fit Test Under Multivariate Gaussian Assumption.
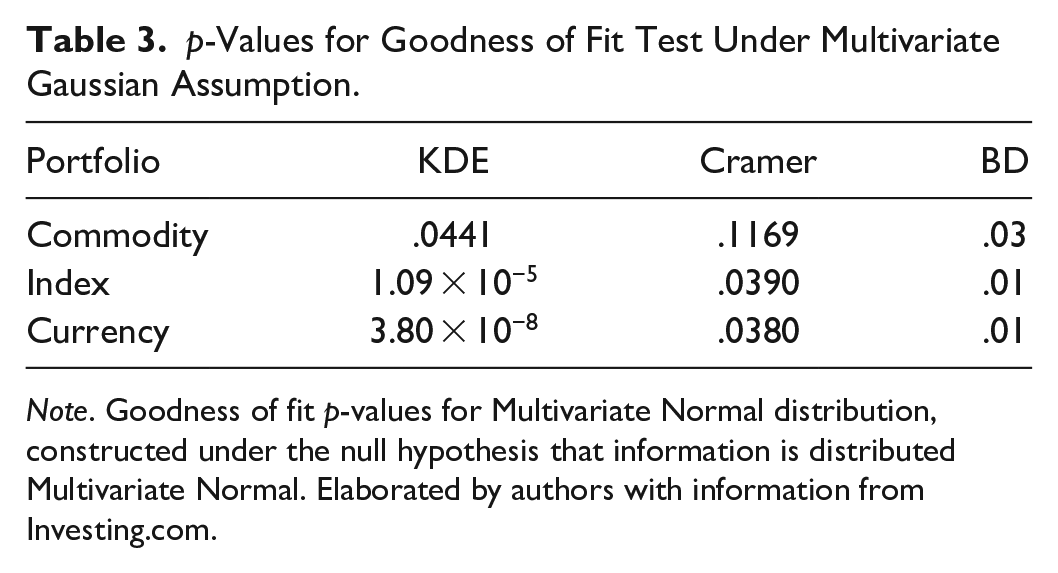
Note. Goodness of fit p-values for Multivariate Normal distribution, constructed under the null hypothesis that information is distributed Multivariate Normal. Elaborated by authors with information from Investing.com.
p-Values for Goodness of Fit Test Under Multivariate NIG Assumption.

Note. Goodness of fit p-values for Multivariate Normal distribution, constructed under the null hypothesis that information is distributed Multivariate NIG. Elaborated by authors with information from Investing.com.
With these results it is possible to confirm that for the multivariate NIG distribution, the adjustments are consistently superior than Gaussian. For the multivariate normal, only the commodity portfolio seems to resemble more to the standard assumption. However, two things must be highlighted: (1) The multivariate goodness of fit statistical tests are not robust enough to completely confirm or reject the null hypothesis, so greater work need to be done in this topic. (2) The periodicity plays a great factor while adjusting univariate or multivariate distribution; as periodicity reduces to daily data, the stylized facts become a greater issue, so the proposal to employ a more flexible distribution becomes more important for such circumstances.
Once we have the results that multivariate data does fit the multivariate NIG, it is possible to use a rolling widow of constant length to estimate the parameters and moments. In this case, the range is determined by 104 observations, in order to have enough information both in quantity and time. The result is that 185 NIG distributions will be estimated. As the volatility in the multivariate case corresponds to a square matrix of dimension K, it becomes unfeasible and unpractical to report the covariances in a table. Instead, the graphical approach will be used to have a better interpretation of it. Figures 6 to 8 presents the covariances among assets that compose the three portfolios.
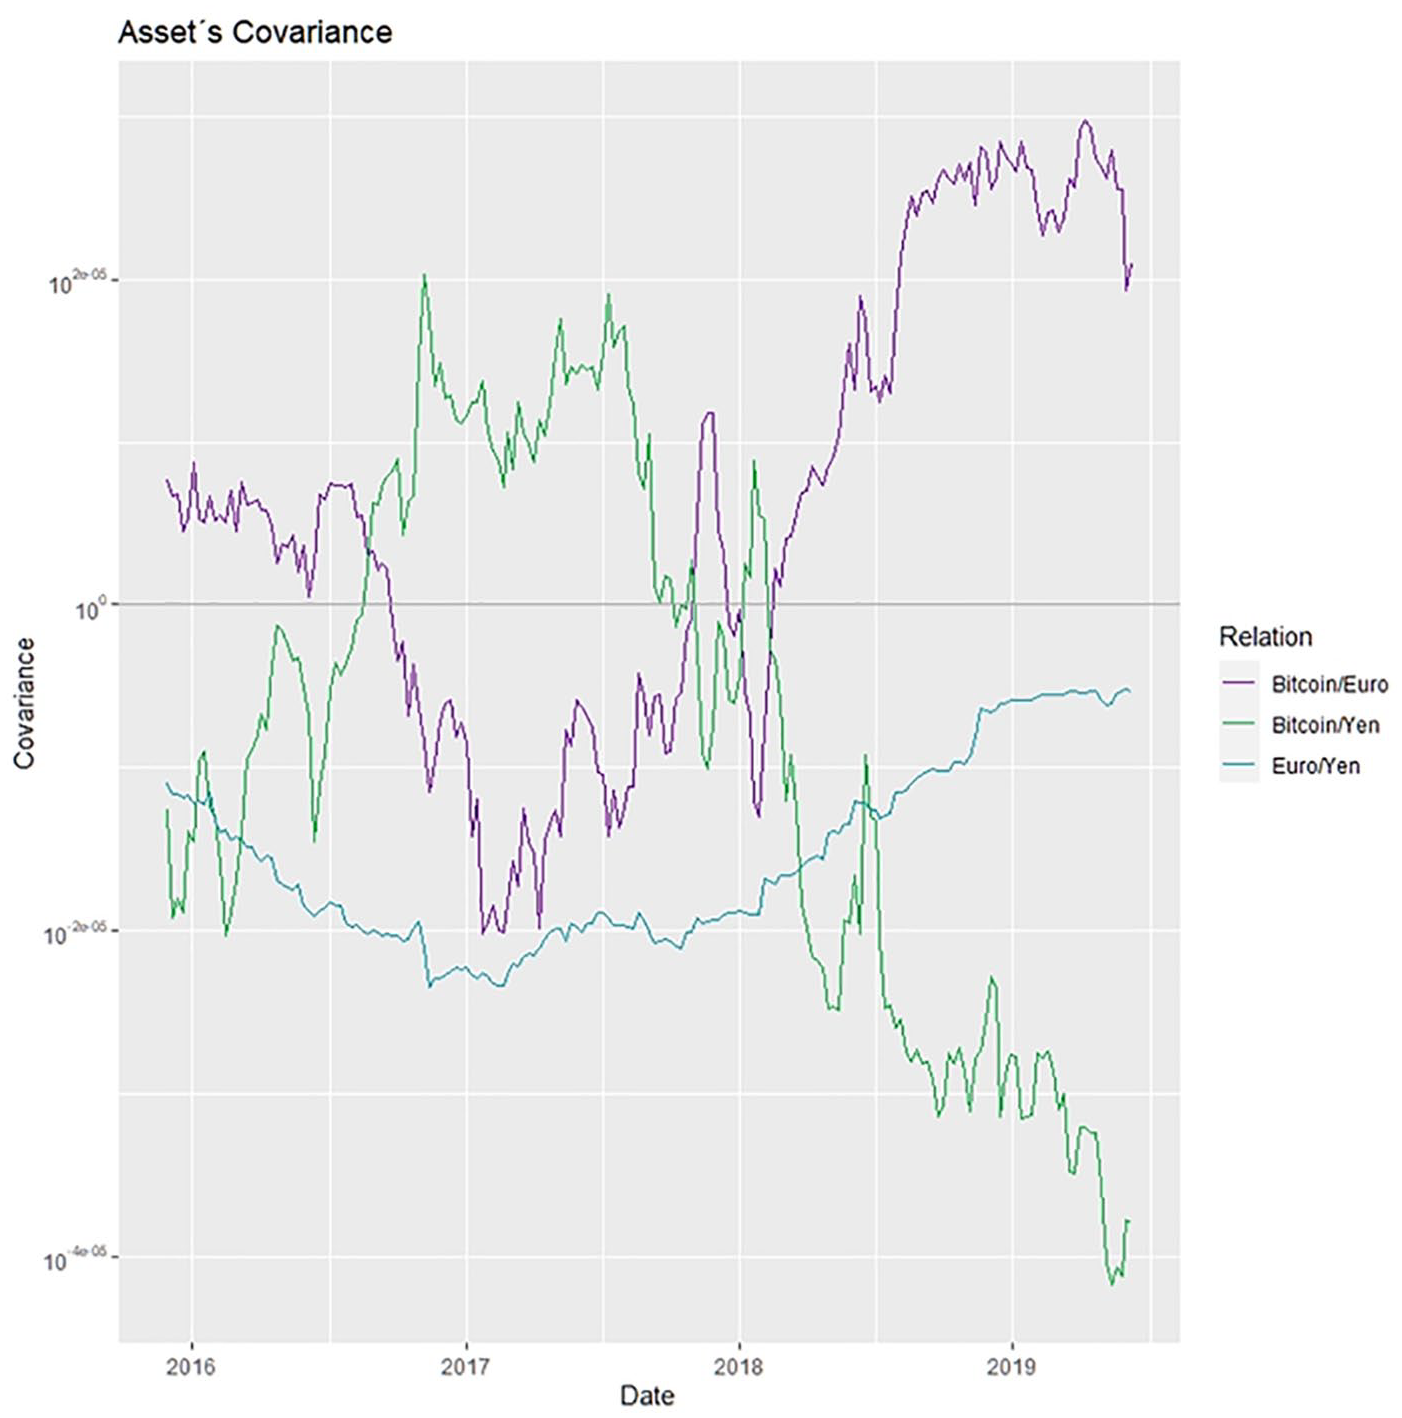
Pairwise dynamic covariance from Multivariate Normal Inverse Gaussian distribution with a rolling window of lenght 104 for the currency portfolio.
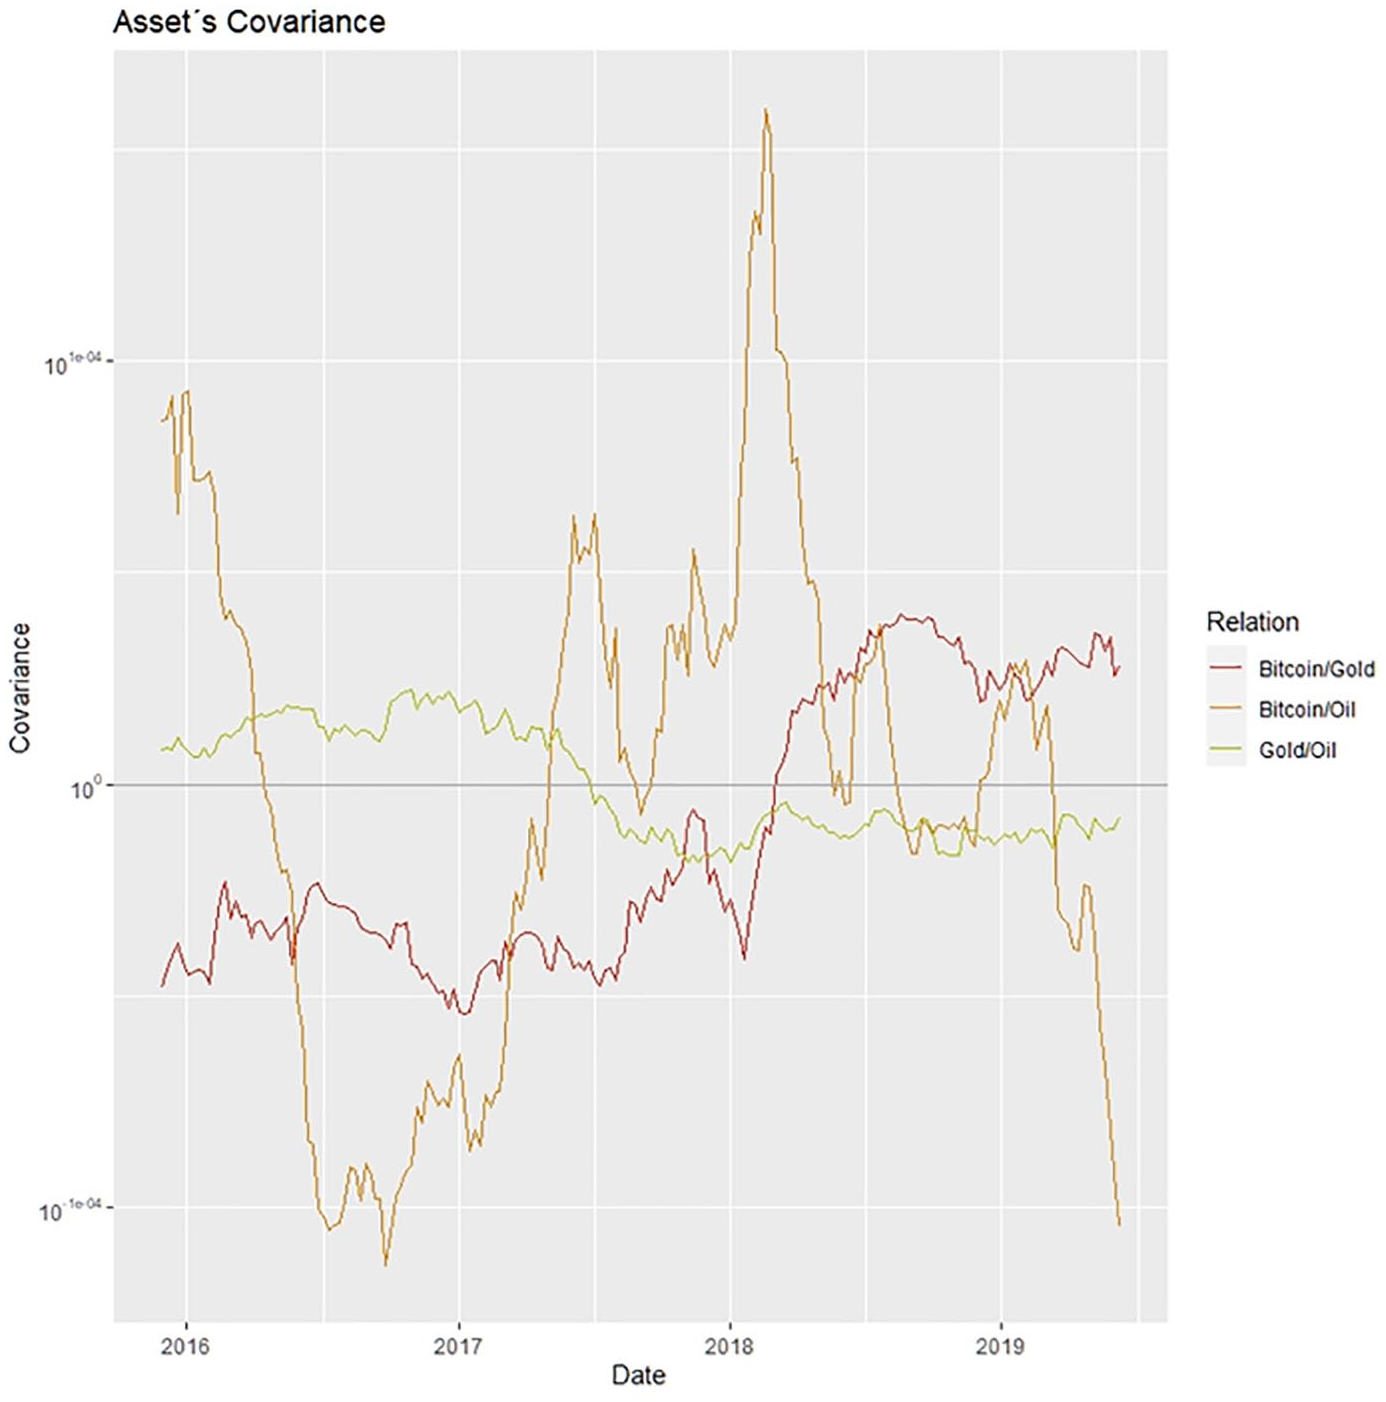
Pairwise dynamic covariance from Multivariate Normal Inverse Gaussian distribution with a rolling window of lenght 104 for the commodity portfolio.

Pairwise dynamic covariance from Multivariate Normal Inverse Gaussian distribution with a rolling window of lenght 104 for the index portfolio.
Looking at the first of this figures (Currencies) it stands out the dynamics between the relation of Bitcoin/Euro and Bitcoin/Yen. There are few moments in which these two covariances are positive and they do not last for long periods of time. This constant shift in tendencies contrast with the consistently negative relation of the currencies. Other fact to point out is that the period of early 2018 marks a great turbulence in these variables. It corresponds with the bubble in Bitcoin detected on that period, which may lead to further analysis about bubble episode detection though this type of movements. Finally, after this period, 2018 and 2019 have maintain certain stability in parameters which may coincide with the projection made by Bouoiyour and Refk (2016).
The second covariance plots relative to Commodities show other case of Bitcoin interaction. In terms of the gold relation it is possible to observe the progressive increase in covariance levels. Being the collapse of the 2018 bubble in Bitcoin the one that shifts the historical negative relation to a positive one. With the oil, the behavior resembles closer to the currencies, especially with Yen. However, it is during the bubble episode that Bitcoin reaches the largest positive covariance with oil. For the rest of the series and particularly in the last observations, the tendency goes to a negative one similar to the levels of mid-2016.
For the final portfolio, the covariance levels of Bitcoin and Dow Jones maintain certain stability around cero; behavior shared with SZSE. Nevertheless, during the bubble episode of 2018 the interaction which is more affected is with the Chinese index. From the bubble collapse until the most recent observations, the covariance among these assets is consistently negative but with a positive slope. Meanwhile, the relation between indexes remain positive for all the selected period.
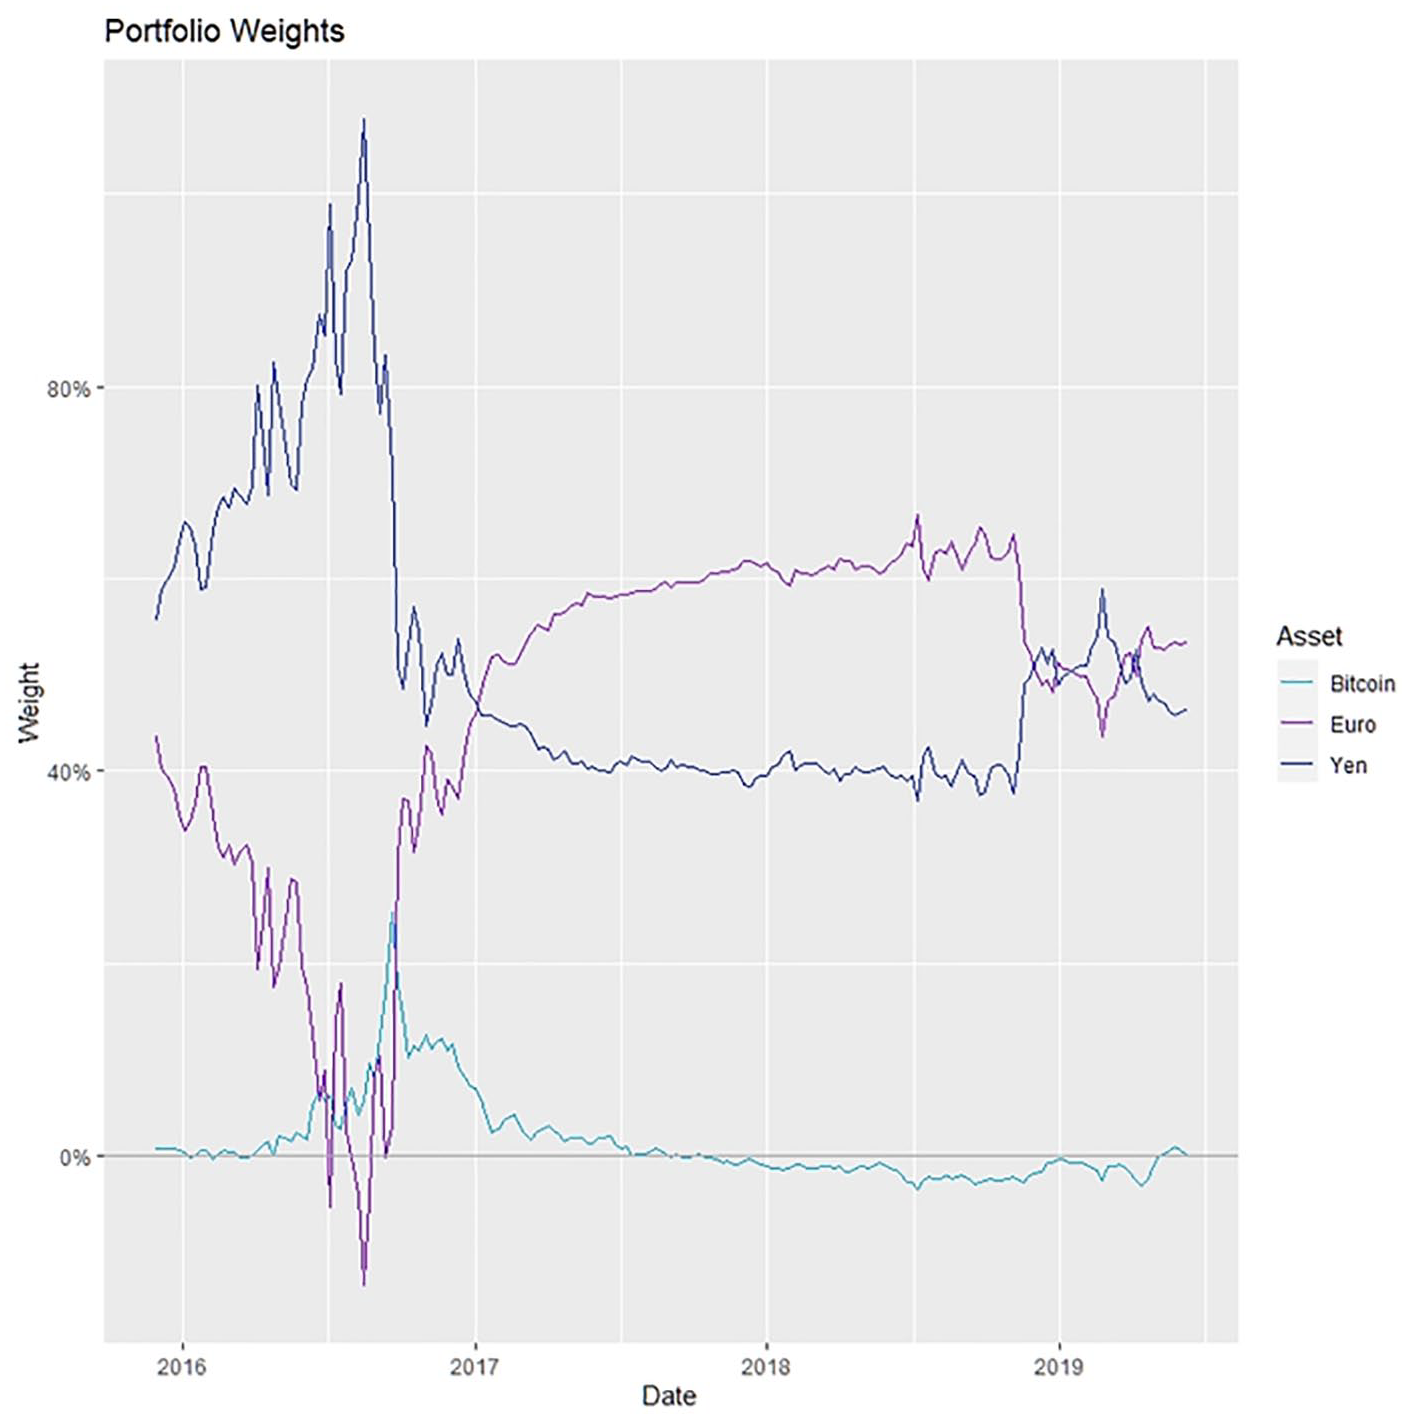
Even the fact that covariance analysis might imply certain hedging properties of Bitcoin with other assets, the real factor from an investment and risk manager position is the high volatility of the cryptocurrency. To take that property into consideration the optimum weight portfolio selection under the minimization of variance specification may cast light upon this issue. In this case, having the volatility matrix and the expected value vector, the optimal portfolio was computed for every period. The evolution of the weights is displayed in Figures 9 to 11.
Dynamic optimum portfolio weights using the Multivariate Normal Inverse Gaussian distribution covariance for currency portfolio.

Dynamic optimum portfolio weights using the Multivariate Normal Inverse Gaussian distribution covariance for commodity portfolio.

Dynamic optimum portfolio weights using the Multivariate Normal Inverse Gaussian distribution covariance for index portfolio.
In general, one constant that can be observed is the low levels assigned to the cryptocurrency in the three portfolios at least in the last period of the data. This may be explained due to the increase in volatility levels of the cryptocurrency; mainly with the collapse of the bubble of 2018. Second, in the commodity portfolio, the values of the Bitcoin achieve their largest values close to one, but in negative values. This result coincides with Haubo (2015) in which the Bitcoin resembles at some degree the effect of gold; from a diversification perspective, this may explain the short position of this asset in the commodity portfolio. Nevertheless, the lack of stability observed in the last years have shown that even when the Bitcoin does possess certain statistical properties that recommend its inclusion as a diversifier, the reality is that risk generated because of it, does not compensate the possible benefits. The clearest evidence is the currency portfolio, in which, just as Baur et al. (2018) concludes, the unique volatility process of the crypto asset does not resemble currencies nor commodities as USD or gold. The effect of such qualities is that they catalog it under a high speculative asset.
Contrary to the results of Al Mamun et al. (2019), this procedure determined that the best way to hedge Bitcoin in long positions seems to be Dow Jones Index. However, this conclusion is not stable, as in 2013 there is evidence that relates the previous findings where using gold is the only way to diversify the cryptocurrency. Nevertheless, because of the evolution of cryptocurrencies’ market, it seems that the covariance structure is not defined yet. Under such possibility, the dynamics of this model might provide a consistent way to update the relationship of assets and so, the computation of optimum weights.
Conclusions
In this paper, the main goal was to determine the behavior of Bitcoin with other conventional assets. To do so, the methodology proposed centered around the statistical properties of financial assets in general and Bitcoin in particular. The stylized facts lead to the break of a classical assumption in most model which rely on the normality of data. However, a punctual analysis of the moments of the series as well as goodness of fit statistics concluded that the Bitcoin may be model with members of the GH family. Extending this methodology to a multivariate framework, the tests concluded that this approach is better than the normal one. In order to maintain certain laudable properties of Gaussian distribution, the multivariate NIG was proposed as an alternative that manage to capture in its parameters the heavy tails, leptokurtosis, and skewness. By implementing the corresponding moments in this distribution to a classical portfolio optimization problem, the optimal weights were computed for portfolios corresponding with currencies, commodities, and indexes.
The results indicate that although Bitcoin might be used as diversifier, the extreme value presence translated to high volatility represents a deterrent to assign high weight values to it. Furthermore, the interaction of Bitcoin with other classes of assets is completely different and unconnected to one another, so the results are consistent with the conclusion that markets are disconnected. However, in the individual aspect it is also important to mention that changes in covariance values across sings are relatively common. This may also indicate that the best way to implement models with cryptocurrencies are the ones that considers the dynamic across time.
Future research in this area may include the combination of methodologies that help to enrich the previous results. The usage of Dynamic Conditional Correlation models with underlying distributions with heavier tails than Normal could lead to a more adaptable way to measure shifts in correlation among assets. Furthermore, the inclusion of higher order moments into the of expected returns and volatilities of the returns can be used to specify the portfolio optimization problem into other objectives, such as minimization of Value at Risk or Expected Shortfall. Those objectives might present an opportunity to include cryptocurrencies into investment portfolios that can take advantage of these new assets while maintaining a risk management component in it.
The relevance of this paper relies in the capability to incorporate stylized facts into the asset allocation problem. It provides a methodology to create better portfolios as it incorporates aspects such as kurtosis, skew, and dynamic correlations; being a key element in the addition of cryptocurrencies in traditional portfolios. Such results may provide insights for practitioners and researchers to analyze and construct Markowitz portfolios with a more accurate risk reward relationship.
Footnotes
Declaration of Conflicting Interests
The author(s) declared no potential conflicts of interest with respect to the research, authorship, and/or publication of this article.
Funding
The author(s) received no financial support for the research, authorship, and/or publication of this article.