
Abstract
Volatility exchanges between equity markets and oil markets are vital for portfolio designing and risk management. This study empirically analyses the interdependence of stock and oil market for G7 countries. For econometric estimations, we used the data of G7 countries’ stock markets for the period of 2000-2016. Dynamic conditional correlation and corrected dynamic conditional correlation are employed for symmetric estimation. We find differences in the magnitudes of negative and positive oil price shocks of G7 countries. The study also uses the asymmetric estimations to examine the response of different shocks, and the variance and covariance series of these estimations are used for portfolio optimization and hedging of stock and oil assets. The findings of symmetric and asymmetric estimations depict that past news and lagged volatility have a significant impact on the current conditional volatility of G7 stock markets. On the contrary, the current conditional volatility in the oil market is less dependent on past news and lagged volatility in the oil market. Our results portray that G7 stock markets are more sensitive to past news and lagged volatility than oil markets. FIGARCH and FIEGARCH provide evidence of an intermediate range of persistence of volatility. Finally, portfolio estimations report the importance of oil assets to form an optimal portfolio that can minimize the portfolio risk without changing the expected return. Based on our findings, we suggest that investors and portfolio managers of G7 countries should formulate a portfolio of stock and oil assets to manage their portfolio risk.
Introduction
In the recent three decades, the stock market returns continue to remain unpredictable as such affecting both international and national economies (Degiannakis, Fills, & Arora, 2017). The volatility of the stock returns has prompted numerous economists to dedicate resources on analysis of dynamics influencing the unpredictability. Moreover, the recent financial crisis and management of markets have inspired concern for many investors, scholars, and financial consultants. Exploring the dynamics associated with volatility is critical in the analysis of financial economics since it influences investment decisions by investors and laws by policy makers. One of the most influential underlying forces in the stock market is oil prices (Waheed, Wei, Sarwar, & Lv, 2018). Volatility exchanges between the oil market and equity markets are essential for both portfolio designing and risk management. There is little doubt on the influence of oil prices on various economic variables of a country or internationally. As such, volatility spillover between oil and stock markets is vital in analyzing hedging ratios for oil-stock investment holdings.
The price of oil typically encompasses the spot price of a barrel of crude oil. There is a differential in the prices of oil depending on the grade. The price of oil is marked internationally since it is one the most traded commodity in international levels. From the late 1990s to 2008, the prices of oil rose significantly. Many economists attributed the increase in oil prices to growing demand in the emerging economies. The oil prices hit the highest during the 2008 recession at more than US$140 a barrel (Degiannakis et al., 2017). The lowest prices of oil were also recorded in the middle of the recession in December 2008. However, they peaked up immediately after the crisis. Between 2010 and 2013, the prices of oil remained between US$90 and US$120. However, the prices have been declining since 2014 due to a significant increase in oil production in the United States and some other reasons.
There is a high level of unpredictability in the oil market. Studies indicate that the primary cause of fluctuations in oil prices since the 1980s is explained by the shift in oil demand. The fast expansion of the global economy illustrates the increase in the usage of oil (Hamilton, 2009). Similarly, high inventory demand for oil is frequent during times of geopolitical tension and highly anticipated global economic upsurge. Domestic conflicts and international issues in oil-producing countries contribute to increase oil prices (Shahbaz, Sarwar, Chen, & Malik, 2017).
The extent to which stock markets are affected in both long run and short term by oil price shocks varies considerably. When the price of oil increases, real output is compromised. The upsurge in prices of oil would predictably cause the decline in stock prices owing to higher expenses hence lower corporate earnings. In addition, considering oil is an essential commodity in the production process of various companies in the G7 countries, it may result in inflationary pressure and higher interest rates. The adverse effect of an increase in the price of oils on the stock market returns was initially confirmed by an experimental study by Jones and Kaul (1996); this research indicated significantly reduced returns in inventory market due to crude oil impacts in Canada and the United States. However, the results were less evident for the United Kingdom and Japan. Sadorsky (1999) described oil prices played a significant influence on stock markets returns in the United States between 1946 and 1996. Apergis and Miller (2009) analyzed the stock markets for eight economies, including G7 countries, and reported a nonlinear relationship between prices of oil and stock market returns.
However, the nonlinear theoretical assumption of the effect of oil price fluctuations on the stock market does not always hold. In recent years, many economists cited the bubbles in the crude oil market as the main reason for different results in various countries. Some studies indicated a linear relationship between oil prices and stock markets (El-Sharif, Brown, Burton, Nixon, & Rusell, 2005). Similarly, other surveys show that oil shocks do not influence stock market returns in either a positive or negative way. Another study indicated that oil price has no long-term impact in the G7 countries as it does in emerging economies like Brazil, Russia, India, and China (BRIC) states (Markoulis & Neofytou, 2016). The unrelated results can be explained by the different degree of dependence on oil in various economies.
Moreover, a multitude of studies has insisted on the importance of portfolio formation in minimizing risks (Arouri & Nguyen, 2010; Degiannakis et al., 2017; Khalfaoui, Boutahar, & Boubaker, 2015). Portfolio formation is a diversification technique that reduces risk through the allocation of financial holdings to various instruments and industries. The model involves investing in different categories that react differently to the same event in efforts of maximizing returns. If stock and oil markets are nonlinear, their diversification maximizes returns while in the event they are positively correlated, diversification of the two markets is not necessary. The relevancy of oil prices on stock market returns whether in the short run or long run displays the influence of oil prices on portfolio formation and risk hedging (Arouri & Nguyen, 2010). Moreover, oil is the record-used physical commodity in its capacity; as such, it has a tremendous influence on portfolio formation depending on price fluctuations (Miller & Ratti, 2009).
Statistics indicate the high interdependence rates between crude oil prices and the stock market returns in the 1990s (Markoulis & Neofytou, 2016). This correlation is associated with the influx in the housing market which influenced the Organization of the Petroleum Exporting Countries (OPEC) to stimulate oil production. As such, it is evident that aggregate demand for oil shock increases the correspondence between oil prices and stock markets. The precautionary oil demand shock reduces correlation between the oil and equity markets as evident between the years 2001 and 2006 which was characterized through several oil demand shocks such as the Iraq war in 2003 (Ftiti, 2016). The correlation increased significantly in all the G7 countries during the 2008 financial crisis which is considered an aggregate demand oil shock. Despite the level of correlation, there is a relationship between oil shocks which expectably influences oil prices and the stock markets in the G7 countries.
The existing studies have not analyzed the optimal strategy to construct an oil-stock portfolio by using econometric estimation techniques, symmetric and asymmetric spillover between oil and the stock market. Therefore, the objective of our study is to fill this gap by examining the portfolio optimization strategies using symmetric and asymmetric estimations for G7 countries. These countries include the United States, the United Kingdom, Germany, Canada, Italy, France, and Japan. The motivation behind analyzing G7 countries is the influence of oil in their economies that shows the relevance of oil price fluctuations in the G7 countries as both oil importing and exporting countries. Moreover, these countries have the most developed and prestigious stock market systems that are important in analyzing trends regarding oil prices and formation of portfolios to hedge risks.
Objective of Study
This article attempts to examine the symmetric and asymmetric effect among the oil market and stock markets by using the time series data over the period from January 2000 to December 2016. Our emphasis is on the stock markets of G7 countries. There are three key objectives of the current study. First, this study explores the interdependence among the oil market and stock markets. It might well be asked how past news and lagged volatility affect the current conditional volatility of oil and stock markets in its respective markets. Previously, the studies only emphasized on traditional approaches such as CCC-GARCH (constant conditional correlation–generalized autoregressive conditional heteroskedasticity) and DCC-GARCH (dynamic conditional correlation–generalized autoregressive conditional heteroskedasticity); however, this article uses the modern technique cDCC-GARCH (corrected dynamic condition correlation–generalized autoregressive conditional heteroskedasticity) that is introduced by Aielli (2008). This latest method by Aielli (2008) has reformulated the correlation process.
Second, we examine the presence of an asymmetric effect in the oil market and G7 stock markets. The asymmetric analyses look at the range of persistence of lagged volatility on current conditional volatility. In addition, asymmetric analyses observe the response of negative and positive shocks in its respective markets. Earlier studies in the context of G7 countries have not studied the asymmetric effect such as the persistence of volatility effect on oil and the stock market. To the best of our knowledge, this study is the first attempt to examine the persistence of volatility effect on stock and oil market in the context of G7 countries. Finally, the study is to evaluate the role of oil assets to form an optimal portfolio. It might well be asked how oil assets can be used to hedge the portfolio risk.
Significance of Study
The article is important as it provides informed insight on portfolio management that aims to reduce risks and influence profitable investment decisions. The study will contribute to the growing literature on the influence of oil price on the stock markets and portfolio optimization in G7 countries. As such, investors and portfolio managers may use the suggestions of the study to initiate appropriate diversification and risk-hedging strategies (Arouri & Nguyen, 2010). The emphasis on cDCC-GARCH model provides insight on the link of volatility transmission among the oil and stock markets. The conclusions from the study will provide insight to policy makers since adverse oil prices fluctuations may result in extreme influences on the equity markets hence affecting cash flow in corporate domains. The incorporation of oil and stock markets volatility transmission provides long-term analysis. Long-run effects of oil prices on stock markets are essential in influencing informed decision making (El-Sharif et al., 2005).
Method
DCC-GARCH Model
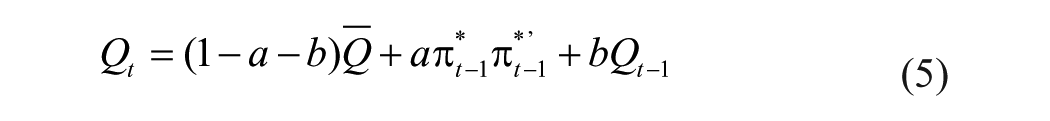
This study uses the stock index and the oil prices for G7 countries to analyze the relationship between oil prices and the stock market. The analysis is conducted by applying the DCC-GARCH framework. Previously, similar techniques have been applied by McAleer, Hoti, and Chan (2009) and Arouri, Lahiani, and Nguyen (2011) for investigating the relationship between the oil and stock returns. DCC-GARCH is the most applied method in this study; this method answers the question of whether the stock market and oil market are dependent on the past news and lagged volatility, in its respective markets. The specification of DCC-GARCH is considered as the generalization of CCC-GARCH model as proposed by Bollerslev (1990). The dynamic condition correlation in this method is given as follows:

Where

The dynamic conditional correlation parameters are as follows:


cDCC-GARCH Model
The cDCC-GARCH is a more amenable DCC model. It is described and heuristically proven to be a consistent model of examination. This model was introduced by Aielli (2008) which is similar to the DCC-GARCH model by Engle (2002). However,
The specification of cDCC-GARCH model is the same as the specification of the DCC-GARCH model. However, Aielli (2008) reformulated the correlation process as given in Equation 13.
Where
Asymmetric GARCH Estimations
GJR-GARCH (Glosten–Jagannathan–Runkle–generalized autoregressive conditional heteroskedasticity) model
Both the GJR and the GARCH specification are often used in the finance and economics literature. However, according to various researchers such as Mohammadi and Su (2010) and Morana (2001), the GJR model performs better than the GARCH specification thereby enhancing forecasting performance. This model was introduced by Glosten, Jagannathan, and Runkle (1993) which is used to support the fact that conditional variance oil price return responds asymmetrically to the shocks of equal magnitude with difference sign (Morana, 2001; Mohammadi & Su, 2010). The GJR-GARCH reads as follows:


Where,
FIGARCH (fractional integrated generalized autoregressive conditional heteroskedasticity) model
This study made use of the bivariate model of Brunetti and Gilbert (2000) to investigate the volatility processes for the stock and oil prices. This model is used to find out the extent to which stock and oil volatility persists. The primary purpose of the model is to develop a more complex flexible class of processes for the conditional variance. The FIGARCH model combines many features of the fractionally integrated processes for the mean and the conditional variance for the GARCH process.

Where d is the parameter that describes the degree of hyperbolic decay. There are three scenarios: one, if
FIEGARCH (fractionally integrated exponential generalized autoregressive conditional heteroskedasticity) model
This model is similar to the other models of estimation, but the FIEGARCH simultaneously deals with the finite persistence of the shocks and the magnitude of positive or negative shocks. The FIEGARCH model was proposed by Bollerslev and Mikkelsen (1999). This model has the property of positive conditional variance, and therefore the study had to make use of the model to estimate the persistence of shocks on volatility and the magnitude of the stock market deviation.
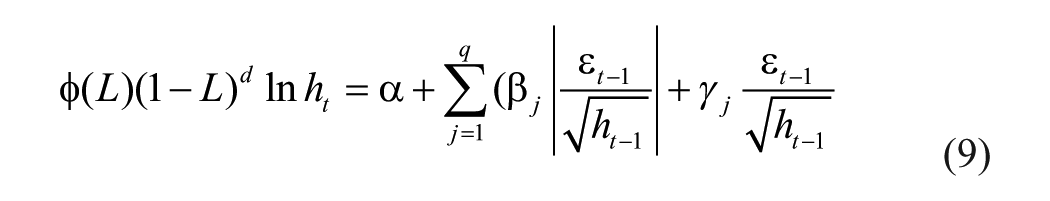
Where
Portfolio Management With Oil Risk-Hedging Strategies
This section uses the variance and covariance series to calculate, calculated from the above models, and to evaluate whether oil is a useful asset for portfolio optimization. The primary objective of this study was to provide risk-hedging analysis without reducing the expected return. According to Kroner and Ng (1998), the optimal weight of oil in one dollar of the stock market at a specified time

Under condition that

Where

Data and Preliminary Analysis
The study uses daily base data for econometric analysis over the period from January 2000 to December 2016. The choice of information in the past 20 years is based on the availability of information. The stock price data of G7 stock markets are collected from their relevant websites. Whereas, the daily base oil price data for the study are collected from the U.S. Energy Information Administration (2017). The present study uses the data of New York stock exchange for the United States, FTSE 100 for the United Kingdom, S&P/TSX Composite for Canada, FTSE MIB for Italy, CAC 40 for France, DAX 30 for Germany, and NIKKEI 225 for Japan. For analysis, we utilize the return series of all the stock prices which is the natural logarithm of closing prices divided by lagged closing prices. The formula for the calculation is as follows:

Where, Ri, t represents the return series of stock i at time t. Pi, t is the price series of stock i at time t and Pi, t – 1 is the lagged price of stocks.
Table 1 shows the descriptive statistics of West Texas Intermediate (WTI) oil return series, US stock return, UK stock return, German stock return, Canadian stock return, Italian stock return, French stock market return, and Japanese returns series. The total number of observations for the return series is 3,504. WTI oil return series has the maximum average value while the Canadian stock series contains the lowest average return with 1.0947 and 0.0152, respectively. However, the oil series and all stock return series present negative skewness that shows the extreme losses in the oil market.
Descriptive Statistics.
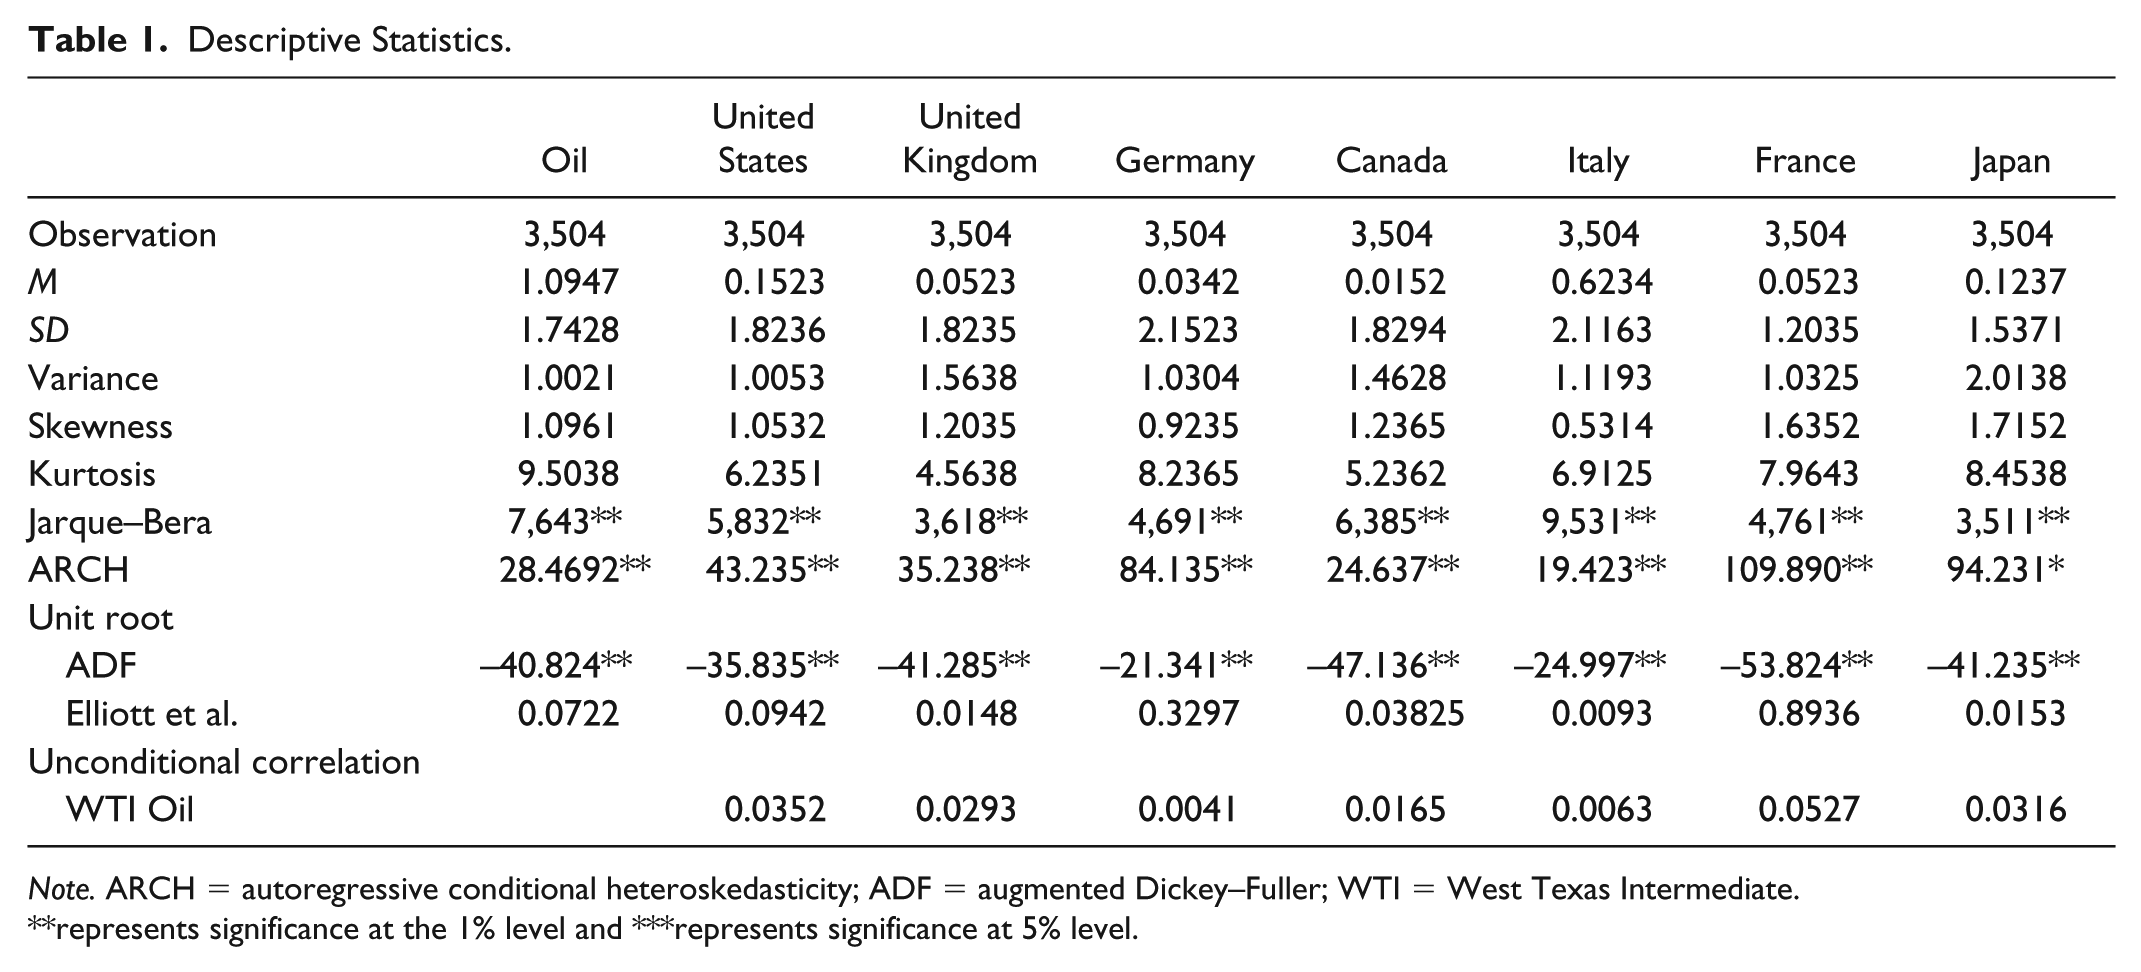
Note. ARCH = autoregressive conditional heteroskedasticity; ADF = augmented Dickey–Fuller; WTI = West Texas Intermediate.
represents significance at the 1% level and ***represents significance at 5% level.
Furthermore, the statistics of Kurtosis and Jarque–Bera indicate the non-normality of oil and stock markets return. The significance of ARCH effect appears in the oil and stock markets. This non-normality and presence of ARCH allow us to apply the GARCH modeling to examine the oil and stock markets spillover. For stationarity analysis, Augmented Dickey–Fuller (ADF) and Elliott, Rothenberg, and Stock (1996) unit root tests have been used which rejected the null hypothesis of unit root presence in the return series of oil and stock markets.
Empirical Evidence
Symmetric Analysis
Tables 2 to 8 report the symmetric and asymmetric GARCH estimations for G7 countries. The findings of the symmetric DCC-GARCH confirm that past shocks in the US stock market have a significant effect on the current conditional volatility of the US stock market. Moreover, the current conditional volatility responds to the lagged volatility in US stock market. However, the results for oil series are contradicting the past shocks and conditional volatility have no significant impact on current volatility and supports the findings of Khalfaoui et al. (2015; Liu, An, Huang, & Wen, 2017). The robust estimations using the cDCC-GARCH also report similar results for the United States and oil market.
U.S. Analysis.
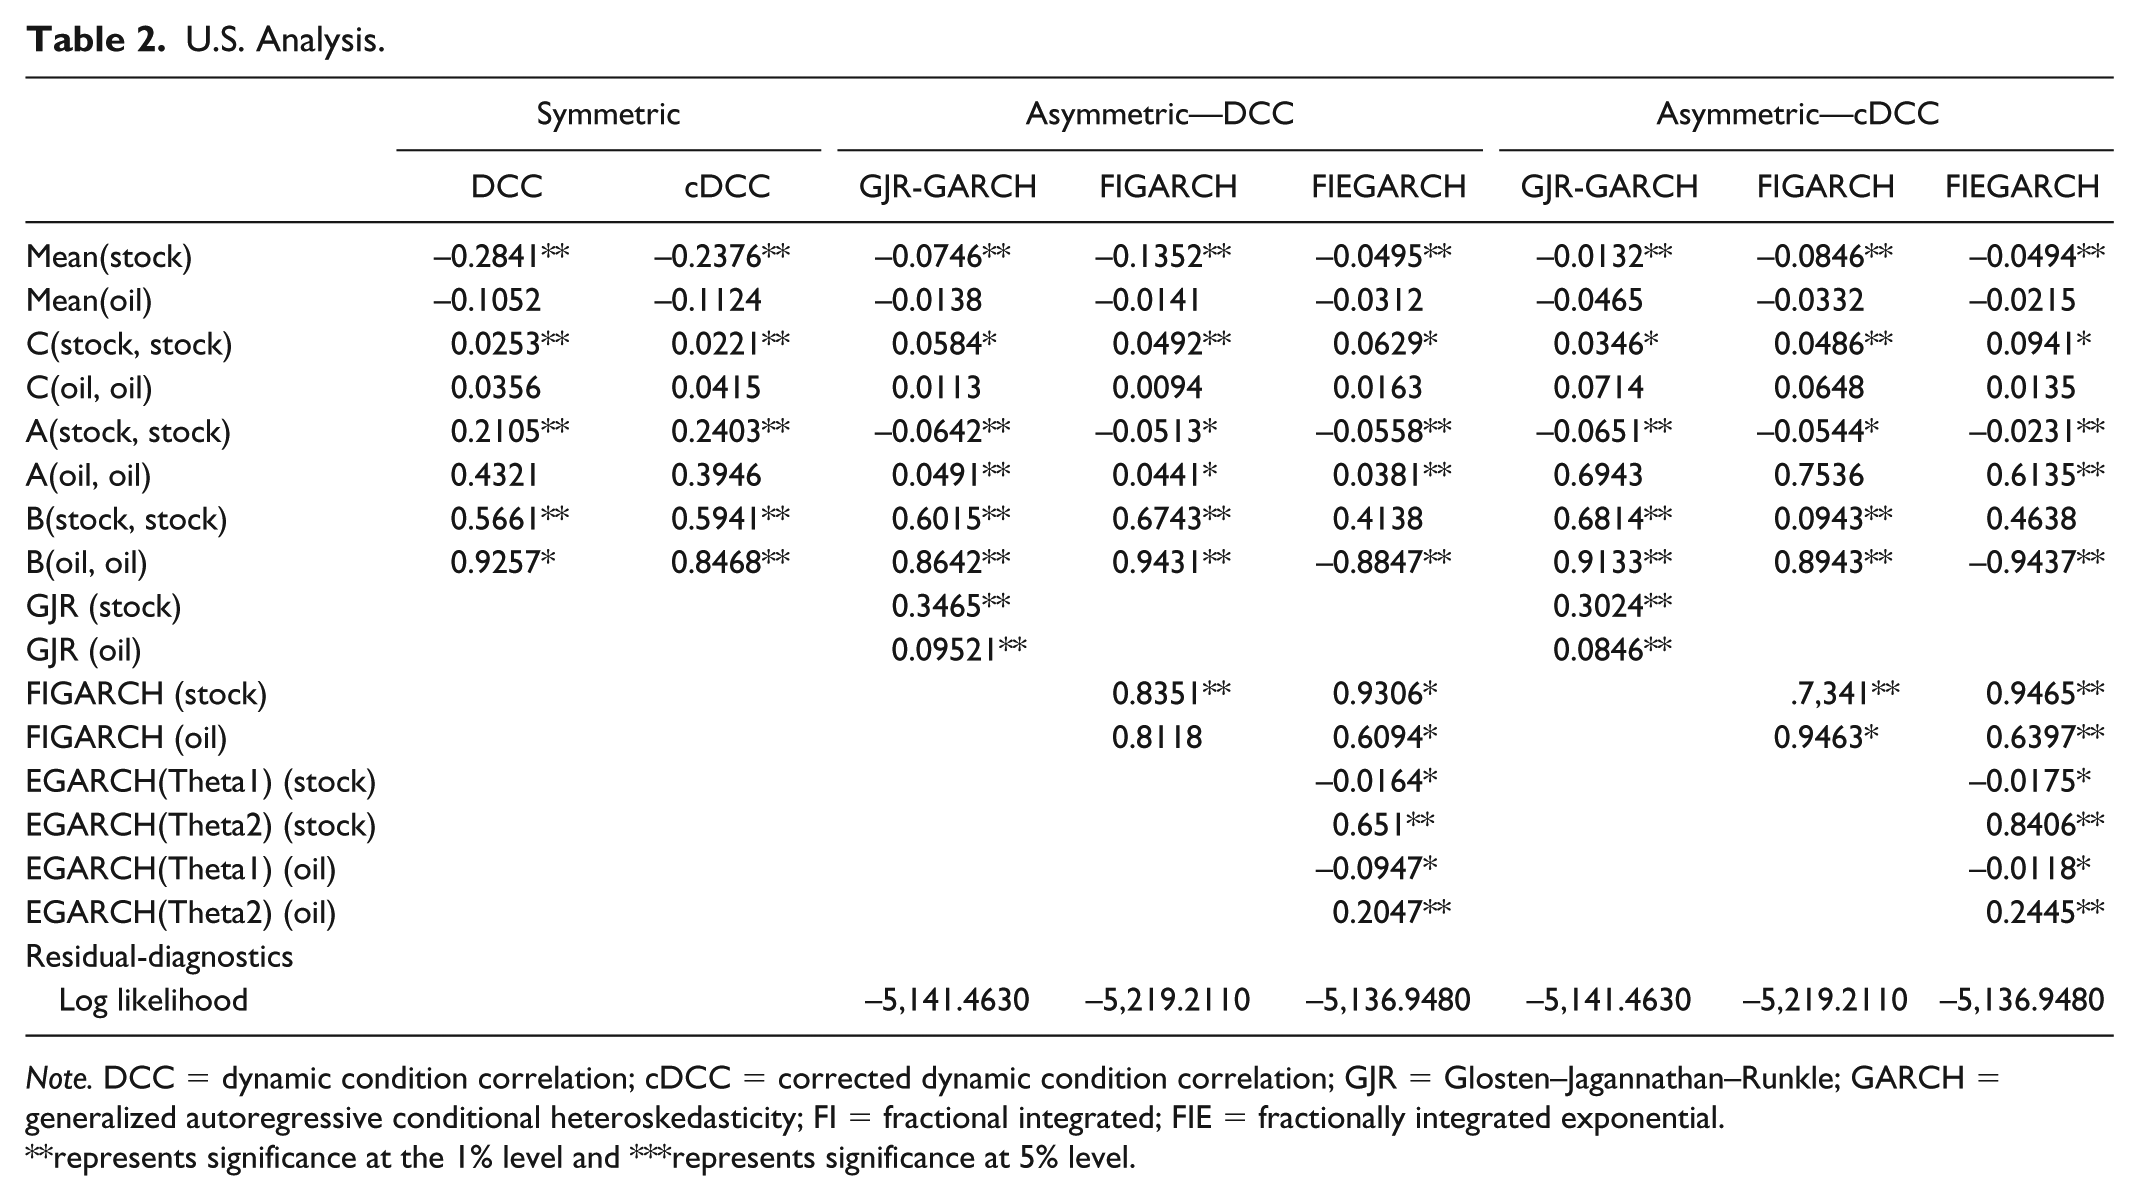
Note. DCC = dynamic condition correlation; cDCC = corrected dynamic condition correlation; GJR = Glosten–Jagannathan–Runkle; GARCH = generalized autoregressive conditional heteroskedasticity; FI = fractional integrated; FIE = fractionally integrated exponential.
represents significance at the 1% level and ***represents significance at 5% level.
Table 3 indicates a symmetric estimation of the DCC-GARCH and cDCC-GARCH for UK stock market and oil market. The result shows that the current conditional volatility of stock returns respond to the past news, in its market. The lagged conditional volatility has a significant impact on current conditional volatility for the UK stock market. On the contrary, the current conditional volatility of the oil market does not respond to the lagged volatility. Similarly, Table 8 reports the results for the Japanese stock market with similar findings.
UK Analysis.

Note. DCC = dynamic condition correlation; cDCC = corrected dynamic condition correlation; GJR = Glosten–Jagannathan–Runkle; GARCH = generalized autoregressive conditional heteroskedasticity; FI = fractional integrated; FIR = fractionally integrated exponential.
represents significance at the 1% level and ***represents significance at 5% level.
Table 4 offers the results of DCC-GARCH for German stock market; the findings show that past news in the stock market has a significant effect on the current conditional volatility. However, the past news in the oil market has no impact on the current volatility of the oil market. On the contrary, the current conditional volatility in the stock and oil market significantly responds to the lagged volatility in its market. Similarly, the estimations of the robust test, cDCC-GARCH, confirms that past shocks and lagged conditional volatility have a significant effect on current conditional volatility, in its respective markets.
Germany Analysis.

Note. DCC = dynamic condition correlation; cDCC = corrected dynamic condition correlation; GJR = Glosten–Jagannathan–Runkle; GARCH = generalized autoregressive conditional heteroskedasticity; FI = fractional integrated; FIE = fractionally integrated exponential.
represents significance at the 1% level and ***represents significance at 5% level.
Table 5 illustrates the findings of symmetric DCC-GARCH for the Canadian stock market. The results confirm the significant effect of past news and lagged conditional volatility on current conditional volatility for the Canadian stock market. On the contrary, the past news and lagged conditional volatility have proved to be insignificant for oil series. The cDCC-GARCH supports the results for Canadian stock market; the current conditional volatility responded to the lagged news and lagged conditional volatility. Interestingly, in the cDCC-GARCH analysis, the result shows that the current conditional volatility of the oil market significantly responds to the lagged conditional volatility.
Canada Analysis.

Note. DCC = dynamic condition correlation; cDCC = corrected dynamic condition correlation; GJR = Glosten–Jagannathan–Runkle; GARCH = generalized autoregressive conditional heteroskedasticity; FI = fractional integrated; FIE = fractionally integrated exponential.
represents significance at the 1% level and ***represents significance at 5% level.
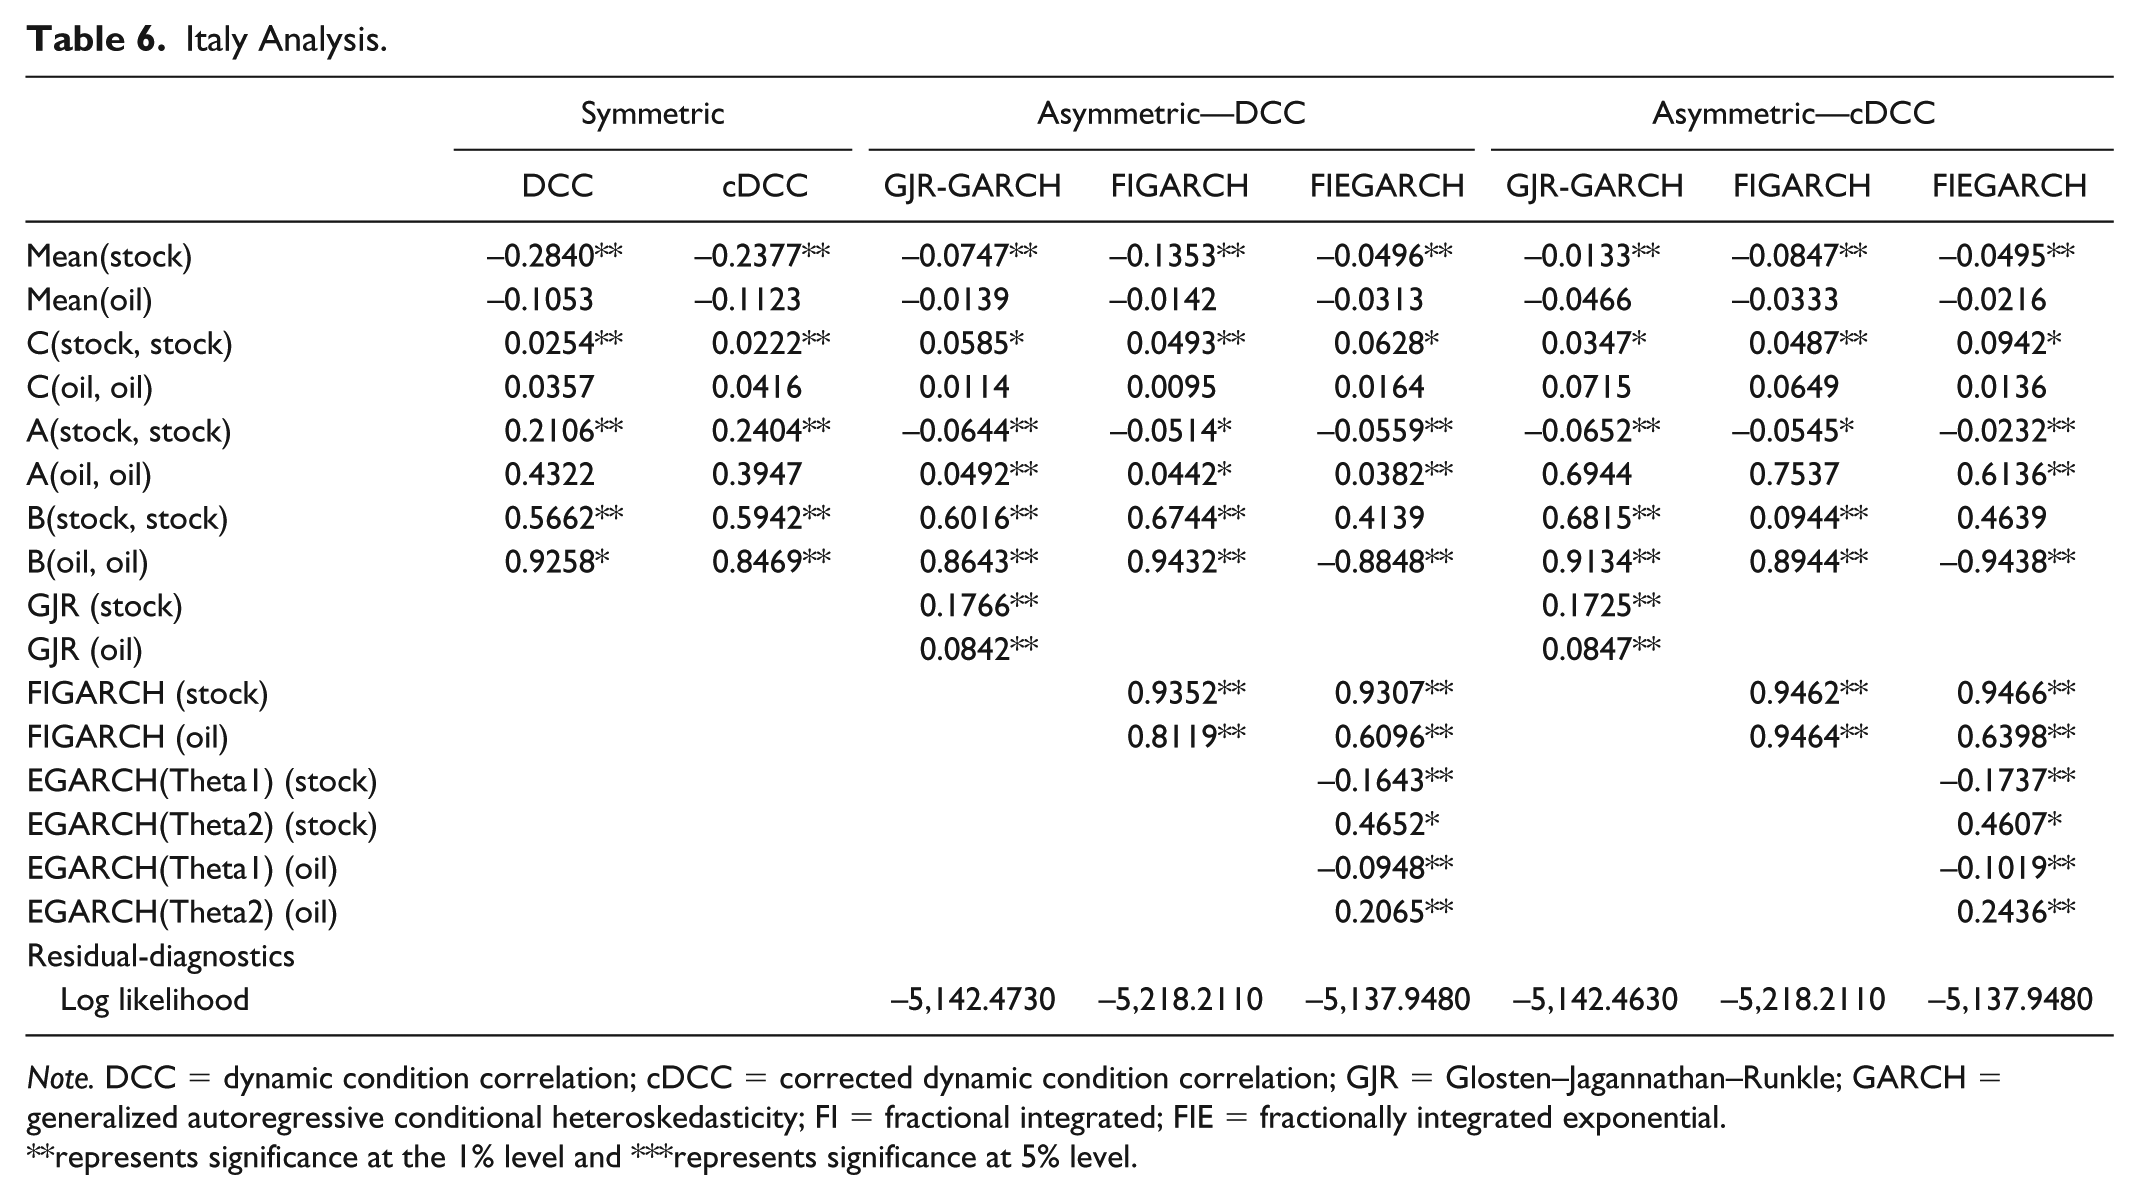
Table 6 presents similar results for the Italian stock market, whereas Table 7 shows the estimations for the French stock market. Column 2 and 3 deal with the symmetric GARCH techniques, named DCC-GARCH and cDCC-GARCH. The results of ARCH and GARCH coefficients describe that past news and past conditional volatility are statistically significant at 1% level. Thus, the findings confirm the significant impact of lagged news and lagged conditional volatility on current conditional volatility for stock and oil markets, in its respective markets. It is also worth noting that coefficients of ARCH term are smaller than the coefficients of GARCH term, which suggests that current conditional volatility responds more quickly as significant impacts of lagged volatility than as lagged shocks.
Italy Analysis.
Note. DCC = dynamic condition correlation; cDCC = corrected dynamic condition correlation; GJR = Glosten–Jagannathan–Runkle; GARCH = generalized autoregressive conditional heteroskedasticity; FI = fractional integrated; FIE = fractionally integrated exponential.
represents significance at the 1% level and ***represents significance at 5% level.
France Analysis.

Note. DCC = dynamic condition correlation; cDCC = corrected dynamic condition correlation; GJR = Glosten–Jagannathan–Runkle; GARCH = generalized autoregressive conditional heteroskedasticity; FI = fractional integrated; FIE = fractionally integrated exponential.
represents significance at the 1% level and ***represents significance at 5% level.
Japan Analysis.

Note. DCC = dynamic condition correlation; cDCC = corrected dynamic condition correlation; GJR = Glosten–Jagannathan–Runkle; GARCH = generalized autoregressive conditional heteroskedasticity; FI = fractional integrated; FIE = fractionally integrated exponential.
represents significance at the 1% level and ***represents significance at 5% level.
Asymmetric Analysis
Tables 2 to 8 present the results of asymmetric GARCH. The fourth column of each table deals with the GJR-GARCH, which shows that the current conditional volatility responds significantly to past shocks in the respective market. The coefficient of GJR-GARCH for US stock market indicates that the magnitude of adverse shocks is higher in the US market. The statistical value of FIGARCH shows the persistence of shocks over the period. For US analysis, the oil and stock market values confirm that volatility has an intermediate range of persistence and the process contains a unit root. The results of FIEGARCH depict the persistence of volatility as well as the magnitude of negative and positive shocks on current conditional volatility. The significant value of FIEGARCH indicates that the US stock market and oil market also provide evidence of an intermediate range of persistence of shocks on conditional volatility. Moreover, the conditional volatility of stock and oil markets has a higher response to the adverse shocks than the positive shocks. The asymmetric results further show that the magnitude of negative shocks in the stock market is higher than in the oil market.
The values of GJR-GARCH for UK stock market and oil market indicate the higher magnitude of adverse shocks on current conditional volatility in its market. The GJRGARCH results further confirm that a negative shock profoundly affects the stock market than the oil market. Asymmetric FIGARCH is significant for both stock and oil market, with the values greater than zero and less than one, which indicates that the lagged shocks have an intermediate range of persistence on current conditional volatility, the same is true for FIEGARCH. Similarly, the adverse shocks in the UK stock market and oil market have a higher magnitude than the positive shock and this further confirms the previous findings. Furthermore, this magnitude is higher for the stock market as compared with the oil market.
Table 4 provides the results of the asymmetric analysis for the German stock market and oil market. The significance of GJR-GARCH provides evidence that negative lagged shocks in the German stock market and oil market have a higher magnitude than positive shocks. However, in contrast to the US and UK findings, the oil market shows a higher response to the negative shocks. The FIGARCH presents the intermediate range of volatility persistence in German stock and oil market with the values of 0.84 and 0.82, respectively. Moreover, the FIEGARCH estimations support the result of FIGARCH indicating that the significant parametric values 0.89 and 0.78 for the German stock market and oil market, respectively. However, the FIEGARCH also confirms the results of GJR-GARCH that negative shocks in the markets have a higher influence on current conditional volatility, in its market.
In the case of Canada, Italy, France, and Japan, the significance of GJR-GARCH specifies that the negative shocks have a higher magnitude in its respective markets; the statistical values for stock markets are 0.30, 0.17, 0.41, and 0.15 for Canada, Italy, France, and Japan, respectively, whereas; the GJR-GARCH coefficients for Canada, Italy, France, and Japan are 0.095, 0.084, 0.18, and 0.09, respectively. Moreover, the parameters of FIGARCH indicate the intermediate range of persistence for Canada, Italy, France, and Japan. The FIEGARCH estimations also support the results of FIGARCH that the volatility in stock markets and oil market has an intermediate range of persistence. However, the results of Canada, Italy, France, and Japan represent that the negative shock in stock and oil market answer back more powerfully in its market than positive shocks. Also, in Canada and Italy, this magnitude is higher in stock markets as compared with the oil markets. Despite this, the results of France and Japan report that the adverse shocks have a higher influence on oil markets than stock markets.
The aforementioned results show that G7 markets hold an asymmetric effect. The findings for United States, United Kingdom, Germany, Canada, and Italy confirm that the magnitude of negative shocks is higher in stock markets than the oil market. While France and Japan indicate contradicting results, the negative shocks have a higher influence on conditional volatility of the oil market than the stock market. Moreover, FIGARCH and FIEGARCH report the evidence of an intermediate range of volatility persistence in all G7 stock markets.
Portfolio Analysis
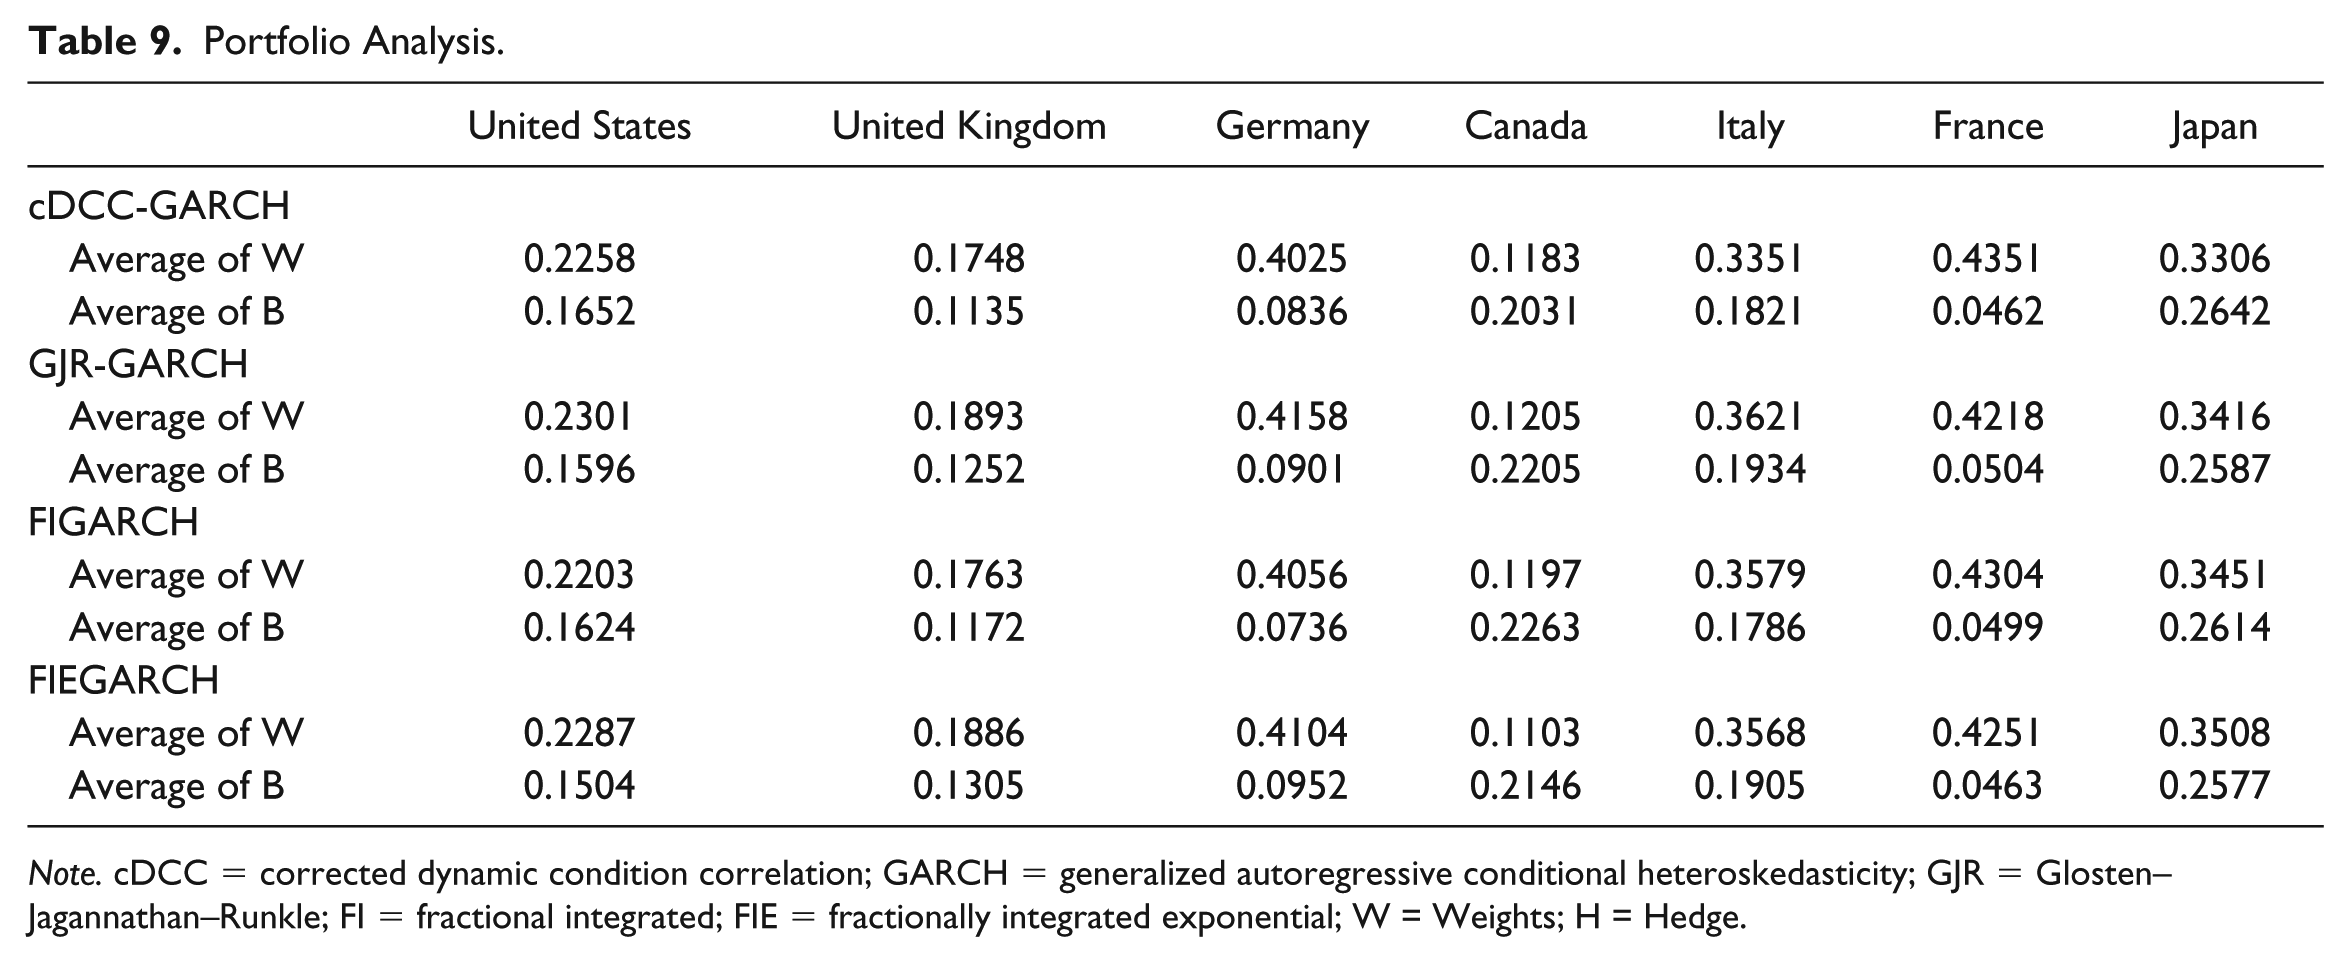
Table 9 reports the results of portfolio weights and hedge ratios. The series of cDCC-GARCH shows the optimal weight for the United States is 0.2258 which demonstrates that the US investors can form an optimal portfolio by using 20 cents to buy oil assets out of US$1. The asymmetric series provide similar findings; the statistical values of optimal weights under GJR-GARCH, FIGARCH, and FIEGARCH are 0.2301, 0.2203, and 0.2287, respectively. After optimal weights, we emphasize on hedge ratio that assistance to take a long or short position for oil/stock assets. The result of hedge suggests that the US investors should sell (short position) oil assets of US$1 and buy US stock assets for 16.52 cents. Asymmetric series also presents parallel results with slightly different values; the values of hedge ratios are 0.1596, 0.1624, and 0.1504 for GJR-GARCH, FIGARCH, and FIEGARCH, respectively.
Portfolio Analysis.
Note. cDCC = corrected dynamic condition correlation; GARCH = generalized autoregressive conditional heteroskedasticity; GJR = Glosten–Jagannathan–Runkle; FI = fractional integrated; FIE = fractionally integrated exponential; W = Weights; H = Hedge.
In case of United Kingdom, the symmetric series for cDCC-GARCH presents that the optimal weight and hedge ratio are 0.1748 and 0.1135, respectively. The optimal weight suggests that the investors in the UK market should spend 17.48 cents to buy oil assets out of US$1. Whereas, the hedge ratio indicates that the investors in the UK stock market should take a short position in oil assets and the extended position of 11.35 cents in UK stock assets. Asymmetric series also offers similar results for optimal portfolio weights and hedge ratios. For the German stock market, the optimal weight is 0.4025 which indicates that the German investors should spend 40.25 cents on oil assets out of US$1. The hedge ratio suggests that investor should take a short position in the oil and a long position of 8.36 cents in German stocks. In the case of the Canadian stock market, the optimal weight and hedge ratio are 0.1183 and 0.2031, respectively. For Italy, the optimal portfolio weight and hedge ratio are 0.3351 and 0.1821, respectively. The results of France are 0.4351 and 0.0462 for optimal weight and hedge ratio, respectively. For the Japanese stock market, the optimal weight is 0.3306 and hedge ratio is 0.2642. Asymmetric series reports the marginally different findings for optimal weights and hedge ratios.
The overall findings of optimal weights and hedge ratios establish the importance of oil assets to minimize the portfolio risk for G7 countries. Especially, the weighted average for Japan, Italy, Germany, and France are 0.3306, 0.3351, 0.4025, and 0.4351, respectively, which suggests that oil assets are more important for the investors in Japan, Italy, Germany, and France. The closer look at hedge ratios for G7 countries also endorse that oil assets are significant to hedge portfolio risk. In a nutshell, average weights and hedge ratios report that investors and portfolio managers should choose oil assets as well as stock assets to minimize the risk without changing the expected returns.
Conclusion
This study attempts to investigate the symmetric and asymmetric volatility spillover among stock and oil assets and portfolio optimization for G7 countries. For symmetric analysis, we use DCC and cDCC approaches, whereas GJR, FIGARCH, and FIEGARCH are utilized for asymmetric estimations. Later, the conditional variance series and conditional covariance series are used for average weights and hedge ratios. Kroner and Ng (1998) and Kroner and Sultan (1993) methodologies are used for optimal weights and hedge ratios, respectively. This empirical study attempts to examine the role of oil assets for portfolio optimization.
The symmetric and asymmetric estimations provide evidence of interdependence among the oil market and G7 stock markets. However, current conditional volatility of all the stock markets responded to the past news and lagged conditional volatility in its respective stock markets. United States, Germany, Canada, Italy, and France report the insignificant impact of lagged volatility on current conditional volatility in oil markets. The findings further confirm that conditional volatility for oil market in case of the United States, United Kingdom, and Japan is not affected by the lagged conditional volatility in oil markets. The important point to note is that G7 stock markets are more sensitive to their lagged news and volatility.
More detailed asymmetric estimations, FIGARCH and FIEGARCH, show that oil markets and G7 stock markets present an intermediate range of persistence of volatility. While focusing on our key objective of the study, the weighted average and hedge ratios provide the evidence that oil assets play significant importance to hedge the portfolio risk without minimizing the expected returns. Consequently, investors and portfolio managers in G7 countries should take oil assets to optimize portfolio risk. For further research, the study can be divided according to the precrisis, during crisis and postcrisis period to better understand the role of oil as assets. Future research can investigate the volatility spillover among stock, oil assets, gold asset, and portfolio optimization.
Footnotes
Declaration of Conflicting Interests
The author(s) declared no potential conflicts of interest with respect to the research, authorship, and/or publication of this article.
Funding
The author(s) received no financial support for the research, authorship, and/or publication of this article.