
Abstract
The factor structure of the Stress Mindset Measure (SMM), an 8-item questionnaire, has been explored in several countries, showing inconsistent results. This study aimed to examine the psychometric properties of the SMM with a Korean sample. A total of 912 participants completed the online survey (women = 59.3%) at T1, and a random subsample selected from T1 sample (n = 259, women = 62.9%) participated in the survey again at T2. At both time points, the results of confirmatory factor analyses supported a three-factor hierarchical model with three lower-order factors (i.e., learning and growth, performance and productivity, and health and vitality) and one higher-order general factor with correlated errors among three negatively worded items. In the model, 2 items measuring the “general” domain were deleted based on high correlations with the higher-order factor. Longitudinal factor analysis revealed that the revised factor structure and loadings were invariant over 6-month period. Theoretical validity was supported through significant correlations between the total score of the 6-item SMM and other stress-related measures. Overall, our results indicate that the Korean version of the SMM is a valid instrument and suggest using a total score of 6 items.
Introduction
Stress is a state of homeostasis being challenged (Lu et al., 2021). It is believed that stress has inherent negative influences on physical and mental health as well as performance (e.g., McEwen & Seeman, 1999; Mroczek & Almeida, 2004). Therefore, stress researchers have focused on effects of stress and how to deal with stress. For instance, Cohen et al. (1983) widely used Perceived Stress Scale implied that stress had negative connotations. The scale asks respondents the degree to which they perceive their lives to be burdensome, out of control, and uncertain (Cohen et al., 1983). A variety of researchers have examined how people cope with stressful situations (e.g., Folkman & Lazarus, 1980). In contrast, several studies have demonstrated that some can experience benefits from stressful experiences (Schneiderman et al., 2005). Specifically, stress was linked to positive outcomes like personal initiative (Fay & Sonnentag, 2002) and health (Quick et al., 2014). Accordingly, a stress belief started to receive attention as a factor that changes the influences of stress.
Crum et al. (2013) adopted the concepts of mindset to stress based on mindsets in a realm of intelligence (Dweck et al., 1995) and aging (Levy et al., 2002). Stress mindset refers to how one evaluates the nature of stress, whether stress has enhancing or debilitating consequences (Crum et al., 2013). Stress-is-enhancing mindset is about the tendency to evaluate stress has enhancing effects while stress-is-debilitating mindset is about the tendency to perceive stress has debilitating effects (Jamieson et al., 2018). In Crum et al., (2013), stress mindset was distinguished from relevant variables including amount of stress, stress appraisals, and coping. Moreover, stress mindset had significant influence on psychological symptoms, work performance, and life satisfaction over and above coping and amount of stress (Crum et al., 2013). In addition, studies suggested that stress mindsets can be changed by rather a simple intervention such as watching video clips and that having a stress-is-enhancing mindset produced positive changes in psychological symptoms, work performance, and growth hormones (Crum et al., 2013, 2017). Huebschmann and Sheets (2020) also demonstrated that having a stress-is-enhancing mindset mitigated the negative effects of perceived stress on depressive symptoms and anxiety. In a study with Navy SEAL candidates (Smith et al., 2020), having an enhancing mindset predicted better performance and evaluations of peers and instructors.
To assess the stress mindset, Crum et al. (2013) developed and validated the Stress Mindset Measure (SMM), a self-report, 8-item instrument. Crum et al. (2013) generated items through a focus group in the four domains (i.e., learning and growth, performance and productivity, health and vitality, and uncertainty and change). Then, the scale was administered to three pilot samples. As the result, 2 items for uncertainty and change domain were deleted for internal consistency, leaving 8 items. The final items measure the consequences of stress in general (2 items) and across three domains (i.e., learning and growth, performance and productivity, and health and vitality; 2 items each for a domain). Stress mindset scores were calculated by reversing the four negative items which represent stress-is-debilitating mindset and taking the mean of 8 items. It implied that the scale is unidimensional having stress-is-debilitating mindset on the opposite of stress-is-enhancing mindset. Confirmatory factor analysis supported this unifactorial structure (Crum et al., 2013).
However, the unidimensional structure of the SMM has not been replicated in other countries. Iwamoto et al. (2020) and Karampas et al. (2020) tested two models, a one-factor model and a two-factor model, with Japanese and Greek samples respectively. A two-factor model, with four reversed items loaded on the stress-is-debilitating factor and four positive items loaded on the stress-is-enhancing factor, showed a better model fit in both studies (Iwamoto et al., 2020; Karampas et al., 2020). Iwamoto et al. (2020) and Karampas et al. (2020) suggested that there are two distinct stress mindsets and that the four negatively worded items to measure the stress-is-debilitating mindset could harm unidimensionality. Vigil-Colet et al. (2020) recommended controlling for response bias when positively and negatively worded items are included in the same measure.
In contrast, a study with a Polish population reported unsatisfactory model fits for both one- and two-factor models (Mierzejewska-Floreani et al., 2022). Mierzejewska-Floreani et al. (2022) further tested four-factor model, bi-factor model, and hierarchical model across two studies. The results supported a four-factor hierarchical model with four lower-order factors (i.e., general, learning and growth, performance and productivity, and health and vitality). The structure was also confirmed in test-retest sample after 10 months. Nevertheless, Mierzejewska-Floreani et al. (2022) questioned the equal property of the general lower-order factor to other three lower-order factors given that the contents of 2 items for the general factor were unspecified (e.g., “The effects of stress are negative and should be avoided.”).
In South Korea, Park (2022) has recently examined the factor structure of the SMM. The study (Park, 2022) reported that the one-factor structure, two-factor structure, and two-factor models considering method effects showed unsatisfactory fits. Instead, Park (2022) found adequate fits for a model with four negatively worded items and a model with four positively worded items. Thus, Park (2022) suggested to use a measure consisting of four negative items which showed superior fits to a model consisting of four positive items. Although it was the first study to investigate the psychometric properties of the SMM in a Korean sample, it was not free from limitations. Park (2022) interpreted the results to reflect the independence between the negative perception of stress and the positive perception of stress. However, in the two factor model, the negative perception construct and the positive perception construct showed a high correlation (r = 0.86, p < .001), questioning the independent nature of the relationships. Assuming the independence between the debilitating and enhancing mindset is conflicting with Crum et al. (2013)’s unidimensional suggestion and other studies’ moderate to high correlations between the factors. The correlation between the two factors were −51 (p < .001) in Karampas et al. (2020) and −41 to −0.60 (p < .01) in Iwamoto et al. (2020). In addition, to suggest that the negative perception and the positive perception are different to be included in one measure, the properties of two constructs need to be explained theoretically and empirically. Yet, the only variable included to test the validity, perceived stress, showed negative correlations with both the negative and the positive perception (Park, 2022), limited to indicate contrasting characteristics of the two. Therefore, more work is still needed to elucidate the psychometric properties of the Korean version of the SMM.
Together, despite the researchers’ efforts to validate the SMM, the results of the factor analysis were divergent. The current study conducted confirmatory factor analysis (CFA) to compare different models supported by prior studies. To date, researchers have investigated the SMM with community samples (e.g., Karampas et al., 2020; Mierzejewska-Floreani et al., 2022). Although Iwamoto et al. (2020) and Park (2022) included undergraduate students in their samples, the current study aimed to investigate emerging adults’ stress belief including undergraduate students but not limited to them. Emerging adulthood is characterized by instability as emerging adults have not yet made long-term decisions in relationships and work (Arnett et al., 2014). While emerging adulthood has been typically defined as the period between 18 and 29 years of age, some developmental researchers postulated that there are variations in the upper age limit of the developmental phases closely related to social role transitions (e.g., adolescence, emerging adulthood) across different countries and cultures because the timing of role transitions has been delayed to varying degrees (e.g., Sawyer et al., 2018). This is also the case for emerging adulthood in South Korea. For instance, South Korean emerging adults who go to 4-year college choose to delay graduation because of high youth unemployment rate (Yi, 2019), and the average age for the first marriage is increasing which reached 33.4 for men and 31.1 for women in 2021 (Statistics Korea, 2022). Such circumstances can prolong instability and pile up stress emerging adults experience. In fact, transitions during emerging adulthood predicted greater stress, physical health symptoms (Barlett et al., 2020), and low life satisfaction (Lane et al., 2017). Stress mindset during the period can be a protective factor against stressors. The present study sought to establish measurement invariance across three groups depending on emerging adults’ status (i.e., students, job seekers, and employees). Therefore, the present study included emerging adults who were engaged in different activities including undergraduate students and graduates who started working full-time and were hunting for jobs. The proposed model was tested again with a random subsample after 6 months in order to test longitudinal stability of the factor structure, because no other study has investigated the factorial stability across time while only Crum et al. (2013) reported the test-retest reliability of the total SMM scores (time interval of 2–3 days). Convergent and discriminant validity were also examined through the associations of the stress mindset with perceived stress, life satisfaction, depressive symptoms, and dispositional emotion regulation.
Method
Participants
A total of 912 South Korean young adults, recruited via online advertisements on social media communities, completed an online questionnaire. Their age ranged from 18 to 32 years (M = 24.2, SD = 2.4), and 541 were women (59.3%). Only those who provided consent for voluntary participation were included in the study. Among the participants, 117 (12.8%) were working currently, 310 (34.0%) were seeking employment, and 483 (53.0%) were studying. A random subsample (N = 300, approximately a third of the original sample) was selected from the initial sample and invited to answer the follow-up questionnaire 6 months after the first measurement. The purpose of collecting the follow-up data from this smaller random subsample was to analyze the factorial stability of SMM. A total of 259 adults (women = 62.9%; employed = 28.2%; seeking employment = 32.8%; students = 39.0%) responded to the invitation and completed the follow-up questionnaire, which comprised the SMM and other stress-related measures. Participants were given gift cards worth USD 4.00 at T1 and USD 8.00 at T2. The study protocol was approved by the Institutional Review Board of the university to which the corresponding author was affiliated.
Measures
Stress mindset
We administered the Korean version of the SMM-General (Crum et al., 2013) used in Kim (2020). Kim (2020) and a native English-speaking graduate student translated and back-translated the original measure into Korean, with an assistance of one of the authors who is fluent in both Korean and English, to establish its cross-cultural semantic equivalence. On a scale from 0 (strongly disagree) to 4 (strongly agree), participants rated the extent to which they agreed with statements about stress (see Table 1), covering four different domains: general, learning and growth, performance and productivity, and health and vitality. Four negatively worded items were reverse-coded, where a higher score represented a stress-is-enhancing mindset. Crum et al. (2013) demonstrated that the measure exhibited good criterion validity and internal consistency (Cronbach’s alpha .86). Kim (2020) also reported good internal consistency of 8 items (Cronbach’s alpha .80). In the current study, Cronbach’s alpha was .84 for the full sample at T1 and .87 for the retest subsample at T2.
Stress Mindset Measure (SMM) Domains and Items.

Perceived stress
The Korean version of the Perceived Stress Scale (Cohen et al., 1983; Park & Seo, 2010) was used. The participants rated 10 items related to stress (e.g., “How often have you felt nervous and stressed?”) from 0 (not at all) to 4 (very frequently). Park and Seo (2010) reported that the scale is best represented using two subscales—negative perception and lack of positive perception, with Cronbach’s alphas of .76 and .75, respectively. In the current study, the alpha coefficient was .83 for the whole scale, .84 for negative perception, and .82 for lack of positive perception.
Life satisfaction
To measure life satisfaction, we used 5 items from the Korean version of the Satisfaction with Life Scale (Diener et al., 1985; Ryu, 1996). Questions such as “So far I have gotten the important things I want in life” were rated from 1 (strongly disagree) to 7 (strongly agree). The alpha coefficient was .81 in Ryu’s (1996) study and .85 in this study.
Depressive symptoms
Depressive symptoms were measured using the 11-item Korean short version of the Center for Epidemiologic Studies Depression Scale (CES-D; Hoe et al., 2015). Although there is ongoing debate regarding its factor structure, the CES-D short version is thought to measure four symptoms: depressive affect, positive affect, somatic symptoms, and interpersonal difficulties (Shafer, 2006). A recent study (Shin et al., 2017) concluded that the scale is best represented using a bifactor model with a strong general factor, suggesting adequate unidimensionality. In the current study, the reliability coefficient was .91 for all 11 items.
Dispositional emotion regulation
The Korean version of the Emotion Regulation Questionnaire (Shon, 2005) was used to measure reappraisal and suppression. The original scale, developed by Gross and John (2003), includes subscales for reappraisal (6 items; e.g., “When I’m faced with a stressful situation, I make myself think about it in a way that helps me stay calm”) and expressive suppression (4 items; e.g., “I keep my emotions to myself”). Respondents rated the items on a 7-point Likert scale ranging from 1 (strongly disagree) to 7 (strongly agree). Cronbach α was .85 for reappraisal and .73 for suppression in Shon’s (2005) study, and .84 for reappraisal and .75 for suppression in this study.
Data Analysis
Statistical analyses were performed using the R programming language (version 4.1.4), with psych (Revelle, 2022) and lavaan (Rosseel, 2012) packages. Models with different latent factor structures were tested using data collected at T1: a single-factor (Crum et al., 2013), a two-factor (Iwamoto et al., 2020; Karampas et al., 2020), and correlated and hierarchical four-factor models (Mierzejewska-Floreani et al., 2022). Throughout model testing, correlated errors among the negatively worded items were allowed to incorporate the wording effect (Hayduk & Littvay, 2012). The model-testing procedure was repeated with the re-test sample data collected at T2. Next, the cross-sectional factor models for the subsample (collected at both T1 and T2) are combined to establish longitudinal factor analysis model to evaluate the stability of the latent factor structure. To guarantee that the general factor is the same across different time points, we tested the measurement invariance by constraining the factor loadings to be equal (i.e., metric invariance; see Chen et al., 2005). The longitudinal stability of the latent factors was evaluated by the correlation coefficient between the same latent factors across the two time points. After establishing the factorial structure, correlations between SMM and other stress-related variables were examined using T2 data.
Since the analyses primarily involves with fitting and comparing different models using the maximum-likelihood (ML) estimation, model fits were evaluated adopting a series of indices that are known to perform well with ML estimation: The Tucker–Lewis Index (TLI; values ≥ 0.90 for acceptable fit), comparative fit index (CFI; values ≥ 0.90 for acceptable fit), and root mean square error of approximation (RMSEA; values ≤ 0.08 for acceptable fit) (Browne & Cudeck, 1993; Hu & Bentler, 1999).
Results
Preliminary Analysis
Descriptive data analyses were conducted before investigating the factor structure of SMM and presented at Table 2. Items of the SMM showed positive correlation with each other. It was notable that items with different wording (positively- vs. negatively-worded) displayed a somewhat distinctive correlational pattern. To be specific, negatively-worded items (Item 1, 3, 5, 7) showed greater correlations with each other than with positively-worded items (Item 2, 4, 6, 8). This implied that a possible method effect based on the item wording would be inherent in SMM. Items assessing stress-related belief in “learning and growth” domain (Item 2, 5) showed the highest mean scores, while those assessing belief in “health and vitality” domain (Item 3, 6) showed the lowest mean scores. Skewness and Kurtosis statistics suggested that the data distributions were sufficiently normal.
Correlations and Descriptive Statistics of the SMM Items at T1 (N = 912) and T2 (N = 259).
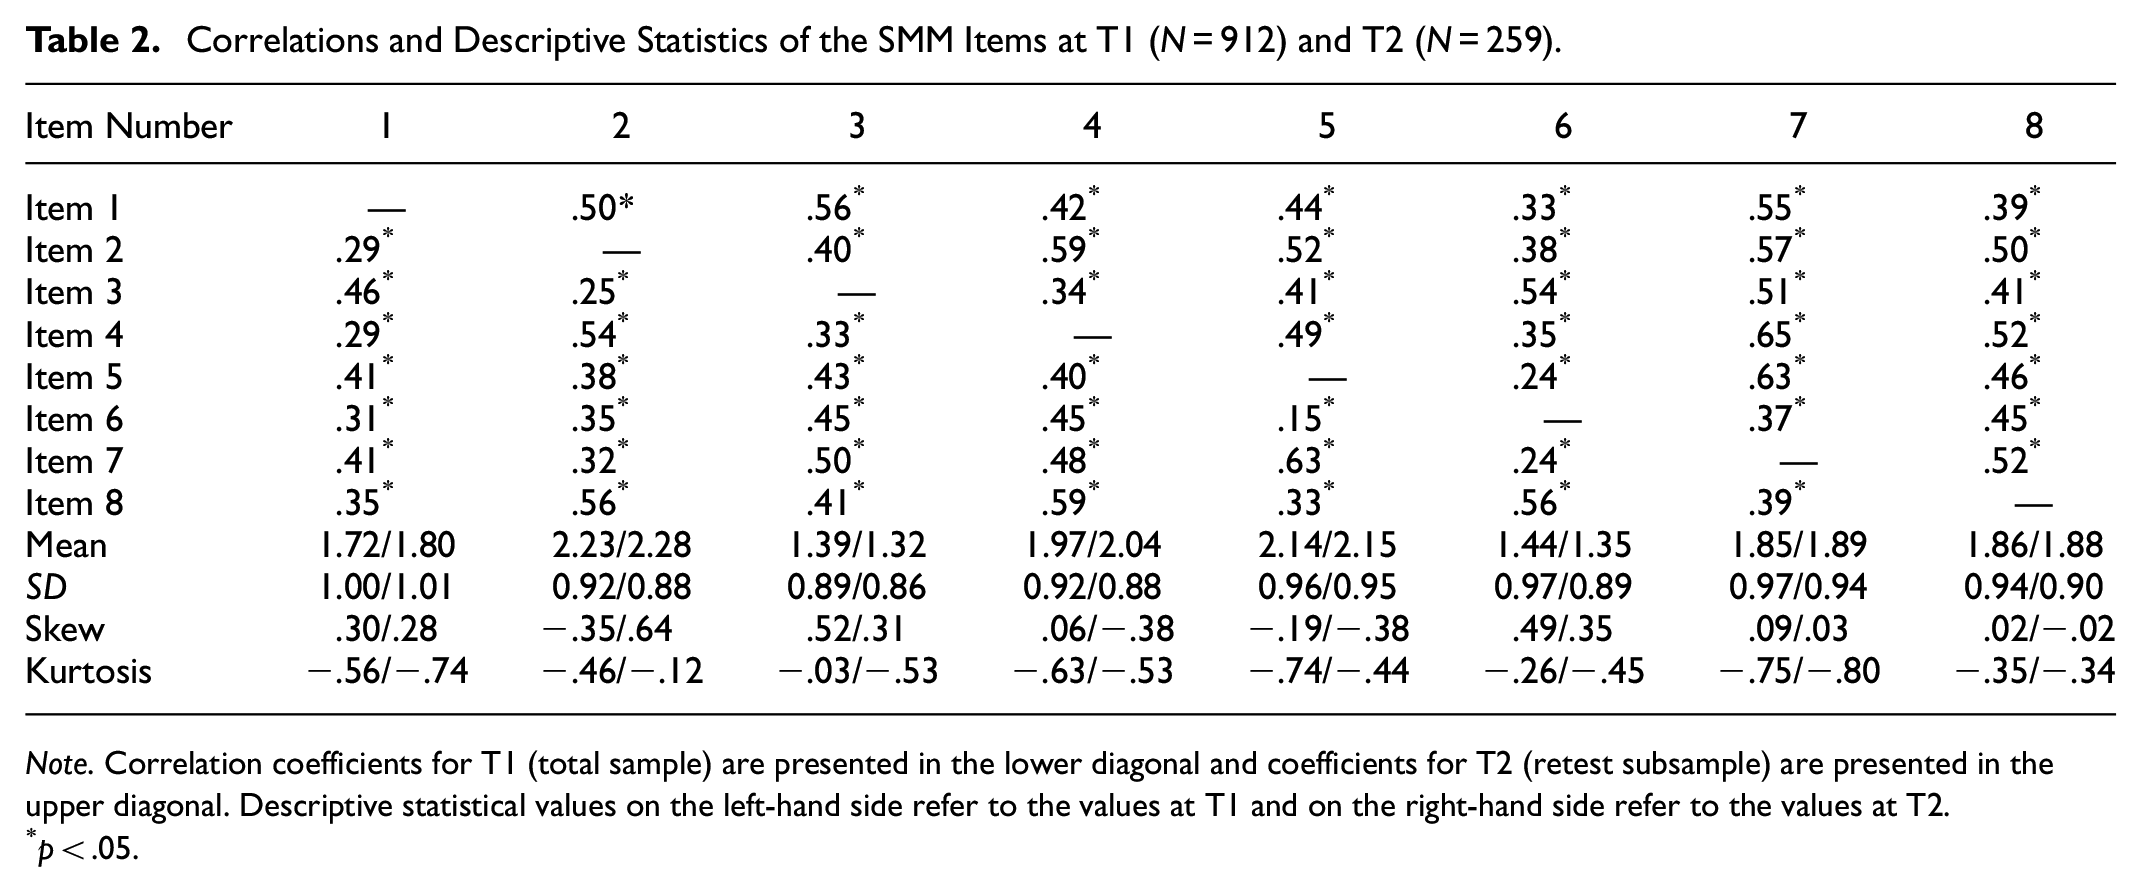
Note. Correlation coefficients for T1 (total sample) are presented in the lower diagonal and coefficients for T2 (retest subsample) are presented in the upper diagonal. Descriptive statistical values on the left-hand side refer to the values at T1 and on the right-hand side refer to the values at T2.
p < .05.
Confirmatory Factor Analysis
CFA was applied to four models: single-, two-, four-, and hierarchical four-factor models. Both the single-factor and two-factor models with enhancing mindset (four positively worded items) and debilitating mindset (four negatively worded items) showed poor fit indices. The four-factor model, which comprised learning and growth, performance and productivity, health and vitality, and general factors, showed acceptable fit. In this model, the four subscales were highly correlated with each other; hence, the hierarchical model was tested. However, the analysis of the hierarchical model, with one second-order factor (i.e., general stress mindset) and four first-order factors, resulted in inadmissible estimates (Chen et al., 2001). The correlation between the higher-order factor and lower-order “general” factor exceeded 1.0 (r = 1.03); therefore, the residual variance of the “general” lower-order factor was negative (−0.68). This indicated a possibility that the higher-order factor and lower-order “general” factor overlapped conceptually, resulting in model redundancy. As a result, the hierarchical model was revised by deleting 2 items for the “general” lower-order factor and retaining three lower-order factors. The revised hierarchical model showed an acceptable fit (RMSEA = 0.063, CFI = 0.994, TLI = 0.969).
The same procedure was repeated for subsample data at T2. This four-factor hierarchical model analysis also resulted in uninterpretable estimates (i.e., correlations between lower-order “general” factors and higher-order factors exceeding 1.0). The revised hierarchical model met the goodness-of-fit index criteria (RMSEA = 0.049, CFI = 0.997, TLI = 0.985) and produced interpretable estimates. Based on the theoretical proposition that the stress mindset is a unidimensional construct (Crum et al., 2013) and the current statistical findings, the revised hierarchical model containing 6 items—three first-order factors representing specific domains (learning and growth, performance and productivity, and health and vitality) and one overarching second-order factor—was considered the best model representing the factor structure of the SMM (see Figure 1). A summary of the model fit comparisons is presented in Table 3.

The revised CFA model (total sample at T1, N = 912).
Results of Cross-Sectional CFA for the Korean Version of SMM at T1 and T2.
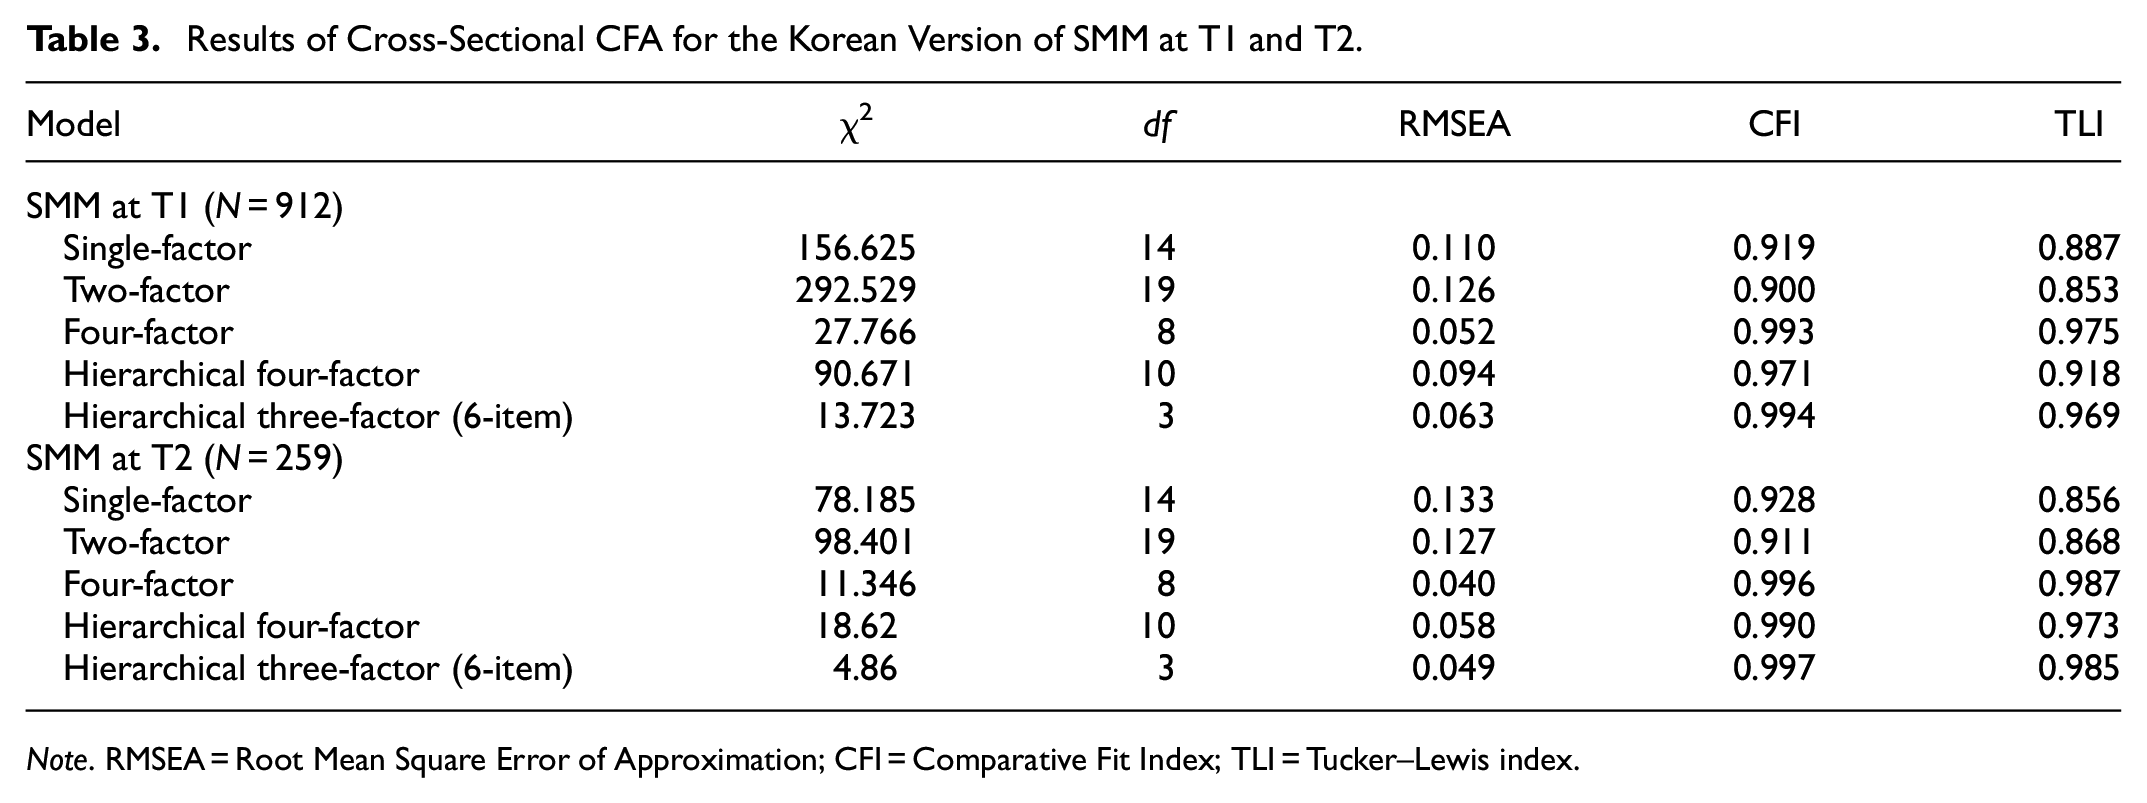
Note. RMSEA = Root Mean Square Error of Approximation; CFI = Comparative Fit Index; TLI = Tucker–Lewis index.
As a next step, the subsample data collected at both T1 and T2 was combined to establish a longitudinal factor analysis model in order to investigate the factorial stability of SMM. The longitudinal measurement invariance of the best fitting model emerged in cross-sectional CFAs was tested (Table 4). The configural invariance model, in which all parameters were freely estimated except for the minimum constraints for identification, showed an acceptable fit (RMSEA = 0.082, CFI = 0.954, TLI = 0.915). The metric invariance model in which factor loadings were constrained to be equal across the two time points showed no worse fit than the configural invariance model, Δχ2(6) = 5.34, RMSEA = 0.075, CFI = 0.954, TLI = 0.928, suggesting that the latent constructs was measured by the same measurement units across different time (Chen et al., 2005). The stability coefficient between the second-order stress mindset factors was 0.59 (Figure 2).
Results of Longitudinal CFA for the Hierarchical Three-Factor Model (Retest Subsample, N = 259).


The longitudinal CFA model (retest subsample, N = 259).
Concurrent and Discriminant Validity
To test the theoretical validity of the Korean version of the SMM, a correlation analysis was carried out with the total score of 6 items of the SMM and other stress-related measures at T2: life satisfaction, perceived stress (total score, negative experience, and lack of positive experience), depressive symptoms, reappraisal, and suppression. SMM was significantly related to stress-related outcome variables. Specifically, as shown in Table 5, SMM exhibited a positive relationship with life satisfaction (r = 0.25), while showing negative relationships with perceived stress (total score: r = −0.29; negative perception: r = −0.25; and lack of positive perception: r = −0.23) and depressive symptoms (r = −0.22). In addition, SMM was significantly related to emotion-regulatory behaviors. SMM was positively related to reappraisal (r = 0.29) and negatively related to suppression (r = −0.11, p < 0.10).
Correlation Coefficients Between Total Score of SMM and Other Related Variables at T2.
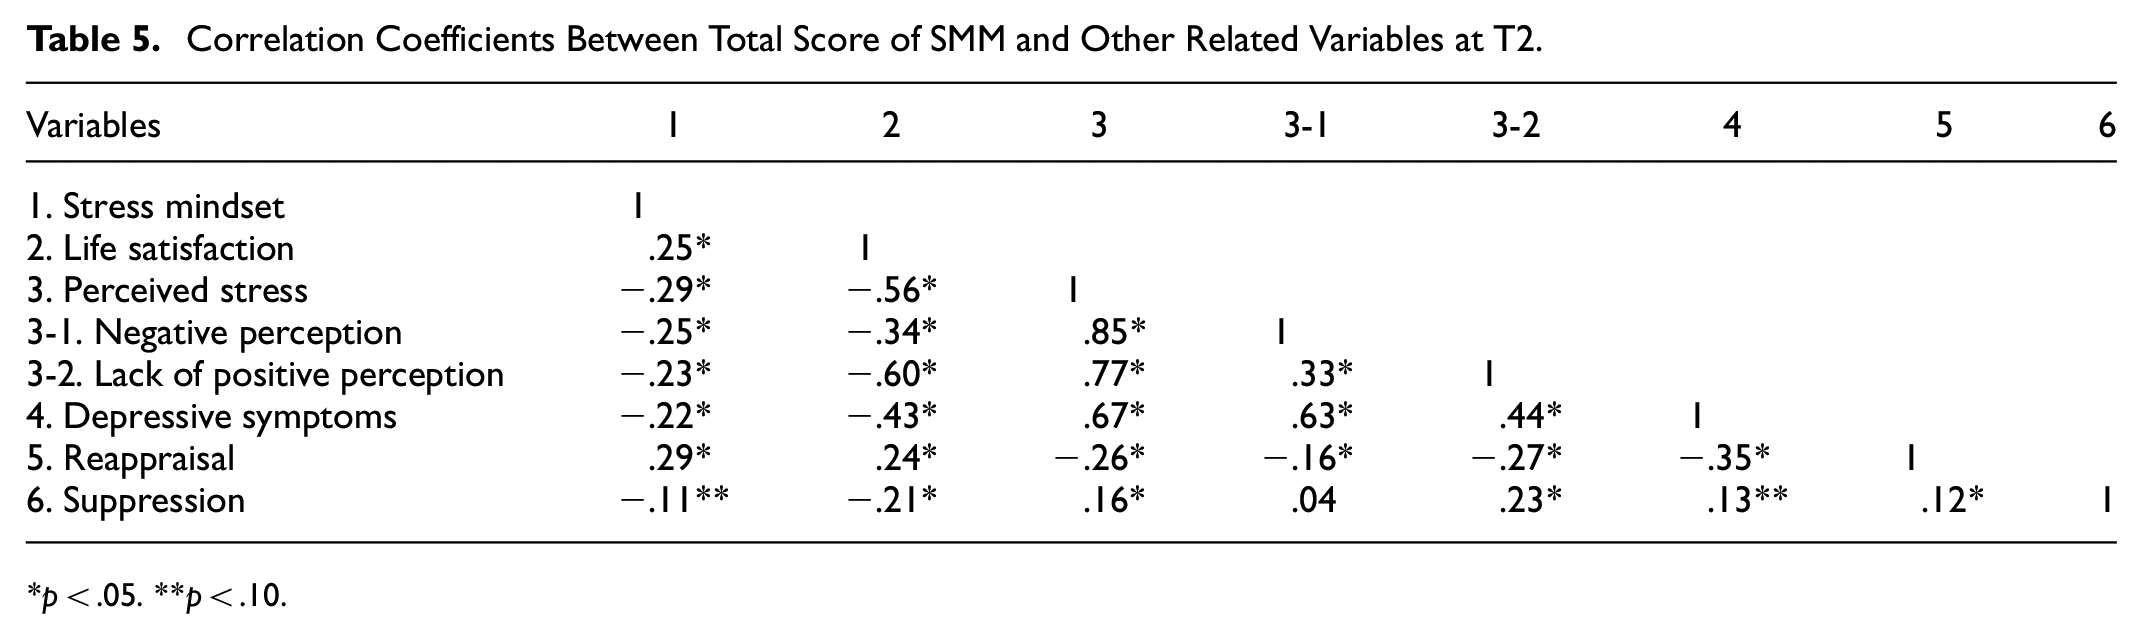
p < .05. **p < .10.
Discussion
This study aimed to examine the psychometric properties and factorial structure of the Korean version of the SMM. The original one-factor structure that emerged in a sample of adults in the United States (Crum et al., 2013), the two-factor structure that emerged in a sample with Japanese adults (Iwamoto et al., 2020), and the hierarchical four-factor structure from the study with Polish adults (Mierzejewska-Floreani et al., 2022) were not replicated. Instead, the results suggest that the Korean version of the SMM is best represented by a hierarchical three-factor structure with 6 items representing three domains of stress (i.e., learning and growth, performance and productivity, and health and vitality). Two items from the original measure, representing the “general” stress mindset, were excluded because of multicollinearity. By using the data collected from retest subsample, longitudinal metric invariance for the hierarchical three-factor structure was established across two measurement time points with 6-month intervals, and the higher-order factor showed a reasonable stability over the same time period. The establishment of a higher-order structure serves as the basis for using the total score to represent one’s belief regarding the effects of stress (Sellbom & Tellegen, 2019).
The total SMM score, calculated based on the revised model, showed significant relationships with other stress-related variables. The SMM was positively related to life satisfaction and negatively related to perceived stress and depressive symptoms. Interestingly, the SMM was significantly related to reappraisal, which differed from Crum et al.’s (2013) proposition that the stress mindset is theoretically distinct from stress (re)appraisal, as appraisal of stress is related to the evaluation of a particular stressor (i.e., situation-level), whereas stress mindset is related to the evaluation of the nature of stress itself (i.e., meta-level). Although researchers later acknowledged a common theme underlying the two constructs and proposed an integrated model (Hagger et al., 2020; Jamieson et al., 2018), the possible dynamics of appraisal and stress mindset across situations have not yet been well studied. Further research that captures the dynamic nature of appraisal and stress mindsets across diverse situations and populations is needed.
The findings of this study question the utility of the 2 items evaluating a “general” domain stress mindset (e.g., “The effects of stress are negative and should be avoided”). As Crum et al. (2013) conceptualized, stress mindset refers to “the extent to which one holds the belief that stress has enhancing [or debilitating] consequences for various stress-related outcomes such as performance and productivity, health and wellbeing, and learning and growth” (p. 716). Hence, the mean or average score on the SMM should represent one’s overall belief regarding the effects of stress across different domains. The 2 items are related to the general consequences of stress, while the other 6 items are specifically related to the domains of an individual’s functioning affected by stress. The meaning of the two “general” items would be redundant considering the meaning of the overall stress mindset derived from interrelationships or covariances among the 6 items representing specific domains of functioning. Mierzejewska-Floreani et al. (2022) established a hierarchical four-factor structure; however, their estimated model also produced a correlation close to 1 between the second-order stress mindset factor and first-order “general” factor (.94/.96). They also questioned the meaning of the “general” subscale, but determined that the items should be retained, positing that the subscale may represent an unspecified domain factor rather than an overall belief factor.
Throughout the CFAs, we incorporated shared method variance across negatively worded items (Items 1, 3, 5, and 7). The systematic method variance is beyond what is accounted for by the respective latent factors (Hayduk & Littvay, 2012); therefore, it should be considered when establishing a measurement model. Although Iwamoto et al.’s (2020) solution, which was to construct two separate latent factors with positively and negatively worded items, is one of the ways to integrate the wording effect into the measurement model (e.g., Martín-Albo et al., 2007), it may be merely a nuisance grouping of items rather than a representation of substantive latent constructs, resulting in relatively meaningless factors (McKay et al., 2014; Reise et al., 2010). The CFA results in this study favored the hierarchical model over the two-factor model, supporting the application of correlated errors instead of the introduction of separate factors to incorporate the wording effect into the measurement model. This also supports the conceptualization that the stress mindset is a spectrum between enhancing and debilitating mindsets rather than two opposing beliefs functioning in parallel (Crum et al., 2013; Keech et al., 2021). While Park (2022)’s results suggested that the use of only four negatively- or positively-worded items (i.e., measuring either debilitating or enhancing mindset) would be an alternative of applying the full SMM items, this approach may force researchers to separate one mindset from the other, disregarding the initial concept of stress mindset. Therefore, measuring both types of mindsets with consideration for the wording effect as the current findings suggested, rather than splitting the measure into two, would be recommendable.
The current study has some limitations. First, only the SMM was measured twice, while the other variables were measured once at T2. Therefore, the temporal relationships between the variables were not testable. Second, the current study only included self-rated measures, relying on retrospective recall of stress-related responses and outcomes. Future research could benefit from behavioral or psychophysiological measures to investigate the predictive efficacy of the SMM. Third, this study could not investigate the incremental validity of the SMM over other scales designed to measure stress beliefs, such as the Beliefs About Stress Scale (Laferton et al., 2018) and Stress Control Mindset Measure (Keech et al., 2021). Although other measures also did not address all domains or facets of stress and related beliefs (Kilby et al., 2020, 2021), exploring the relative utility of these scales may inform researchers in this field.
Nevertheless, the current findings suggest that the SMM is a valid measure to capture the stress mindset construct among the early adult population, but may require some revision. In this study, the rationale for removing some items (i.e., items 1 and 8) was that they were redundant both theoretically and psychometrically. To the best of our knowledge, this is the first study to suggest the need for a revision of the SMM. Therefore, researchers should be cautious while adapting our findings to their population of interest and are encouraged to further examine the factor structure of the SMM.
Footnotes
Declaration of Conflicting Interests
The author(s) declared no potential conflicts of interest with respect to the research, authorship, and/or publication of this article.
Funding
The author(s) disclosed receipt of the following financial support for the research, authorship, and/or publication of this article: This work was supported by the Ministry of Education of the Republic of Korea, the National Research Foundation of Korea (NRF-2020S1A5A2A01043871), and the Korea University Grant.
Data Accessibility statement
Data will be provided upon the request to the corresponding author.