
Abstract
This study involved a systematic literature review using bibliometric analysis to examine the evolution and current trends of Markov switching studies. The bibliometric analysis was used for the descriptive, intellectual, social, and conceptual network analyses, while systematic reviews were used to identify the application of the Markov switching model. A total of 449 articles were selected and extracted from the Web of Science (WoS) between 1992 and 2021. The publication trends, most influential countries and articles, leading journals, collaboration networks, research hotspots, research fronts, coupling networks, and application of the model in various disciplines were described. This study summarized the research agenda of the Markov switching field, which would be helpful for researchers and funding agencies.
Introduction
The 21st century is marked by the prodigious flow of data mainly via advances in technology (Giannakis et al., 2019). Statistical techniques are now imperative to the decision-making process (Sandri et al., 2020) via an extensive series of data analyses encompassing big data analytics. As a result, plenty-of-time series models were developed, such as the autoregressive (AR) model, moving average (MA) model, and the combination of methods autoregressive and moving average (ARMA) model to analyze economic and financial data. These linear time series models have gained popularity in various fields, such as econometrics (Frazier & Koo, 2021; Inekwe et al., 2019) and health (Xie & Djurdjanovic, 2021). However, these approaches cannot capture the nonlinear dynamic patterns of financial time series variables (Korley & Giouvris, 2021), which prompted the shift toward regime-switching models. Switching models can address the weakness of linear models by capturing the asymmetry of economic data (Ozdemir, 2019).
The Markovian switching mechanism was reported in the Journal of Econometrics by Goldfeld and Quandt (1973), accounting for the discrete system changes. The Markov switching model gained attention when Hamilton (1989) reported the economic analysis of nonlinear time series and parametric changes of an autoregressive. The Markov switching model is a combination time series model of both the Markov chain and regime-switching model that introduces time variation in the parameter of state-specific values. All of the parameters allow the shift between high volatility and low volatility regimes in the model concurrently (Ozdemir, 2019; Phoong et al., 2020). Therefore, the Markov switching model has the advantage of allowing one state to represent the expansionary while another state is recessionary (Ozdemir, 2019), thus capturing the complex dynamic patterns of time series data (Shakya et al., 2017).
There is a need to utilize the Markov switching analysis to examine the behaviors of the time series data, and due to the rapid development of computer technology, there has been numerous Markov switching model used in a broad range of fields reported in the literature. For example, in economics, the univariate and multivariate Markov switching model is used to analyze the inflation in Bolivia (Bojanic, 2021), while in Mathematics, the Markov switching regression model is used to determine Chinese tourism demand equations to capture structural changes (Yamaka et al., 2021). Also, the Markov switching model is utilized to predict cutaneous leishmaniasis in healthcare in Isfahan, Iran (Rahmanian et al., 2021).
Bibliometric analysis is a crucial tool to quantitatively analyze a large amount of existing literature, thus identifying the evolution performance in a given field. Although the bibliometric analysis is complex in terms of analysis, the bibliometric approach has seen use in different fields, such as gamification (Trinidad et al., 2021), geosciences (Briones-Bitar et al., 2020), the environment (Mao et al., 2021), and healthcare (Islam et al., 2021).
A systematic literature review is another popular review technique to identify research hotspots among articles in a field critically. It has been used by scholars across many areas, including construction and building (De Paiva et al., 2021), environmental (Moraes et al., 2021), and healthcare (De Angelis et al., 2021; Eberle et al., 2021). The combination of bibliometric and systematic literature reviews has gained popularity in review research, such as technology (Abarca et al., 2020), mobile payment (Abdullah & Naved Khan, 2021), Mathematics (Lozada et al., 2021), and big data analytics (Inamdar et al., 2021).
In order to elucidate existing studies of bibliometric systematic literature review in the Markov switching model, popular digital databases, such as IEEE Xplore, Scopus, Science Direct, Springer Link, and Web of Science (WoS) were searched. The Markov switching model is getting attention in the recent year. Existing literature on the Markov switching model has not been analyzed critically and entirely, which makes it imperative to conduct a review technique to identify the research hotspots of the discipline. Identifying the hotspots of the discipline including the recent trend of the application of Markov switching model in multidiscipline can reveal how research has advanced in that field so far. This understanding is crucial to gain insights about the research focus of the existing literature, and identify potential areas to explore in supporting researcher in reaching necessary goals.
The primary purpose of this study is:
i. To discuss the current trends of Markov switching literature using bibliometric analysis.
ii. To provide a comprehensive systematic review on the applications of the Markov switching model.
This study is the first involving the systematic bibliometric review on the Markov switching model that provides the latest information based on various Markov switching researches. Researchers and funding agencies would be the primary beneficiaries of this study, where the former can get to know the central core trend in this research discipline, while the latter can make informed decisions when funding projects.
The remaining part of this study is organized as follows. Section 2 focuses on the methodology for the extraction and analysis of relevant literature. Section 3 highlights the findings of the bibliometric analysis, while Section 4 discusses the application of the Markov switching model in various fields. Section 5 outlines the challenges of the Markov switching model. Finally, the conclusion and limitations of this work are highlighted in Section 6.
Analytical Framework
The analytic framework serves as a study guideline, hence facilitating scholars’ understanding of the whole research process. This section outlines every stage required throughout this study.
Research Questions Development
This research aims to conduct bibliometric analysis and systematic literature review in the Markov switching model. The research questions are listed in Table 1 alongside the justifications and analysis methods. The descriptive analysis provides general information on the annual productions, annual citations, and performance of countries, journals, articles, and keywords, intending to provide researchers with the evolution in related fields. Trinidad et al. (2021) believe that this step is crucial as it allows the researcher to understand the reliability of a specific journal and prevent them from publishing their work in predatory journals. The global community was shocked when a paper was published in the international journal Scientometrics on February 2021, listing countries publishing in ‘fraudulent’ publications (Mohtar, 2021). There are many debates and follow-up actions, such as “Scopustalk on addressing the challenges of Predatory publishing” by Elsevier on 25 February 2021. Being aware of the journal’s performance in terms of annual production and citations can help the researcher better understand the journal, and the findings can also provide a general idea to the researcher on potential journals for them to publish in. This study’s social network analysis can elucidate the collaboration of relevant information (i.e., countries) via the visualization mapping method (Mao et al., 2021). The conceptual structure analysis aims to uncover research hotspots in the field, while intellectual structure analysis reflects the influence of a publication in related research areas (Trinidad et al., 2021).
Overview of the Research Development in This Study.

A detailed description for each subsection in the bibliometric analysis is explained below:
i. Publication analysis: Measuring the authors’ contributions in related fields (Trinidad et al., 2021) by the full counting method, which gives full credits on related contributions (Waltman & van Eck, 2015). Citation analysis: Examines the popularity of an article by measuring the frequency of the article being cited (Ding & Cronin, 2011).
ii. Co-authorship analysis: Observes national collaborative efforts via the number of joint publications (Caviggioli & Ughetto, 2019).
iii. Co-word analysis: Discover research hotspots via the degrees of keywords co-occurrence (Bui et al., 2020).
iv. Bibliographic coupling: Determine the relatedness of two publications in terms of bibliographies (Abdullah & Naved Khan, 2021).
Locating Study
An appropriate and trustworthy scientific database is required to ensure the validity and quality of the articles obtained. Web of Science (WoS), Scopus, and Google Scholar Web are examples of these. Among these examples, WoS has been selected as the core database in this study because it is widely regarded as the world’s most extensive scientific citation search and analytical information database (Li et al., 2018), covering more than 21,419 prestigious research journals, books, and conference proceedings that underwent stringent selection process (Dabbagh et al., 2019; Elango, 2019). In addition, WoS is superior to the others in terms of the accuracy of its classification system (Wang & Watman, 2016). Therefore, high-quality articles, early access papers, review papers, books, book chapters, and proceedings can be obtained from the WoS core collection (Elango, 2019). However, this study focused on peer-reviewed articles written in English only as peer-reviewed papers are legitimate scholarly communication (Kelly et al., 2014).
Since this study mainly focuses on the Markov switching model, the search keyword is “Markov switching model” only, and via this search technique, the publications with the phrase “Markov switching model” are selected.
Selection of Relevant Research
The Markov switching model combines the discrete regimes and hidden Markov chain used to model the time series data popularized by Hamilton (1989). The unobserved characteristic of the regime-switching model is also convenient for econometricians investigating the probabilistic inference on the time series’ current regime. This model was then expanded by Krolzig (1997) into a multivariate model. Thus, the Markov switching model began gaining traction over the decades since. Unsurprisingly, there is a vast number of publications on this model in the literature. This makes the selection process important to this analysis, as it ensures that all of the papers retrieved are highly related to the Markov switching area. The selection process began with the application of the WoS database. As the first paper of the Markov switching study published in WoS system is in year 1992, the timeline was set to 1992 to 2021 to help examine the entire trend of the model.
The initial selection was then initiated by searching the keyword of “Markov switching model.” Subsequently, the inclusion and exclusion criteria were provided as a guideline for selecting relevant articles. First, articles published in peer-reviewed journals within the period were selected. Next, only peer-reviewed articles written in English were retrieved to prevent misinterpretation of other languages, resulting in invalid findings.
Figure 1 shows the actual workflow for extracting relevant literature to facilitate researchers’ understanding. In this study, the dataset was retrieved from WoS on 24 April 2021, consisted of 553 documents. Among these articles, 101 documents were excluded, as they were unrelated to the category of the article. This exclusion resulted in a list of 452 articles discussing the Markov switching model. Only 449 articles were selected after the language filtration process. The final dataset contained 449 publications after excluding redundant articles.

Research workflow for a systematic review with bibliometric analysis.
Analysis and synthesis of results
After retrieving and extracting the articles from WoS, the bibliographic methods were applied to reveal the information needed to address research questions. Then, Biblioshiny with the R package and VOSViewer were implemented to analyze the important aspects mentioned in the research questions. Biblioshiny with R package, introduced by Aria and Cuccurullo (2017), is a standard quantitative analytical tool used for scientometric and bibliometric analysis, as it is an ideal application for non-coders to generate general statistics information from bibliographic data. On the other hand, VOSViewer was developed by van Eck and Waltman (2010) and is a software widely used to construct network mapping of keywords, countries, and journals. Although this software plays the same role in bibliometric analysis, both tools have different advantages; Biblioshiny is suitable for basic counting, while VOSViewer can build network maps to visualize the relations of selected items, making it easier for interpretation (Gu et al., 2021).
Bibliometric Analysis
The bibliometric analysis utilizes tremendous amounts of studies in identifying popular trends in Markov switching literature. Therefore, this section emphasizes the results generated via bibliometric analytic tools.
Descriptive Analysis
This subsection provides a comprehensive view of publication trends and citation performance of the Markov switching study, followed by the most productive countries and the most influential journals and articles to identify current trends in the study of the Markov switching model.
Annual scientific production and citation
This section provides a comprehensive analysis of the publication and citation trends of the Markov switching study for 1992 to 2021. Figure 2 shows the number of publications and citations of the Markov switching model within the study period. Generally, the Markov switching model study increased gradually over the years, with a growth rate of 10.48% per annum (pa). Based on the findings shown in Figure 2, the publication of the Markov switching study in 1992 is limited to only 1 published article using the Markov switching model in Business and Economics. After that, it grew steadily until 1999, then increased exponentially after the 2000s. This scenario indicates that the Markov switching model gained traction among academics in the past decades, especially in 2015, where the number of published articles was highest, with 38 articles. Although the annual scientific publication declined after 2015, it showed a continuous upward trend until 2020. Unsurprisingly, there is a quick drop in scientific production in 2021, as this study involved the bibliometric analysis until April 2021 only. Although 2021 is unfinished, there are few articles published and indexed in the WoS.

Annual scientific production (1992–2021).
The citation of the Markov switching model fluctuated over the years. In 1994 recorded the highest citation, at 1095, as many researchers referred to previous studies as references for their publications on Markov switching. The lowest citation occurred in 2021 because the data collection period ends on April 2021. Citations are expected to increase over time.
The Most Productive Countries
A total of 61 countries contributed to the study of the Markov switching model. The top 10 most prolific countries are listed in Table 2. Most of the research work is concentrated within the USA, with a total of 77 publications. England emerged as a country with the second-highest number of publications (44), followed by Taiwan (42). Publications from the USA recorded the highest number of citations (2,178), followed by England (997) and Australia (431).
The Top 10 Most Productive Countries.

Note. TP indicates the complete publication of articles according to countries, TC is the total citation, while AC is the ratio of total citation per total publication.
The most productive journals
Academic journals are platforms used by academicians to share new thoughts and knowledge. Therefore, it is vital to undergo the analysis of the most prolific journal in the area of Markov switching. The most productive journals can publish high-quality reviewed articles, publicizing the latest development in related fields by conducting rigorous peer reviews on articles (Chen et al., 2020).
In this study, 449 journal articles were published in 230 journals. Table 3 shows the top 12 most influential journals in the area of the Markov switching model, ranked according to the number of publications. There are 115 articles published in the 12 journals, accounting for 25.61% among all publications. The Economic Modelling has published the most articles, 23 publications, followed by Applied Economics (15) and Applied Economics Letters (14).
The Top 12 Most Influential Journals.

Note. PS is the publication year started in publishing articles of Markov switching model, TP represents the total publication, TC denotes total citation, AC is the ratio of total citation per total publication, IF is impact factor 2019 from Journal Citation Report (JCR), while h-index is calculated based on the publication of Markov switching model’s articles only.
The number of citations for each journal is computed and shown in Table 3, along with the average citations. For example, the publications from the Journal of Econometrics gained 1,254 citations and ranked first in terms of citations, followed by Energy Economics (448) and Journal of Applied Econometrics (390). Consequently, these journals also ranked as the top 3 journals with the highest average citations, with 139.33, 49.78, and 48.75, respectively. Nevertheless, since the majority of the leading journals’ publications were inconsistent in its total citations, the dynamic trend of the journals according to the analysis of Markov switching articles’ publications per year is presented in Figure 3 to provide an insight into the growing trend of journals in the Markov switching study. In the dynamic trend analysis, the loess smoothing technique was implemented using the regression method (Secinaro et al., 2020) to visualize the trends throughout time (Royston, 1992).
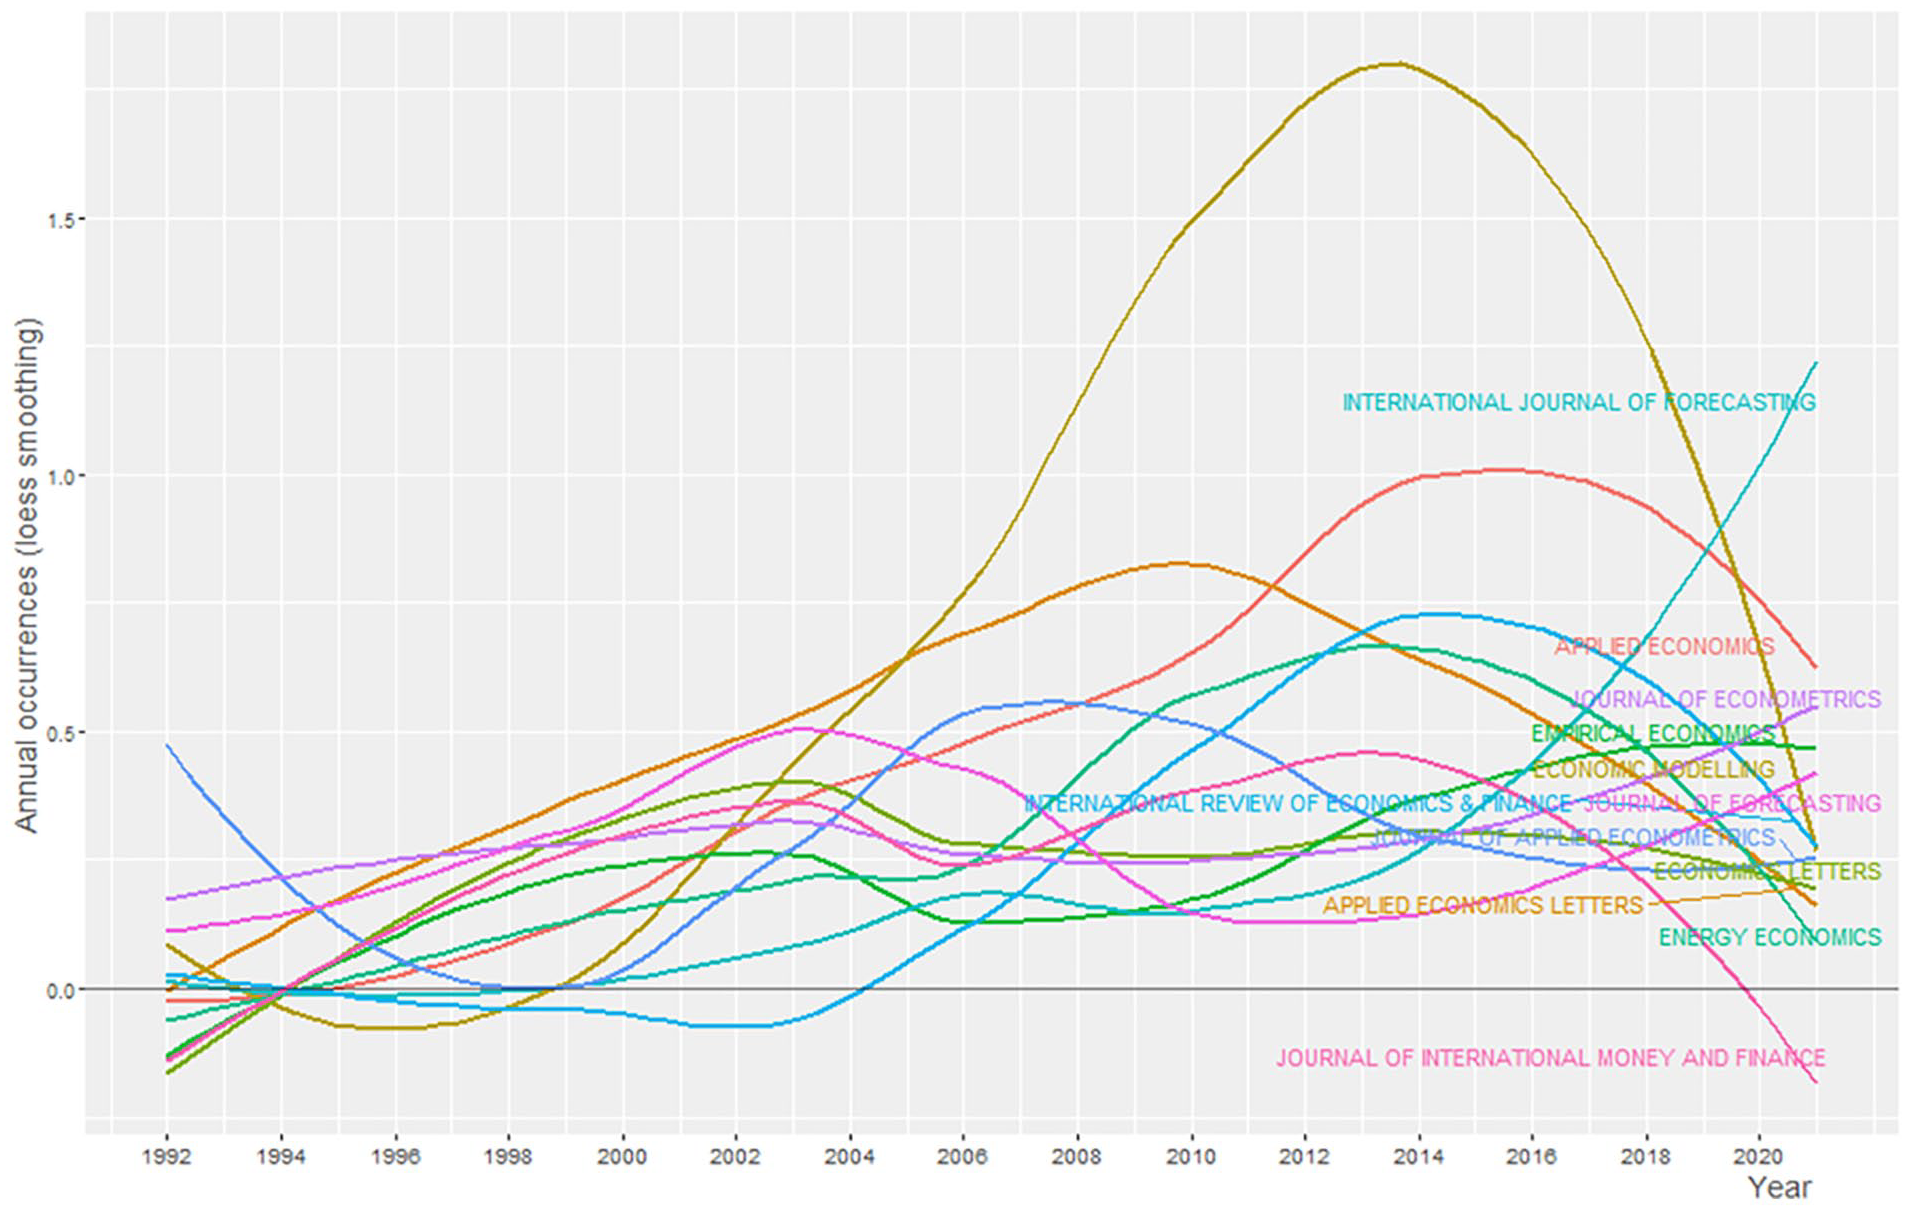
Dynamic trend of journals.
In the context of the impact factor, Energy Economics reported the highest impact factor, 5.203. The journal with the second-highest impact factor is the International Journal of Forecasting (2.825), followed by the Journal of International Money and Finance (2.014). Aside from that, the h-index for the publication of the Markov switching model in the most influential journal is presented in Table 3. The h-index is defined as the maximum h value where the journal has published at least h number of papers that have each been cited at least h times. Therefore, the higher the h-index, the higher the influence of a journal in the Markov switching study. The Economic Modelling ranked first in terms of h-index, 9, followed by Energy Economics (8), Journal of Econometrics (7), and Journal of Applied Econometrics (7).
The most influential articles
The analysis of the most influential articles can provide a general idea of the current trend of this field and assist researchers in their investigations into the related area. Table 4 presents the top 10 highly cited articles involving the Markov switching model within the period. The total citation plays an essential role in determining the impact of an article where an article with a high number of citations is correlated with the quality of the published document. Among 449 articles, the article with the highest citations is “Long memory and regime-switching” by Diebold and Inoue (2001), published in the Journal of Econometrics, and had a total of 563 citations. Concurrently, the “Long memory and regime-switching” also reported the highest average citation (26.81). The “Dynamic linear-models with Markov-switching” by Kim (1994) ranked as the second-highest cited article (538), with an average citation of 19.21, followed by Filardo (1994), which is “Business-cycle phases and their transitional dynamics” (336).
The Top 10 Highly Cited Articles.

Network Visualization
Network visualization portrays the co-authorship of countries, co-words, and bibliographic coupling. Network analysis is believed to provide researchers with a better graphical visualization on collaboration, co-occurrences, and bibliographic coupling, where the relations between selected items is illustrated using nodes size, nodes color, and the thicknesses of connecting lines (Guleria & Kaur, 2021; Zhang et al., 2019).
Co-authorship of countries
The countries co-authorship analysis examined the collaboration strength between different countries and provide an in-depth understanding for researchers on the structure of countries’ contributions in the related area (Mao et al., 2021; Tandon et al., 2021). In this study, the minimum document of a country was set to three to facilitate the network analysis on most collaborative countries publishing research of the Markov switching model. This means that all selected countries must have at least three publications. In addition, 35 out of 61 countries involved in the analysis as countries were unconnected with others are excluded. The top 10 collaborative countries, ranked according to the total link strength, are presented in Table 5. The total link strength is defined as the total number of articles published by authors through collaboration among different countries. In other words, the most collaborative country often shows high values in total link strength.
Countries Co-Authorship.

Note. TP refers to the total publication while TLS is total link strength.
Since the USA is the leading country with the highest publication in the area of the Markov switching model, it is not surprising that the USA has the highest total link strength (38) and link numbers (17) among all countries. Subsequently, England is the country with the second-highest number of publications (44) and total link strength (30). Generally, in the analysis of country co-authorship, it can be seen that developed countries (i.e., USA, England, and France) are interested in collaborating with other countries in publishing articles on the Markov switching model relative to developing countries such as Qatar and South Africa.
Figure 4 shows the visualization map of countries co-authorship in publishing Markov switching literature with different node sizes and colors. The node size refers to the number of published documents of a country, where the bigger the node, the higher the documents published from the country.

A network analysis of countries co-authorship based on documents weights.
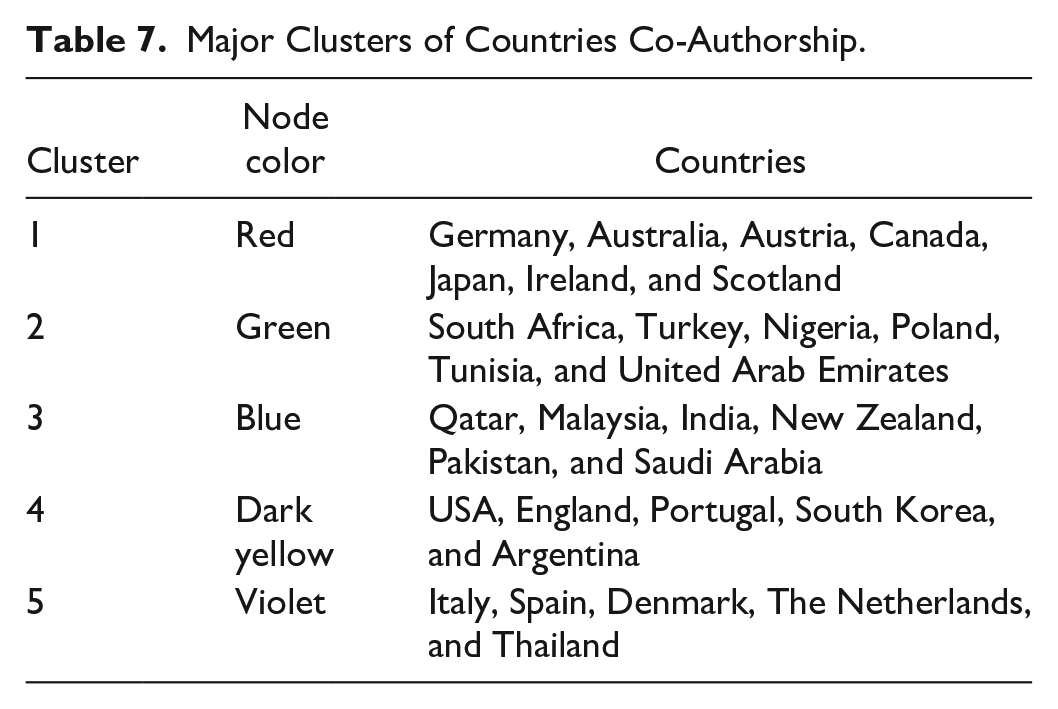
These countries were categorized into seven main clusters, presented in seven colors: red, green, blue, dark yellow, violet, light blue, and orange. The details of the main five clusters with the most sub items are listed below.
Based on the node sizes shown in Figure 4, Germany (cluster 1), Turkey (Cluster 2), Malaysia (Cluster 3), USA (Cluster 4), Italy (Cluster 5), France (Cluster 6), and Taiwan (Cluster 7) were found to be the most influential country for every cluster in terms of publications in the Markov switching field.
Keywords co-occurrence
The keywords co-occurrence analysis is a famous platform used in the bibliometric analysis as it helps reveal the core research topic (Aria & Cuccurullo, 2017; Leung et al., 2017; Vallaster et al., 2019). This analysis was conducted using 1,183 keywords to reveal the research hotspots or themes prevailing in the Markov switching study. In order to identify the essential keywords co-occurrence, the minimum keywords’ frequency was limited to three, which resulted in 66 keywords used in the visualization analysis. Keywords that are unconnected to each other were not included in the analysis. Table 6 highlights the top 10 authors’ keywords, arranged according to the total link strength. The “Markov switching model” recorded the highest total link strength (77), followed by the “Markov-switching model” (55) and Markov switching (31). These keywords also ranked as the top 3 most popular authors’ keywords, as seen in the descriptive analysis in Table7.
Keywords’ Co-Occurrence.

Note. TLS denotes the total link strength.
Major Clusters of Countries Co-Authorship.
Concurrently, the co-occurrence of authors’ keywords can be visualized via network mapping, as shown in Figure 5. The sizes and colors of nodes play different roles in the co-occurrence analysis, where the sizes reflect the frequency of the authors’ keywords in Markov switching literature, while the colors represent the number of clusters.

A network analysis of keywords co-occurrence.
Subsequently, the keywords were divided into 11 major clusters. Finally, the keywords were linked to each other in publications, showed by the nodes with the same color (Guan et al., 2021). In this analysis, the majority of the keywords were linked to the sector of economic and finance. The details of the five main clusters are listed below (Table 8).
Main Clusters of Keywords Co-Occurrence.

With this, the highest frequency keywords, the “Markov switching model,” showed the biggest size of node compared to the other keywords. The connection line between the two nodes shows keywords most likely appearing in the same article. The ‘Markov switching model’ marked the highest connection, linked with 40 keywords.
Bibliographic coupling
Kessler (1963) first introduced bibliographic coupling to pinpoint the similarities shared by two articles (Freire & Veríssimo, 2020). Bibliographic coupling plays a prominent role in determining the relatedness of selected items such as countries and publications. The bibliographic coupling of regions and articles was conducted in this study.
Countries
Bibliographic coupling of countries occurs when an article from two countries cites another document in its reference list (Gu et al., 2021). Bibliographic coupling shows how often these countries share similar bibliographies, which allows us to determine the similarity between these publications. The visualization map of bibliographic coupling can be presented in various patterns of colors and node sizes. The colors reflect the number of clusters present in this study, while the node sizes represent the country’s contributions, where the bigger the node, the more significant the country’s contribution. Figure 6 shows the bibliographic coupling network of countries. Since the minimum document of a country was adjusted to three, 37 countries out of 61 countries met the threshold. Similar to the results in Table 2, the coupling analysis revealed that the USA, England, and France are the top 3 countries in studies involving the Markov switching model.

Bibliographic coupling of countries.
The bibliographic coupling of countries involved five clusters with distinct colors (red, blue, green, yellow, and violet), as seen in Figure 6. The USA leads the most significant cluster (red cluster) and is closely coupled with France, Taiwan, and the People’s Republic of China. Turkey leads the second-largest cluster (green cluster) and is strongly coupled with Malaysia and South Africa. England acts as the leading country in the blue cluster, coupled with Japan and Spain. Finally, in the dark-yellow cluster, Qatar is coupled with Pakistan only, while the leader in the fifth cluster, Australia, is actively coupled with Thailand.
In short, the USA, located at the core of the network, has a solid central influence on the Markov switching model research area, as many countries are coupled with the USA.
Articles
Bibliographic coupling of publications exists when two publications share a similar article as a reference. In other words, articles with similar research interests can be determined via the bibliographic coupling of publications. In this analysis, the relatedness of Markov switching studies is represented by colors and node sizes. The node colors indicate that clusters existed among Markov switching publications, while node sizes represent the total citations gained by a paper. Figure 7 shows the coupling network of Markov switching literature with at least three citations. Correspondingly, this network coupling analyzed a total of 286 articles found to meet the threshold and are linked to one another.

Bibliographic coupling of publications.
The Markov switching publications were grouped into eight clusters by different node colors such as red, green, blue, dark yellow, violet, light blue, orange, and light brown. The light blue and dark yellow clusters are located far away from the other six clusters. Since articles with similar references are categorized under similar node colors, articles in light blue and dark yellow clusters are exclusive vis-à-vis the other six clusters.
The red cluster is the largest, comprising 61 publications and a total of 1,110 citations, with an average of 18 citations per article. The majority of publications in this cluster work on oil prices, stock markets, contagion crises, and business cycles. The highly cited publication in this (red) cluster focuses on the development of a hypothesis testing method for nonlinear models in applied econometrics (Hansen, 1992; 294 citations).
The green cluster is the second largest cluster with 47 articles. The publication in this cluster recorded 1,299 citations, with an average of 28 citations per article. In this cluster, most publications focus on the stock market, stock return, stock prices, commodity market, and the bear and bull market. However, a minority of publications in this cluster discuss oil prices, encompassing WTI and crude oil volatility. The most cited publication in this cluster highlights the application of the Markov switching model in capturing the nonlinear structure of stock returns (Maheu & McCurdy, 2000) (170 citations).
The blue cluster, the third-largest cluster, contains 43 publications with 548 citations, averaging 13 citations per publication. Many publications in this cluster investigated tourism, El Nino information, mathematical modeling, and financial markets. For example, the most-cited article in this cluster discussed applying the Markov switching model and copula theory in analyzing the asymmetric dependence structure of equity markets (Okimoto, 2008; 113 citations).
Generally, these clusters are similar in research areas, although the publications focused on different issues. Therefore, it can be concluded that the Markov switching model is ideal for use in business and economics.
Systematic Literature Review
After conducting the bibliometric analysis, a rigorous systematic literature review was then carried out to determine the application of the Markov switching model.
Application of Markov Switching Model
With the advent of computer technology, the Markov switching model sees use in a broad range of research areas, such as business and economics, mathematics and statistics, science and technology, and social sciences. Therefore, selected articles with the highest average citation from every research area are discussed in this section. The use of average citation ensures the equalities and fairness of this study (Figure 8).

The distribution of application.
Business and economics
Diebold and Inoue (2001) conducted a theoretical analysis of the simple mixture model, Engle and Smith’s stochastic permanent break model, and Hamilton’s Markov switching model used the Monte Carlo experiments to prove the confusion between long memory and structural changes. The findings confirmed that the experiments support the relevance of the theory in finite samples.
Kim (1994) enhanced the state-space model by introducing the Markov switching model. This study extends the Markov switching model to the state-space representation of ARIMA and classical regression models. The algorithm consisted of smoothed and filtered stages for the regime-switching state-space model and maximum likelihood estimation. Lam’s generalized Hamilton model was used to elucidate the effectiveness of those algorithms. The results depicted the algorithms as being vital in terms of computation time.
Chan et al. (2011) analyzed the asset market linkages using the Markov switching analysis. The study aimed to elucidate the inter-relationship between five assets under three categories: US stocks and treasury bonds (financial assets), oil and gold (commodities), and US housing (real estate assets) via the univariate Markov switching model. The Markov switching intercept autoregressive heteroscedasticity (MSIAH) was then used to model the joint return distribution. From the switching analysis, Chan et al. (2011) confirmed the presence of the tranquil and crisis regimes. The tranquil period was characterized by low volatility and positive return, along with the flight from quality in gold to stocks. On the other hand, the crisis is indicated by high volatility and negative return, along with the evidence of contagion between stocks, oil, and real estate. Also, the crisis regime showed evidence of flight to quality from stocks to treasury bonds.
Filardo (1994) explored the business cycle phases and transitional dynamics by utilizing the Markov switching model. The study’s objective was to investigate the expansionary and contractionary stages of the US business cycle with the application of the time-varying transition probabilities of the Markov switching model. As a result, both statistical and graphical analyses showed that the model supported both stages of the US postwar business cycle. Furthermore, the point estimates revealed that output growth experienced both positive and negative growth rates.
Hansen (1992) developed a hypothesis testing approach for nonlinear models that underwent nonstandard conditions. The hypothesis testing methodology was also applied to the Markov switching model to analyze the US postwar Gross National Product (GNP) introduced by Hamilton (1989). In the study, the likelihood ratio test failed in rejecting the AR(4) hypothesis in favor of the regime-switching approach. The main difference of the proposed method with that of Hamilton’s is the second autoregressive parameter, but the present approach switch between states, similar to Hamilton’s model, but those states were reached independently.
Mathematics and statistics
Bauwens et al. (2014) solved the computation issue of the marginal likelihood for Markov switching and change point GARCH models. The purpose of the study was to solve the computation problem via the particle Markov Chain Monte Carlo (MCMC) method proposed by Andrieu et al. (2010). Due to the path dependence issue, the Bayesian algorithm was used to estimate the Markov switching and change point GARCH models, while marginal likelihood was used to select regime numbers. In addition, a comparison between these models was conducted using several financial return series for 1999 to 2011 to examine the performance of these new approaches, encompassing S&P 500 index, US indices, stock, exchange rate, and commodity index. Generally, the Markov switching GARCH model outperformed the changing point GARCH model in the comparison, although both models performed well in detecting dynamics changes and volatilities.
Ardia (2009) proposed the Bayesian estimation of the Markov switching threshold asymmetric GARCH model. The findings confirmed no differences between asymmetries and asymmetry locations when comparing high volatility periods with low volatility situations. Moreover, the single regime model performed better than the regime-switching approach for the analysis in-sample, while the latter was outperformed in terms of forecasting.
Science and technology
de Lagarde and Lantz (2018) analyzed the impacts of renewable energy production on electricity prices by developing an econometric model. The results showed that renewable energy production resulted in a negative marginal effect and increased robustness in the high price state. Concurrently, the findings also revealed that solar and wind generation has a significant impact on electricity prices.
Martínez-Beneito et al. (2008) proposed using the Markov switching model for early detection of diseases. The study aimed to introduce an alternative model for studying the influenza epidemic periods. First, 11 season of influenza surveillance data formed by the influenza-likely illness incidence rate was obtained from Valencian Sentinel Network for 1996 to 1997 and 2006 to 2007. The results showed that the proposed model outperforms the other methods in detecting influenza epidemics.
Wang et al. (2012) proposed the Markov switching model in a telecommunication network to infer dry and rainy situations from commercial microwave link signals. The findings depicted that, generally, the Markov switching model performs better than the abovementioned algorithms. In addition, the performance of the switching model can be improved if multiple channel inputs are involved.
Noman et al. (2019) worked on cardiac sound analysis using the Markov switching model. The analysis revealed that the proposed model presented better performance than the hidden semi-Markov model in cardiac auscultation with extensive noisy data.
Social science
Lanouar and Goaied (2019) examined the effect of terrorism and political violence in the tourism industry of a tourism-dependent country. The study aimed to investigate the effects of terrorist attacks and political instability on tourism in Tunisia from January 2000 until September 2016. The findings revealed strong evidence of stationarity, five break dates, and spurious long memory in the time series data. Meanwhile, the results also depicted that the local shock presented much more impact than international shock in tourism. Concurrently, terrorism had a more prolonged effect than political instability on Tunisian tourism activity.
Malyshkina and Mannering (2010) analyzed roadway safety using the Markov switching model. They reported that switching count data models were superior to zero-inflated models in handling accident frequency datasets.
Chang and Lee (2015) proposed the switching approach in Taiwan’s policy momentum. Their study aimed to implement the Markov switching model in analyzing Taiwanese government policy to develop creative cultural industries. The results confirmed that the Taiwanese cultural creative industries have a greater tendency to remain in high volatility.
Gu et al. (2018) conducted the Markov switching model to analyze Macao’s tourism development and economic growth. The purpose of their study was to examine the tourism and business cycle of Macao by applying a two-state switching model and identify the determinants of these cycles via a combination of structural regression and the switching model. The findings revealed that the Macao cycle is highly asymmetric as the high growth state showed longer lasting than the low growth state. Also, the regression results found that Macao’s tourism cycle is significantly affected by the business cycle of Mainland China and other external issues, including visitor arrivals, transportation in Guangdong, the global crisis, and Mainland China’s anti-corruption measures.
Owyang et al. (2008) analyzed the economic growth of cities using the Markov switching model. The study focused on examining the determinants of employment development in metro areas with the implementation of the switching model to classify the growth of cities into high and low growth stages. The effects of factors for average, high, and low growth rates were examined throughout the study. The results indicated that the high growth rate is related to several variables, such as human capital, while the low growth rate is related to the manufacturing performance only.
Other application areas
The Markov switching model also can be applied in other areas such as applied in building occupant (Wolf et al., 2019). Wolf et al. (2019) analyzed the building occupant activities using the Markov switching model. The objective of their study was to present a new approach based on the consumption of carbon dioxide trajectories to conduct the building occupant activity estimation, simulation, and short-term forecasting. The one-step prediction analysis showed that the presented method performed well in both situations.
Chaubert-Pereira et al. (2009) studied three forest growth components using a statistical model. The findings showed that the growth phases are highly influenced by various factors, including average growth level and growth fluctuation amplitudes in response to climatic factors and inter-individual heterogeneity. Moreover, the plasticity of the plant species impacted the response to climatic factors, while inter-individual heterogeneity was found to be affected by issues such as tree origin, sampling method, and afforestation interventions.
Taugourdeau et al. (2011) investigated trees’ development via the regime-switching approach. The study emphasized the developmental plasticity of walnut saplings using the Markov switching linear mixed model. The analysis revealed that the walnut sapling is mainly driven by light availability. Finally, it was also found that the growth fluctuation amplitude, in response to climatic issues, increased, but inter-individual heterogeneity decreased during the trees’ development.
Rostami et al. (2018) conducted the price transmission analysis in agriculture. Their study aimed to explore the price transmission in the Iranian fluid milk market via a Markov switching vector error correction approach. The results showed a positive price asymmetry in the fluid milk market, and retail prices could decrease faster in response to increasing farm prices.
Conclusion
This study addressed the evolution and research trend of the Markov switching literature between 1992 to 2021 using the bibliometric and systematic literature review. The bibliometric analysis showed significant research in the Markov switching field as a continuous upward trend recently. Meanwhile, the USA is the main contributor in the regime-switching model, reporting the highest publications (77). Subsequently, Economic modeling was ranked as the top journal, but the International Journal of Forecasting was the most probable journal that can overtake Economic modeling in the near future. The top 3 of the most influential articles on business and economics were written by Diebold and Inoue (2001), Kim (1994), and Filardo (1994).
From the collaboration network, countries were divided into seven clusters: Germany, Turkey, Malaysia, the USA, Italy, France, and Taiwan are leading countries of every cluster in terms of published volumes. Concurrently, the “Markov switching model” is the most popular keyword used with the highest usage and link numbers. From the coupling of countries, the USA has the most substantial influence in the Markov switching area, as many countries are coupled with the USA. From the coupling of articles, all publications have been categorized into eight clusters, while most of the clusters presented the model in the category of business and economics.
This study faced some limitations, the first being the accuracy of datasets extracted from WoS. The datasets retrieved might be slightly different by conducting the search query on different dates even though the exact search keywords and steps were used, as WoS update their list of published articles daily. For example, the search query of this study was retrieved on 24 April 2021; therefore, the search result obtained may be different, as there is a stream of Markov switching studies published after that time.
Second, the accuracy of results also depends on the types of sources used to extract datasets. In this study, the datasets were extracted from the WoS database via the search process. However, using a single scientific database, the high-quality Markov switching studies not indexed by WoS might not have been included. Therefore, other well-known databases such as Scopus should be used and incorporated with WoS to obtain a vast number of Markov switching literature, which is expected to increase the reliability of the findings.
Footnotes
Declaration of Conflicting Interests
The author(s) declared no potential conflicts of interest with respect to the research, authorship, and/or publication of this article.
Funding
The author(s) disclosed receipt of the following financial support for the research, authorship, and/or publication of this article: This research was funded by Fundamental Research Grant Scheme (FRGS) provided by Ministry of Higher Education, Malaysia. Grant number FRGS/1/2019/STG06/UM/02/9.