
Abstract
Blended learning pedagogical practices supported by learning management systems have become an important part of higher education curricula. In most cases, these blended curricula are evaluated through multimodal formative assessments. Although assessments can strongly affect student outcomes, research on the topic is limited. In this paper, we adopted a learning analytics approach to explore student engagement with formative assessments and the power of these assessments to predict student outcomes in an English for Academic Purposes courses in a Hong Kong university. The study retrieved the data logs from 7,815 students and used the data to analyze student engagement with the formative assessments. The results suggested that the students put effort into completing the assessments. The degree to which assessments predict learning outcomes depend on students’ level of subject knowledge and their understanding of the relevance of the assessments. This study showed that learning analytics provided reliable evidence for understanding students’ engagement and identifying at-risk students. Therefore, learning analytics research has the potential to inform pedagogical practice.
Keywords
Introduction
The expanding use of learning management systems (LMSs) has made blended learning the new norm in higher education. Blended learning encompasses a range of pedagogical practices that suit today’s learners and maximize the potential for academic success (Garrison & Vaughan, 2013; Porter et al., 2016; Ross & Gage, 2006). In English for Academic Purposes (EAP) courses worldwide, technology-based, and face-to-face approaches are increasingly being blended to facilitate second language (L2) acquisition (Terauchi et al., 2019). Online multimodal formative assessments, delivered through an LMS and aligned with the established principles of L2 acquisition (Chapelle & Sauro, 2017; Hockly, 2018), can enable authentic and engaging learning language-learning experiences that foster student autonomy (Park et al., 2016). Accordingly, there has been a call for higher education institutions to use formative assessments in LMSs to help EAP students succeed in language coursework and other studies.
In recent years, both the number of L2 learners pursuing higher education and efforts to integrate technology into EAP programs have increased greatly. However, research on the value of formative assessment has chiefly examined other courses and disciplines such as quantitative methods (e.g., Choi et al., 2018; Tempelaar et al., 2018, 2020), business (e.g., Tempelaar et al., 2011), history, social care, maths, and engineering (e.g., Hlosta, et al., 2017). There has been little in-depth analysis of the extent to which EAP formative assessments delivered through LMSs such as Blackboard can predict students’ future performance and on the potential of learner analytics to identify L2 students who are academically at risk. The emergence of blended learning as the new norm for language acquisition in a higher-education environment in which the focus is on quality outcomes (Gruba et al., 2019; Terauchi et al., 2019) has raised questions regarding individual students’ formative assessment behavior online and the best practices for supporting their success in courses and maximizing the potential of blended learning. Past studies have focused on disciplines in which multimodal formative quizzes are used to help students understand concepts that they will be tested on in a final exam. However, in an L2 setting, students may learn concepts via multimodal formative assessments but they will still need to develop skills—skills that they will have to demonstrate in their final L2 assessment. Therefore, the predictive power of multimodal formative assessments in L2 courses remains uncertain. To gain insight into the power of such assessments to predict students’ final course grades, we identified the time required to complete a quiz, the number of quiz attempts, and scores on LMSs as factors to assess whether students were at risk for failing L2 courses.
Literature Review
In higher education, blended learning has become more common owing to the rapidly increasing demand for online and distance courses (Brown, 2016; Moradimokhles & Hwang, 2020). Blended learning integrates didactic teaching pedagogy and multimedia technologies to transform the traditional classroom (Graham, 2006; Joosten et al., 2014). The benefits of this approach may include increased efficiency (Rubio et al., 2018), flexibility, and ease of access for learners (Bonks et al., 2005). Blended learning has been found to increase engagement, retention, and student satisfaction (Baumgartner, 2015; Gadbois & Quildon, 2013; Moradimokhles & Hwang, 2020) and to facilitate language learning in general (Kohnke, 2021; Li, 2017). Effectively incorporating blended learning into course delivery and learning resources (Thomas et al., 2017) requires a thorough understanding of the ways in which higher education students learn (Golonka et al., 2014).
Numerous studies have reported positive effects from blended learning pedagogies (Banditvilai, 2016). Students who engage in this form of learning, compared with those in traditional courses (whether taught face-to-face or online), exhibit modestly better performance (Owston & York, 2018). However, there are significant challenges to using blended learning in course delivery. It can be difficult to stimulate interaction, facilitate student learning and allow flexibility in learning (Boelens et al., 2015). An awareness of these challenges was especially important in framing the present study, as they shed light on the possible facilitating effect of technology in L2 language learning, including in the context of independent learning.
EAP courses prepare students to undertake university studies in English (Flowerdew & Peacock, 2001) by cultivating academic language proficiency and communicative competence (Hyland, 2006). There is a growing awareness of the challenges that L2 students face as they learn to read and write, and EAP education can support their efforts to acquire new discourse practices that will help them to succeed in all of their academic endeavors (Hyland 2018; Lughmani & Foung, 2021). With ever more L2 EAP students enrolling in higher education institutions around the world, it is important to determine the effectiveness of multimodal formative assessments delivered through an LMS in facilitating these students’ L2 acquisition and predicting their final course grades.
Formative quizzes or assessments (Gardner, 2012) are integral to L2 learning. They are used to identify and monitor students’ knowledge and skills (Hinkelman, 2018). While the literature offers multiple definitions of formative assessment (Wiliam & Leahy, 2015), a common conceptualization is to understand it as an assessment for learning that allows students to understand what they are learning and what they should aim for during their learning journey (Elwood & Kelnowski, 2002). Although students should always be the central actors in formative assessment (Wong, 2017), teachers can also benefit from its assessment of student learning to inform and adapt their teaching (Popham, 2008; Yan et al., 2021). These principles are important as they guide the design of the multimodal formative assessment examined in this study.
Multimodal formative assessments through LMSs constitute the core of blended learning approaches (Staker & Horn, 2012). Recent studies have found that students tend to have a positive attitude toward online quizzes (Cohen & Sasson, 2016; Wallihan et al., 2018), particularly those that incorporate multimodal elements and active learning (Cook & Babon, 2017; Gamage et al., 2019). Particularly helpful for L2 learners are automated quizzes that can be taken repeatedly and offer timely and actionable feedback. These features allow EAP students to self-assess and guide themselves through the process of acquiring an L2 while still participating in an active and supportive learning environment. But automated quizzes can also provide information on student progress—for example, on how a student performs relative to their peers. Blackboard, for instance, features built-in analytical tools that can assist teachers and administrators to understand students’ needs even as they help them to understand the subject matter through the completion of targeted activities (Hinkelman, 2018). However, students may do well on tasks such as understanding the concepts taught in EAP courses and the expectations that they are expected to meet and yet fail to do well in course assessments (i.e., not develop the skills needed to employ EAP).
LMSs such as Blackboard support and enhance traditional course delivery in a blended manner through such built-in tools as discussion forums, chats, file sharing, quizzes, and videos (Cole et al., 2019; Coskuncay & Ozkan, 2013). These functions foster independent language learning (Ghazali, 2018). Previous studies of LMSs and language learning have investigated the use of technology to elicit and assess interactions (Dixon & Fuchs, 2015) and its impact on learners’ evaluations of their coursework (Rubio, 2015). That said, technology alone cannot facilitate teaching and learning. Previous studies have established that teachers tend to use LMSs for only basic functions such as uploading course syllabi or PowerPoint slides (Dahlstrom et al., 2014; Graham et al., 2013). Higher education institutions have seldom leveraged the full features of LMSs to transform learning and teaching.
A generally accepted definition of learning analytics is “the measurement, collection, analysis, and reporting of data about learners and their contexts, for purposes of understanding and optimizing learning and the environments in which it occurs” (Ferguson, 2012). The analytics of learners can be of use in understanding the complexities of L2 acquisition (Thomas et al., 2017) because they reveal what students do. They can be used to bridge pedagogy and analytics (Rienties et al., 2018). The major advantage of learning analytics is that engagement is measured via empirical data on students’ actual behaviors; the data are retrieved directly from server logs rather than gathered from self-reported or perception-based questionnaires and interviews. Learning analytics can be used to develop predictive models to measure, understand, and analyze students’ work on LMSs (Atherton et al., 2017). Language learning is a long-term investment, so there is a pressing need for insight into the type of learner resources that students access (e.g., quizzes, discussion boards, or forums), the frequency with which they access them, any unusual behaviors in which they may engage in this regard (Baker et al., 2006; Chen & Foung, 2020; Scheffel et al., 2001) and any positive or negative effects the resources have on them (Conati & Maclaren, 2009; Reffay & Chanier, 2003). By analyzing LMS data, institutions, and language teachers acquire information that can help them to provide personalized and rich learning, predict student success, and support at-risk students (Zhang et al., 2018). LMS data have been used in such ways in a wide range of disciplines in higher education (e.g., Choi et al., 2018; Hlosta et al., 2017; Tempelaar et al., 2018), but little comparable research has been performed in the EAP context.
Recent studies have drawn attention to the lack of standardization of the tools used in learning analytics, which has limited research and made it difficult to compare studies (Hwang et al., 2017; Zhang et al., 2018). Many questions remain regarding the potential of learner analytics to assist language teachers and administrators in analyzing language acquisition at scale to improve the delivery of course materials and thereby promote academic success. There has been little analysis of the performance of EAP learners in higher education contexts on multimodal quizzes in blended courses using an LMS such as Blackboard over multiple academic semesters. The present quantitative study was accordingly designed to answer the following research questions (RQs):
RQ1: How do students engage in multimodal formative assessments?
RQ2: To what extent do multimodal formative assessments predict EAP students’ performance on final assessments?
Methodology
In this learning analytics study, we aimed to understand students’ engagement with multimodal formative assessments and explore the predictive power of those assessments. We used a five-step procedure to conduct the study (Figure 1). First, we retrieved data from EAP courses across seven cohorts with 7,815 students. This data set included 18 variables, including the final grade, results of 13 quizzes and timestamps of student activities (e.g., recording the time when an activity was completed). We processed the data from an event-based file in which each entry was an event log to a student-based file in which each entry represented a student. We then examined the missing data cases and cleaned the data using a listwise approach. To answer RQ 1, we computed the students’ average percentage of completion and average starting day. To answer RQ 2, we adopted logistic regression to determine the probability of students’ being at risk (grade C or below). The dependent variable was the students’ risk level, which was derived from their final grade (on a ranking scale from 0 to 4.5 with “1” representing 0.0 to 2.5 and denoting “at risk” and “0” representing 2.5 to 4.5 and denoting “not at risk”). All of the quiz results were entered into the prediction model as the independent variables. The McFadden’s p2 was .17, which is close to .2 (indicating an extremely good fit), and the accuracy of the logistic regression equation was 80%, which was comparable to that achieved in previous studies. This model was validated with a 10-fold cross-validation that confirmed the robustness of the model with a fair agreement in the kappa value.

Data analysis procedures.
Participants and Research Context
The data that we present in this study were collected at the largest public university in Hong Kong. Specifically, we collected data from students who were undertaking a compulsory first-year EAP course that focuses primarily on academic writing and presentation skills. Approximately 2,500 to 3,000 individuals participate in the course annually. After processing and cleansing the data, there were 7,815 students in the data set across seven cohorts. The course is delivered over 13 weeks. One multimodal formative learning assessment must be completed by students weekly. Being an assessment for learning, this assessment is designed to show students what they are learning and what their learning goals should be. Therefore, each assessment pertains to an important area of their studies (Table 1).
List of Multimodal Formative Assessments.

The quizzes are made available on the Blackboard platform, which is a virtual learning environment. The students are required to complete a total of 50% of the questions from all of the quizzes. Failure to do so results in an overall grade reduction (ranging from 0.5 [e.g., B to C+] to 1 grade [e.g., B to C]). There are no bonus points for students completing more than 50% of the questions. Students may take the quiz multiple times if they wish to do so. The online content for each week consists of a video that focuses on the specific topic of the session, followed by a series of questions (around 10 per quiz), some with multiple-choice answers and others requiring “true” or “false” responses. These formative assessments were introduced four academic years before the data collection for the present study. There were formal quality-assurance mechanisms for teachers, students, and subject leaders in each cohort of students to review the validity and reliability of these formative assessments. No major or minor changes were made to these formative assessments after their introduction. While instrument validation was not conducted quantitatively, the questions for these quizzes should be considered valid and reliable after being used and reviewed for more than six cohorts.
Besides the formative assessments, students must complete three summative assessments in this course: a problem-solution essay, discursive essay, and academic presentation. The university uses a grading scheme that is standard in Hong Kong (Table 2), with grades ranging from 0.0 to 4.5.
University Grading Scheme.

Outcome Measures
The outcome measures of these studies (i.e., independent and dependent variables) were chosen based on the availability of variables on the LMS and the research focus on multimodal formative assessments. While the event logs received from the information technology department contained many variables, we were interested only in the relationship between multimodal formative assessment and assessment results. Therefore, only events indicative of that relationship were processed to constitute the data set for the study. We retrieved and processed the following variables: the final assessment grades (3) and final course grade (1), the results of the final multimodal formative assessment attempt (13), the timestamps of the first attempt at quizzes (13), and the timestamps of the final attempts at quizzes (13). We did not enter the timestamp variables (26) and final assessment grades (3) into the regression equation because the time factor was not the focus of this paper and the assessment results have direct mathematical relationships with the final course grade.
The final assessment results were recoded as a binary variable before being entered into the regression equation. This variable was designed to indicate whether a student was at risk of failing the course. While the literature does not suggest a clear numerical cut-off point for being at risk, it did suggest that the aim of identifying at-risk or struggling students is to provide them with timely assistance (Chingos & Whitehurst, 2011). Therefore, this study defines “at risk” as below 2.0 (i.e., below a C grade). Identifying students with grades of C or less can help teachers intervene in a timely fashion.
A summary of the outcome measures is provided in Table 3.
List of Variables.

Data Analysis
To answer RQ 1, we used R (version 4.0.0) to compute computed the average of the completion rate of the quizzes and the timestamps for the first and final attempts at quizzes for each student. The timestamps provide a direct indication of engagement by showing when students start and stop doing the quizzes, whereas the completion rate measures engagement indirectly by indicating how much of the quiz students have completed with a given passing rate. Even though the average is a basic descriptive statistics indicator, it can provide “a clear overview of the results at a glance” (Woodrow, 2014, p. 50). Thus, the averages should provide meaningful insights into student engagement.
To answer RQ 2, we adopted direct logistic regression analysis with R (version 4.0.0) to “predict a discrete outcome from a set of variables” (Tabachnick & Fidell, 2013, p. 439). I entered all of the predictors (scores for the 13 quizzes) simultaneously as independent variables and the risk as the dependent variable. The goodness-of-fit was measured with McFadden’s p2, with a p2 between .2 and .4 being considered “indicative of extremely good model fit” (Louviere et al., 2000, p. 54). To validate the model, 10-fold cross-validation was conducted to confirm the model’s robustness, similar to the design for the student outcome prediction study (Zacharis, 2015). As the current study focused on the predictive power of multimodal formative assessments rather than on establishing a model, we decided not to eliminate predictors even if they were not statistically significant predictors as suggested by the Wald test. The overall accuracy rate and Cohen’s kappa, supported by other relevant indicators (e.g., false positives and false negatives), were crucial in evaluating the accuracy of the prediction. The overall accuracy rate was simply the percentage of accurate predictions out of the total number of cases. According to Ramasubramanian and Singh (2017), there is no widely accepted rate for prediction accuracy, which depends on the context. Cohen’s kappa explores “the relationship between observed accuracy and expected accuracy” (p. 462) and falls between 0 and 1.
Results
General Engagement Pattern of Students
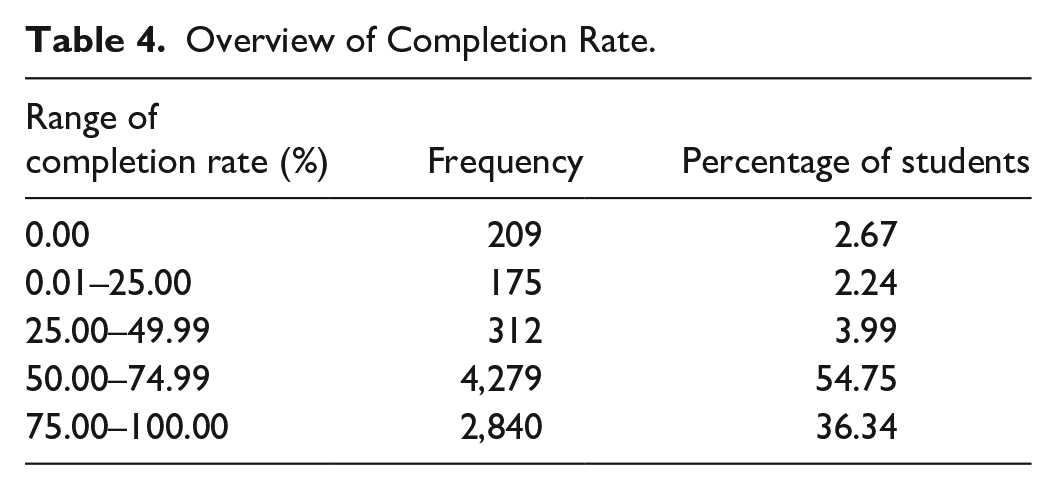
The purpose of our first RQ was to investigate how students had engaged with the multimodal formative assessment tasks. Generally speaking, the students engaged extensively with the tasks (see Table 4 for an overview of their scores). While the required completion rate was only 50%, the students’ average completion score was 66.8%. This shows that many students did not stop working on a quiz after achieving the required completion rate. They continued to engage with it despite the lack of incentives in the assessments. It is also encouraging to note that 36.3% of the students achieved scores far beyond the requirement (a completion rate of 75% or higher). These results indicate that the students invested considerable effort in their multimodal assessment tasks and endeavored to perform well.
Overview of Completion Rate.
On average, the students undertook a quiz for the first time 59.8 days into the semester (i.e., the middle of week 8 in a 13-week semester). The average time difference between the students’ first and last attempts at taking a quiz was 1 hour. Thus, they started and ended the assessment tasks on the same day and did not revisit them. On average, 8 of the 13 tasks were completed only once (i.e., the first attempt was the only attempt). The students, on average, completed four tasks more than once and never attempted four tasks.
Predicting Outcomes With Multimodal Formative Assessment
Our aim in posing the second RQ was to develop a prediction model. With it, we hoped that we would be able to predict final student outcomes based on each student’s performance on multimodal formative assessments. In undertaking this exploration, we decided to identify at-risk students: those who obtained grades of C (satisfactory) or below. To do so, we considered the students’ performances on their first attempts at the tasks. The proposed prediction equation was:

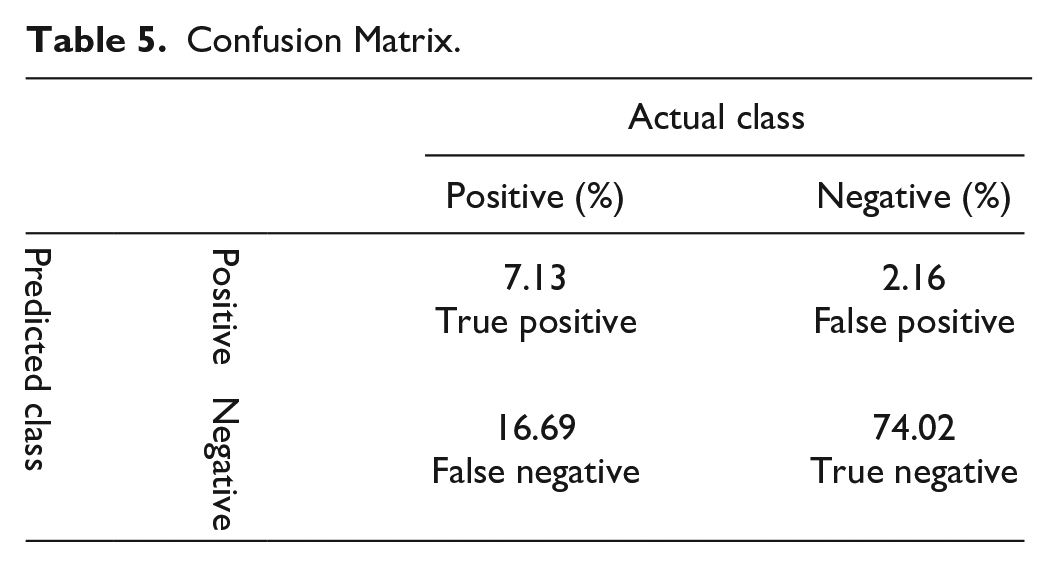
We have detailed the prediction equation model in Table 5. McFadden’s p2 of the model was .172, which is considered an extremely good model fit after rounding up to .2 (Louviere et al., 2000). Ten-fold cross-validation showed the overall prediction accuracy to be 80.7% (81.15% for the original data set without the validations; Table 5), meaning that four in five students could be identified correctly as being not at risk based on their performance on their first quiz attempt. The scholarship to date has suggested that the rate of accuracy depends on the specific context in which research is conducted; there is no consensus on what constitutes an appropriate accuracy cut-off rate. Our 80.7% accuracy in this study seems acceptable as it is comparable to that of similar studies (e.g., 81.3% for Zacharis, 2015). The kappa value is .34, which is considered a fair agreement between observed and expected accuracy (Ramasubramanian & Singh, 2017, p. 462). However, it should be noted that 16.69% of the misclassified cases were false negatives: those who, despite being at risk, were not identified as such. This is an alarming result and warrants further discussion.
Confusion Matrix.
We entered all 13 of the students’ assessment scores into the proposed model. Only Quizzes 11, 12, and 13 were not statistically significant predictors (i.e., p > .05) as indicated by the results of the Wald test to which we subjected the quiz outcomes (Table 6). As it is hard to interpret the strength of coefficients in a logistic regression equation, we created some hypothesized scenarios and incorporated them into our prediction model (Table 7). First, we computed the average scores for each of the tasks and entered the results into our model to determine the probability of students’ being at risk if they managed to attain the average score for all of the quizzes. We found the probability to be 20.8% (i.e., relatively low). We then entered another 13 hypothesized cases into the model. In each of them, one score (across 13 scores for all quizzes) was 40 points below the average score (out of a possible total score of 100) while all the other scores matched or surpassed the average. We were consequently able to examine the impact of individual quizzes on the at-risk probability ratings. Our investigations determined that Quizzes 1 (Academic Style) and 4 (Integrating Sources) helped students reduce the probability of being at risk in the course. Thus, the students’ scores for those two quizzes had the most significant impact on their academic outcomes: students who did not perform well on those quizzes had a higher probability of being at risk. The only quizzes that were not significant predictors were related to giving presentations (i.e., Quiz 11–13), except Quiz 10.
Coefficients of Logistics Regression Equation.
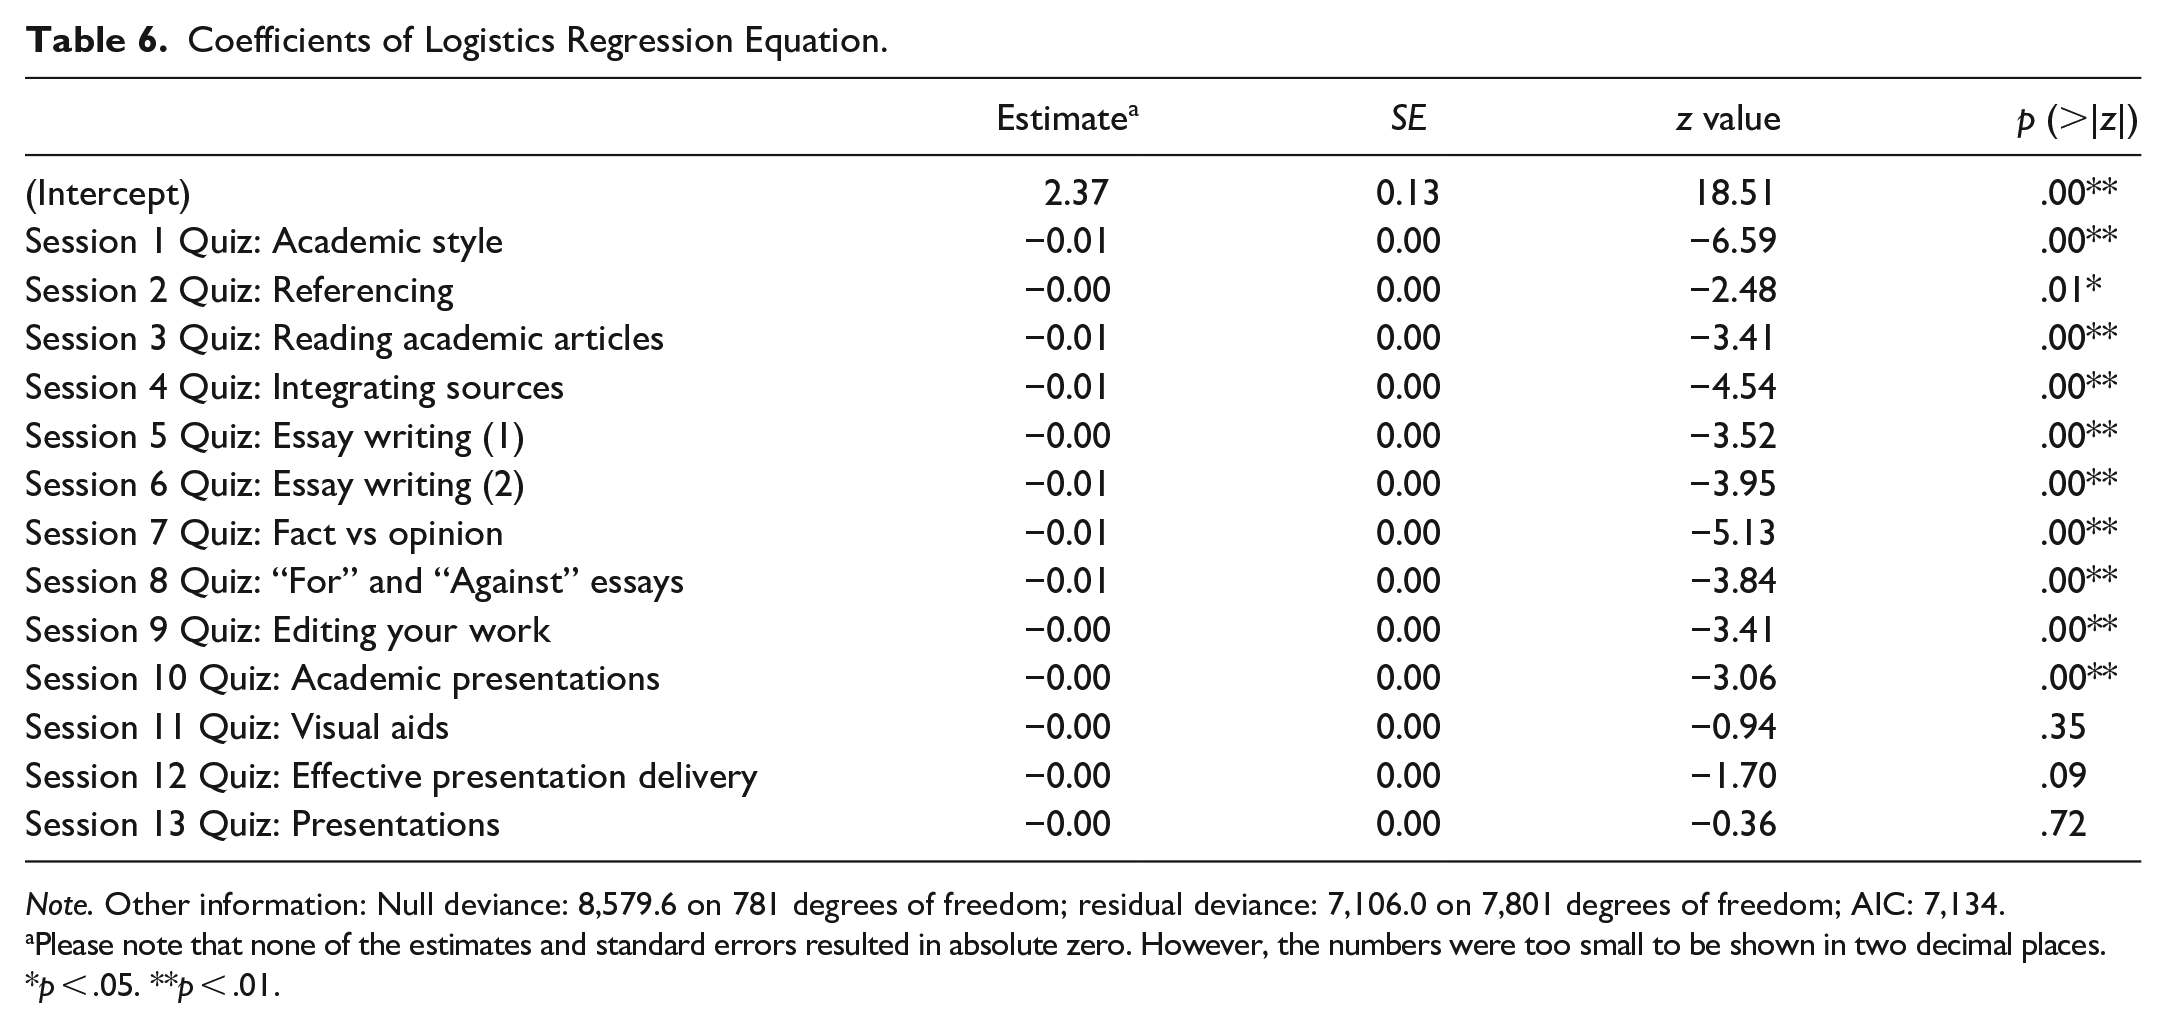
Note. Other information: Null deviance: 8,579.6 on 781 degrees of freedom; residual deviance: 7,106.0 on 7,801 degrees of freedom; AIC: 7,134.
Please note that none of the estimates and standard errors resulted in absolute zero. However, the numbers were too small to be shown in two decimal places.
p < .05. **p < .01.
Impact of Decrease in Multimodal Formative Assessment Scores.

False Negative Investigation
We conducted further analyses to understand why some at-risk students could not be identified. At the outset, it must be acknowledged that the process of predicting student outcomes may not be as straightforward as generating predictions in other scientific disciplines—for example, predicting the 5-year survival rate of cancer patients. Teaching and learning in higher education involve complex processes; their success relies on the delivery skills of teachers, the psychology and demography of students, and even on students’ attitudes toward quizzes such as those used in the first-year EAP course. Consequently, a relatively high false-negative (or error) rate should come as no great surprise.
We compared numerous indicators between false-negative and true-positive cases as well as between false-negative and true-negative cases. As expected, the average quiz scores associated with the false-negative cases were higher than those related to the true-positive cases (Table 8). However, they were slightly lower than those of the true-negative cases (that is to say, the students who were not deemed to be at risk) (Table 9). Our further examination of the correlation matrix corroborated this finding (Table 10); the average result for the correlation coefficient between quiz scores and the assessment final scores for true-positive cases was .31 (and as high as .50); for false-negative cases, the result was .003 (and as high as .16). In other words, the students who had false-negative results worked hard but simply did not attain good scores in their summative assessments.
Comparison Between False Negatives and True Positives (Completion Rates).

False negative: Students who were at risk but could not be identified as such.
True positive: Students who were at risk and identified as being at risk.
Some students did not complete any quizzes so their completion rates were excluded. Otherwise, the completion rate would have been underestimated.
The cutoff points used were based on Cohen (1988).
p < .01
Comparison Between False Negatives and True Negatives (Completion Rates).
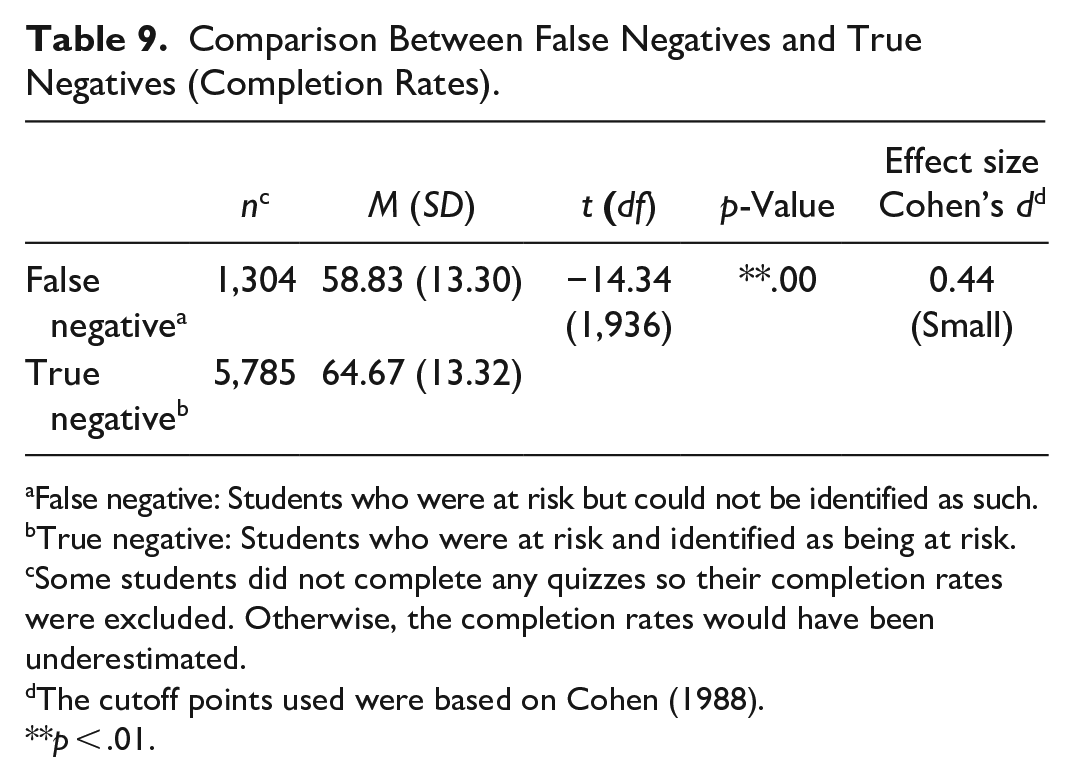
False negative: Students who were at risk but could not be identified as such.
True negative: Students who were at risk and identified as being at risk.
Some students did not complete any quizzes so their completion rates were excluded. Otherwise, the completion rates would have been underestimated.
The cutoff points used were based on Cohen (1988).
p < .01.
Correlation Between Assessment Final Scores and Formative Quiz Scores (Summary).

False negative: Students who were at risk but could not be identified as such.
True positive: Students who were at risk and identified as being at risk.
False-negative and true-negative cases tended to have similar quiz scores, but true-positive cases were markedly different. To understand the extent to which students had undertaken formative tasks, we conducted another round of analysis. This time, we focused on the students’ number of attempts at taking the quizzes. On average, true at-risk students failed to complete 9 or more of the 13 tasks, completed 2 tasks only once, and undertook only 1 of the tasks more than once. In contrast, the false-negative cases completed nine tasks once and didn’t attempt only two.
The most significant difference between cases was in completion times. On average, the false-negative students started to engage with the quizzes at a later stage (on day 66 of the semester), whereas the true at-risk students started earlier (on day 55). The true at-risk students were, in this way, similar to students who were not at risk. An independent t-test confirmed that the differences between the false-negative and true-positive results were statistically significant (p < .001; Table 11).
Independent Sample t-test Between False Negatives and True Positives (Start Day).

False negative: Students who were at risk but could not be identified as such.
True positive: Students who were at risk and identified as being at risk.
Some students did not complete any quizzes, so their entries were excluded. Otherwise, the average start day would have been inaccurate.
The cutoff points used were based on Cohen (1988).
p < .01.
To summarize the findings regarding the false-negative cases, there seems to have been a group of at-risk students who, despite managing to complete the formative quizzes successfully, could not obtain good scores in their summative assessments. This group of at-risk students performed as well as their not-at-risk counterparts in the formative tasks but, notably, obtained these scores later than all of the other students. While there are few direct ways in which our prediction model could be improved, we may be able to complement it by carefully observing students’ performances on their first assessments to spot any strange or concerning results at an early stage as well as carefully noting when students begin to engage with the quizzes.
Discussion and Conclusion
The purpose of this study—conducted in the context of a large-scale EAP course at a higher education institution in Hong Kong—was twofold. Firstly, we aimed to investigate students’ levels of engagement with multimodal formative assessments. Secondly, we wished to explore the extent to which students’ levels of engagement in such assessments could predict their performance on their final assessments. Our findings have several implications. The results indicated that the students engaged extensively with the quizzes, and the process did not demand much time or effort from them. This is a positive finding. Each quiz focused explicitly on an area of study that the students were required to master in the course and demonstrate in their assignments. Even though doing well on these multiple-choice or true-false quizzes may not help students write an essay well, we found that students seemed to be able to apply the concepts learnt in course assignments, which could explain the predictive power of the quizzes. The quizzes were, as such, set at appropriate levels of language and skill. In this study, we have provided credible evidence that multimodal formative assessments can enable us to engage students and facilitate learning in a language-acquisition context. Identifying academically at-risk students at an early stage through the use of LMS data enhances our potential as educators.
Additionally, in the context of this study, we were able to identify the quizzes that had the strongest impacts on the students’ final course outcomes. The quizzes that pertained to core parts of the course or were seen as being useful (namely, Academic Style and Integrating Sources) were more likely to be completed by students. Likewise, the students targeted quizzes that related to specific skills—such as content, organization, and referencing—that they would need to demonstrate to attain certain grades; the students who performed poorly on these types of quizzes were more likely to be academically at risk. By the same logic, the students were less likely to complete the quizzes that they did not deem to be essential or immediately relevant to their studies; they did not prioritize the completion of such quizzes and sometimes did not complete them at all.
All of these findings were highly significant in helping us to identify students in the EAP course who was academically at risk. It should be noted that the students rarely completed the quizzes relating to presentation skills and language (i.e., the use of English). Even though these quizzes pertained to language skills and aspects of language that was assessed in the final course assignment (Delivering an Academic Presentation) and constituted a major part of the overall course weighting (presentation 40% and language 29%), the students may have completed similar presentation and language assessments in secondary school and therefore didn’t consider the topic new.
These results help us to understand how multimodal formative quizzes can facilitate student success and provide the type of content that L2 learners consider valuable in their independent study. The development of reliable prediction models will help teachers and course administrators gain insights into student behavior and learning progress so they can provide actionable, regular feedback in EAP programs.
The results of this study have several notable limitations, especially in relation to the relatively high proportion of false negatives. Certain aspects of academic performance cannot be predicted, such as student motivation to succeed in a compulsory EAP course and absence rates due to timetabling issues (EAP sessions often take place in the early morning or late evening and students are often juggling part-time jobs or heavy course loads). Future researchers should focus on gathering rich information by using both questionnaires and interviews to gather details that complement the LMS data. In doing so, they will be able to gain and share important insights into students’ perceptions of the interfaces and designs of multimodal formative quizzes, learners’ levels and sources of motivation, and how LMS platforms such as Blackboard can enhance the quality of course delivery. Such knowledge would assist in the development of future blended learning formative assessments as well as early prediction models. In addition, scholars could investigate how students complete quizzes in relation to their timetabled classes and their self-reported levels of motivation for completing the course.
Despite its limitations, this study identified a meaningful correlation between the ways in which—and the extent to which—EAP students completed multimodal formative assessments and their final course grades. The findings of this study confirm that educators will be better placed to identify and monitor students’ levels of progress, knowledge, and skill if they encourage them to engage with blended learning through an LMS (Hinkelman, 2018). Moreover, the high levels of engagement with the quizzes exhibited by the students demonstrate that well-designed multimodal quizzes can provide authentic and engaging L2 learning experiences (Park et al., 2016) and foster effective learning climates (Boelens et al., 2015). The implications of these results are significant for the future design of blended courses. Course developers and teachers need to collaborate to design suitable educational activities that promote relevant language skills. Such activities must not only be seen as immediately applicable to students but also of demonstrable benefit to them in their broader higher education studies. A key challenge for all those who are involved will be to stay up-to-date with technological developments to ensure that the blended learning activities continue to be engaging and attractive to students.
Having access to learner analytics allows teachers and course administrators to affect personalized interventions with each of their students. Moreover, such information enables them to adjust the content or format of their blended learning modules to meet the needs and interests of specific student cohorts (Thomas et al., 2017; Verbert et al., 2013; Vuorikari & Castano Munoz, 2016). As teaching and learning increasingly involve blended pedagogical approaches, combining pedagogical theory with the use of analytics is vital (Rienties et al., 2018). Educators are to understand and meet the needs of EAP students and meaningfully analyze their work to improve their learning experiences. In this study, we have shown that learner analytics can help educators to predict students’ academic outcomes. We hope that these findings will inform pedagogical practice and the design of learning activities, leading to greater academic success.
Footnotes
Author Contributions
All authors contributed to the research design and development, discussed the results, and contributed to the final manuscript.
Availability of Data and Materials
The datasets used and/or analyzed during the current study are available from the corresponding author on reasonable request.
Code Availability
The code used during the current study are available from the corresponding author on reasonable request.
Declaration of Conflicting Interests
The author(s) declared no potential conflicts of interest with respect to the research, authorship, and/or publication of this article.
Funding
The author(s) received no financial support for the research, authorship, and/or publication of this article.