
Abstract
With increasing research attention to user experience (UX), UX design (UXD) has gained concomitant interest. This study systematically reviews UXD research using a bibliometrical knowledge map. We collected and reviewed 14,825 documents to analyze UXD research from five perspectives: keyword trends, reference co-citation, author co-citation, categories, and author institutes. (a) UXD, as a research term, broadens the boundaries of experience and design and brings them together. (b) Publications in UXD focus on user, business, and technology orientation. (c) Author co-citation analysis reveals “invisible college networks” among UXD scholars. (d) Computer Science and Engineering are the most significant majors in UXD, although interdisciplinary research is common. (e) Research from the United States dominates. This review recognizes research gaps and future trends for conceptualizing and assessing UXD skills. The findings can benefit researchers, curriculum designers, and instructors.
Introduction
User experience (UX) and UX design (UXD) have attracted growing attention from the field of science, technology, engineering, and mathematics (STEM) education (Freeman, 1977). UXD is an extension of interactive technology in which the quality of interactive technology is studied from the perspectives of user emotional needs and user experience design instead of product structure and product functional quality (Hassenzahl & Tractinsky, 2006). Users are no longer satisfied with preliminary function needs, but care more about psychological needs and navigation experience. UXD is not only based on essential concepts of design research that considerably influence the society, but also is inseparable from modern studies addressing problems in STEM. Thus, design education must involve UXD as a basic learning objective to make students competitive in their future careers (Shin et al., 2017). The design frameworks used in education, industry, social media, and digital technologies have drastically changed in recent decades. For example, current management tools consistently generate product and graphic design innovations. These developments have diverted the scholarly attention to design science as an engineering practice and a science that engage both key disciplinary ideas and cross-cutting thoughts.
In contrast to previous studies, our systematic review is aimed at UXD research on application contexts, relevant constructs, evaluation methods, and their dependency and validity across all educational aspects. In particular, our review emphasizes UXD studies mainly in the contexts of the Internet of Things (IoT), artificial intelligence (AI), augmented reality (AR)/virtual reality (VR), unmanned vehicles, service design, interactive experience, and emotional design (Papadopoulos et al., 2020).
Definition and Significance of UX
The term “user experience” (UX/UE) is extensively adopted but interpreted in various ways. Broadly, it describes the interaction between users and products and has become a topic of the general concern in human–computer interaction and other areas, but there is no consensus on its meaning (Park et al., 2013). The multidisciplinary nature of UX has led to multiple definitions and research aspects, each bringing the concept from a unique viewpoint. The existing definitions vary from a psychological to a business aspect and from quality-to value-centric (Roto et al., 2011).
Psychologically, the American cognitive scientist Donald Arthur Norman proposed and promoted UX in the 1990s. Norman referred UX to as the behavior, emotion, and attitude of a person utilizing a certain product, system, or service. This UX process examines human–machine interaction in a user-centered manner (Norman, 1995). The International Standards Organization (ISO, 2010) insists that UX consists of a user’s feelings and responses (e.g., emotion, beliefs, preferences, physiological and mental responses, behaviors, and related influences) when using or taking part in a product, system, or service. Designing for emotion or experiences is a task unlike designing for usability, since preventing and fixing usability problems are aimed at avoiding negative outcomes from a product or system, while UX designing requires seeking for design chances to positively affect user emotions. In such contexts, designers require more empathy and skills, and this approach also brings new challenges for products or services (Vermeeren et al., 2016).
From the business perspective, user satisfaction is a critical goal in strategies for both product and service businesses (Gitman & Carl, 2005). For product innovation, most companies are eager to deeply understand user needs (Kankainen, 2003; Law et al., 2009). As the technological gaps between market leaders and their followers are standardized, companies know they cannot meet user needs only by state-of-the-art products or services (Baldwin et al., 2006). Additionally, these companies start to utilize a holistic way known as experience innovation, which covers the whole process of analyzing the experiences of all relevant stakeholders to identify clues for innovation (Prahalad & Ramaswamy 2012).
In terms of quality-centrality, UX is a multi-faceted concept that refers to the experience of and emotions related to using a specific system, product, or service (Setchi & Asikhia, 2019). UX has also increasingly attracted the field of industrial product and service development (Kaasinen et al., 2015), and people newly understand UX in the research field. For example, UX is defined as a person’s feeling of using products, services, or systems in a work environment, and how this feeling shapes one’s own as a professional image (Kaasinen et al., 2015). UX is also suggested as a dynamic phenomenon (Mahut et al., 2017a; Mahut et al., 2017b). The important components of UX are user and context, which originate from the characteristics of users and artifacts and interact in a specific context. On the whole, UX is presented as a multifaceted phenomenon involving subjective perception, and behavioral, expressional, and physiological responses.
In terms of value-centricity, scholars have proposed many frameworks for describing UX (Pucillo & Cascini, 2014). For example, UX is the relationship between users and products generated during the contact between them (Garrett, 2002). Other researchers assert that UXD shall be thoroughly analyzed from five elemental aspects, including strategy and extent (Begoñaa et al., 2020). Doi (2020) believes that the current emphasis on UX has changed from a product aspect (e.g., usability) to a user aspect (e.g., subjective experience).
Approach to and Practice of UXD
UXD is a design research field centered on UX concepts and covers the identification of target users, their demands, satisfaction ratings, and themes (Sauer, 2020). UXD is the key to system applications more researchers and institutions have recognized UXD, allowing for research integration with other disciplines, such as engineering (Masaakia, 2013), medicine (Latifi et al.,2020), management science (Karim et al.,2018), and psychology (Evans,2017). UXD research is currently focused on two aspects: approaches and practice.
From the perspective of approaches, Risdiyono and Koomsap (2013) put forward a design for customer approach. Specifically, customer needs can be converted into product variety or product specifications (as in mass customization and production systems respectively) to narrow the gap between what manufacturers can offer and what customers really need. Yadav et al. (2013) utilized the fuzzy Kano model in quality function deployment, aiming to analyze customers’ esthetic feelings as their satisfaction. Shin (2016) analyzed the UX of inter-platform services with a mixed method and proposed a concept of inter-usability for the design of user-centered systems. Through the study on multi-sensory collaborative experience design and the multi-sensory characteristics and context of product experience, Dong (2016) constructed multiple integrated scenes in a sensory user experience model.
From the aspect of practice, UXD can shorten the design process, reduce product costs, and significantly improve product desirability and user satisfaction (Aranyi & van Schaik, 2015). Fanfarelli (2018) explored the UXD of medical games and applications, proposed six UXD strategies, and applied them to actual game applications for verification. Araujo et al. (2019) systematically analyzed Scopus and investigated the role of gamification in improving and promoting UX. Therefore, companies invest numerous money and resources and use these concepts as an innovative scheme for market occupancy (Garrett, 2010; Kaasinen et al., 2015).
Evaluation and Assessment of UXD
Most of the literature does not explicitly differentiate UX according to a specific pre-adopted theory, but instead designates UX elements according to actual research problems (Park, 2019). UX is an integral part of design quality and importantly influences product design and improvement, especially for personalized products (Hao & Song, 2017). The product, as the actual carrier of UX, indicates that UXD includes usability, user emotional experience, and user demands. Hence, UXD requires strong understanding of user needs. Introducing UX in the design process improves product acceptability. However, the subjectivity of UX and its characteristics, which change over time, complicate UX evaluation, which prevents designers from understanding users (Li & Hltt-Otto, 2020). Although many studies highlight the composition of UX, quantitative research on UXD is still rare.
The UXD evaluation process involves three parts (user, product, and interaction). The product and its instrumental (e.g., utility, functionality, and usability) and non-instrumental (e.g., esthetic, symbolic, and motivational) qualities can be easily assessed. However, the user’s transient inner state and the product’s variable context are harder to interpret (Lin & Cheng, 2015). There are studies on developing experience measurements and evaluation criteria (Law et al., 2009; Stewart, 2015). Kansei engineering (KE) is a common technique that begins by semantically catching user feeling (kansei) about a product and further associates the kansei with potential design features (Okudan et al., 2013). UXD evaluation methods can be divided into three major classes (Figure 1): (i) user’s emotional state (predisposition, expectation, needs, move, and mood); (ii) features of products (complexity, aim, usability, and functionality); (iii) context of interaction (organizational/social setting, the significance of activity, and voluntariness of use; Hassenzahl & Tractinsky, 2006).

UXD evaluation methodology (Hassenzahl & Tractinsky, 2006).
While the existing studies focus on the method, practice, and evaluation of UXD, there is no study on using bibliometrics to summarize trends in UXD or data visualization study for knowledge map plotting. The present study differs from previous studies in three respects. First, we visualize the development route of UXD research and expand its dimensions. Aside from WoS, two more databases (SSCI and AHCI) were searched, which significantly expanded the survey landscape from natural sciences as in previous studies to social sciences and arts/humanities. Moreover, the index of center burst (CB) was added to highlight the intellectual transition point of a given research area. Second, to explore the development patterns of disciplines in UXD research, we established knowledge maps presenting relationships and time dimensions of UXD disciplines and detected which disciplines contributed to the pivotal nodes of UXD research. Finally, we predicted the development trends in UXD and plotted hot spot graphs of UXD research. We also offered references for future UXD researchers, and expanded the understanding of this research field, while promoting the contributions of UXD researchers to design science.
To achieve these goals, this systematic review probes into the existing status and characteristics of UXD studies and presents future trends on how to search, connect and evaluate UXD for different research objectives. The basis of this review consists of five research questions (RQs):
RQ1: What design research has UXD research been applied to?
RQ2: What is the internal connection of classic publications in UXD research?
RQ3: How do UXD researchers collaborate?
RQ4: In subject areas of in-depth cross-collaboration has UXD been involved?
RQ5: Which regions and institutions have UXD studies been conducted from?
Methods
Literature Search
In recent decades, the human–machine interaction technology has gradually penetrated other fields of human activities. UXD research now involves natural sciences, social sciences, humanities, and arts. Design frameworks used in education, industry, social media, and digital technologies have drastically changed because of the integration of UXD research. For example, the existing management tools have consistently generated product and graphic design innovations through UXD.
Journals offer a permanent record of research methods, results, and authorial activities. Many research institutions assess the academic prestige of organizations or individuals by referencing their numbers of publications included in the Social Sciences Citation Index (SSCI), Sciences Citation Index (SCI), or Arts & Humanities Citation Index (AHCI). Our evaluation of UXD publications will assist researchers in understanding academic trends and guide research institutions to assess research achievements.
To identify as many potential UXD-related articles as possible, “user experience (UX/UE)” and “design” were chosen as search terms. We gathered and stored data for concrete search terms by using “Topic” in the Web of Science (WoS) Core Collection. This Collection offers direct access to Citation Index databases, Science Citation Index Expanded, Social Sciences Citation Index, Arts & Humanities Citation Index (all from Clarivate), Citation Index Conference Proceedings Citation Index-Science, Conference Proceedings Citation Index-Social Sciences & Humanities, the Emerging Sources Citation Index (ESCI), and the Book Citation Index.
To understand how the field of UXD has changed over the last 20 years, we set the timespan between 1999 and 2019. The data retrieval was implemented on 1 January 2020, which initially returned 14,825 articles from 80 countries/regions and 21 languages. To maximally involve relevant information, we investigated each item with “Full records and cited references” in “txt” format, downloaded from WoS.
Analysis Strategies
Research on knowledge visualization resulting from knowledge creation and transfer among at least two units can be apprehended as all iconography means for plotting and transmitting multiple viewpoints. Knowledge mapping refers to the procedures, approaches, and tools for knowledge area analysis that are taken to unearth characteristics or meanings and systematically visualize them (Speel et al., 1994). The difficulty of mapping UXD knowledge is partially due to its complexity. One major step in knowledge processing is visual displaying of ideas, knowledge, and connections. CiteSpace, a platform to visualize patterns and trends in scientific literature, can quantify data by measuring different attributes of nodes in multi-view co-citation network graphs and displaying them as visualized graphs (Chen, 2014). The major estimated node attributes include centrality, times cited, emergence, and clustering. We also use the VOSviewer for visual networks. These networks may involve journals, researchers, or individual publications, and can be built on basis of citation, bibliographic coupling, co-citation, or co-authorship relations. Besides, Mapequation (http://www.mapequation.org/apps/MapGenerator.html) was adopted to provide a weighted image displaying the strengths of its component modules. The algorithm of this App was created by Rosvall and Bergstrom (2008).
So far as we know, no effort has been made to use CiteSpace to analyze design research literature despite the popularity of the platform (Chen, 2014). Herein, a UXD research database was established in WoS for 1999 to 2019. Then, CiteSpace was used as the main tool of data visualization knowledge mapping to describe the knowledge structures and development rules of UXD research. A co-occurrence matrix algorithm (He, 1999) was used to map and analyze co-occurrence networks. Co-citation is an effective tool to analyze the networks of publications (Small, 1973). We adopted keywords, categories, and co-citation networks as dimensions to organize the dataset of articles. The knowledge domains of UXD research subjects were mapped on CiteSpace. Then the routes and turning nodes of design research were clarified to forecast the developing trends of the field. Such analyses help UXD researchers to further understand the interconnections within UXD research and the connections of design research with other disciplines. Analysis of the existing UXD research literature on CiteSpace will clarify the advances of knowledge, theory, and the evolution of research topics. Therefore, the context and motivations of such analysis are highly desirable and meaningful for the development of design science.
After assessing 14,825 articles published on the WoS from 1999 to 2019, we visualized the data using Citespace. Two parameters viz. centrality and citation burst were extracted to recognize and visualize keyword networks and cited references.
Co-citation analysis
This analysis is a crucial tool to explore the advances of scientific studies. It measures the semantic similarity of two documents using the citation relationship. Co-citation is used in various science mapping papers to represent two procedures (Boyack & Klavans, 2010): citations of documents and of authors. The research methods of co-citation are interleaving and changing as the discipline develops better. Co-citation frequency measures how many other articles have frequently been co-cited in the current article. As the data presented with the threshold less than two times are too scattered and since there are few data with the threshold more than four times, we chose Co-cited more than three times. Compared to citation frequency, which only counts the times an article is cited, co-citation frequency better indicates the breadth of impact an article may have (e.g., one article may have a very high citation frequency, but focuses on a narrow area). If an article is co-cited with another article in the reference list, the former should have an impact on the field of the latter. Thus, we chose papers with high co-citation frequencies for analysis, by which we hope to cover a broader range of design research.
Citation bursts analysis
Citation bursts indicate the hottest research spots and provide proof about the association of a publication with a surge of citations (Kleinberg, 2003). A high-citation burst node is located at an intellectual transition point in a given research area. If a cluster involves many nodes with severe citation bursts, the entire cluster acquires a research hot spot or a new trend (Chen, 2006).
Centrality analysis
An important tool in CiteSpace helps identify betweenness centrality in scientific articles that indicate the importance of nodes in a network and the number of the shortest paths between nodes. It also implies the number of the above paths that cross the node. An article with high betweenness centrality is more important in a co-citing network (Li et al., 2017).
Citespace’s retrieval algorithm encodes and statistically analyzes the text according to five parameters (keywords, co-cited references, category, country, and author network) as per the steps of content analysis (Chen, 2014). First, a coding plan was established to categorize the data from each article in accordance with five questions. All data were stored and analyzed using an Excel spreadsheet. Second, based on the plan above, the first three authors were reviewed and coded from the same 10 randomly-selected articles. In this process, we modified the plan by adjusting and improving the types. Third, after the plan was stabilized, the inter-rater agreement of the Top 10 articles was independent of 91.8% of all the types. The modes from the reviewed studies were explained in detail to support the four research questions and are given in “Results” as well as cases for each type.
Results
Publication Analysis of UXD Research
The annual publication counts are shown in Figure 2. From 1999 to 2019, the annual publication count on UXD increased, except for a slight decline in 2001. A maximum of 2,080 recordings appeared in 2019 (Figure 2). Clearly, UXD has become an increasingly popular topic in research.

Annual UXD research publication counts from 1999 to 2019 in WoS.
WoS offers essential science indicators (ESIs) to organize leading papers that can be used to refine results and identify influential papers, journals, and research trends. We acquired the top papers in design research as ranked by ESI over the last decade (95 items), and display the quantitative distribution in Figure 3. Data show there are a few ESI articles in the field of UXD. The main reason for this result is that the development history of the design science is relatively short, and there is no large-scale accumulation of discipline research. Since 2015, the number of articles published has gradually increased, indicating that the research on UXD has become a hot topic in recent 5 years, but the development is relatively slow.

Distribution of ESI papers in design research from 2009 to 2019.
Top 10 publications citation bursts for UXD
The academic value and influence of an article can also be assessed by the CB index, in addition to the citations and the popularity of authors. The red and green bars stand for the highly and infrequently cited keywords respectively. Papers published after 1996 with citation bursts (Table 1) may turn into new intellectual transition points, with remarkable future influence on the progression of UXD research. Alternatively, they may imply the rapid uptake of UXD ideas in a cognate field. The No. 1 source for CB strength from 1999 to 2019 was Designing the User Interface (1997; Table 1), indicating its strong influence in UXD research. This book provides practical interface design techniques and guides and helps readers rapidly learn and build higher-performance and less errorful systems with higher user satisfaction (Suess, 1997). The second-ranked publication, Designing Web Usability (2000), provides users with complete guides to establish contact under any condition and with any web user (Nielsen, 2000). The third dominant publication, Basics of Qualitative Research (1998), educates researchers in qualitative data analysis, explanation, and apprehension and in setting up theoretical methods. This publication is an influential reference for qualitative research (Strauss & Corbin, 1998). Analysis of the studies above indicates that studies reporting innovation or new ideas for traditional research methods and/or formulating standards are more likely to be transiently and extensively cited and become hotspots.
The Top 10 Publications Ranked by Citation Burst With UXD.

Keyword Analysis of UXD Research
Main keywords
Since keywords represent the core contents of articles, keyword analysis can recognize emerging frontiers of a knowledge field (Callon et al., 1991; He, 1999; Lee & Su, 2010). Keyword co-occurrence and frequency in studies on UXD were analyzed to plot the word clouds (Figure 4). A keyword cloud is the result of a set of keywords and their frequency of use after the application of similar tag cloud visualization techniques. The font size of each keyword in Figure 4 is proportional to the frequency of citations.

Keyword cloud map with UXD.
From 1999 to 2019, hot keywords in UXD research indicate that researchers have paid close attention to these research topics. The literature search words design (1,437) and experience (1,272) present two different colors and two keyword clusters (Figure 4). The design includes Care (554), User Experience (546), and quality (432). The experience includes impact (540), management (430), and environment (273). Hence, in the UXD domain, experience and design have their own priorities, but UXD broadens their boundaries and brings them together.
Keywords on citation bursts
Citation bursts can detect the sudden citation intensity of each periodic keyword, or can detect keywords at the time dimension, Citation bursts until 2019 may modestly embody the newest trend in this field. At the time dimension, these keywords on citation bursts since 1999 are shown as blue dots in Figure 5. In the findings, the keyword “substance abuse” lasted for the longest time (1999–2012). Although the main research topics in UXD have not changed since 1999, the keywords detected by citation bursts did not appear repeatedly. Citation burst duration indicates the heat of the keyword within the time interval. However, the end of a citation burst of a keyword is not a sign of the collapse of the surrounding area, because of terminology updates, new melds, or changes in the area. For example, Biomedical, Engineering had the shortest burst duration, ending in the early 2000s. The keywords of engineering continually developed to 2009 in the later period combined with civil, as shown as red dots in Figure 5.
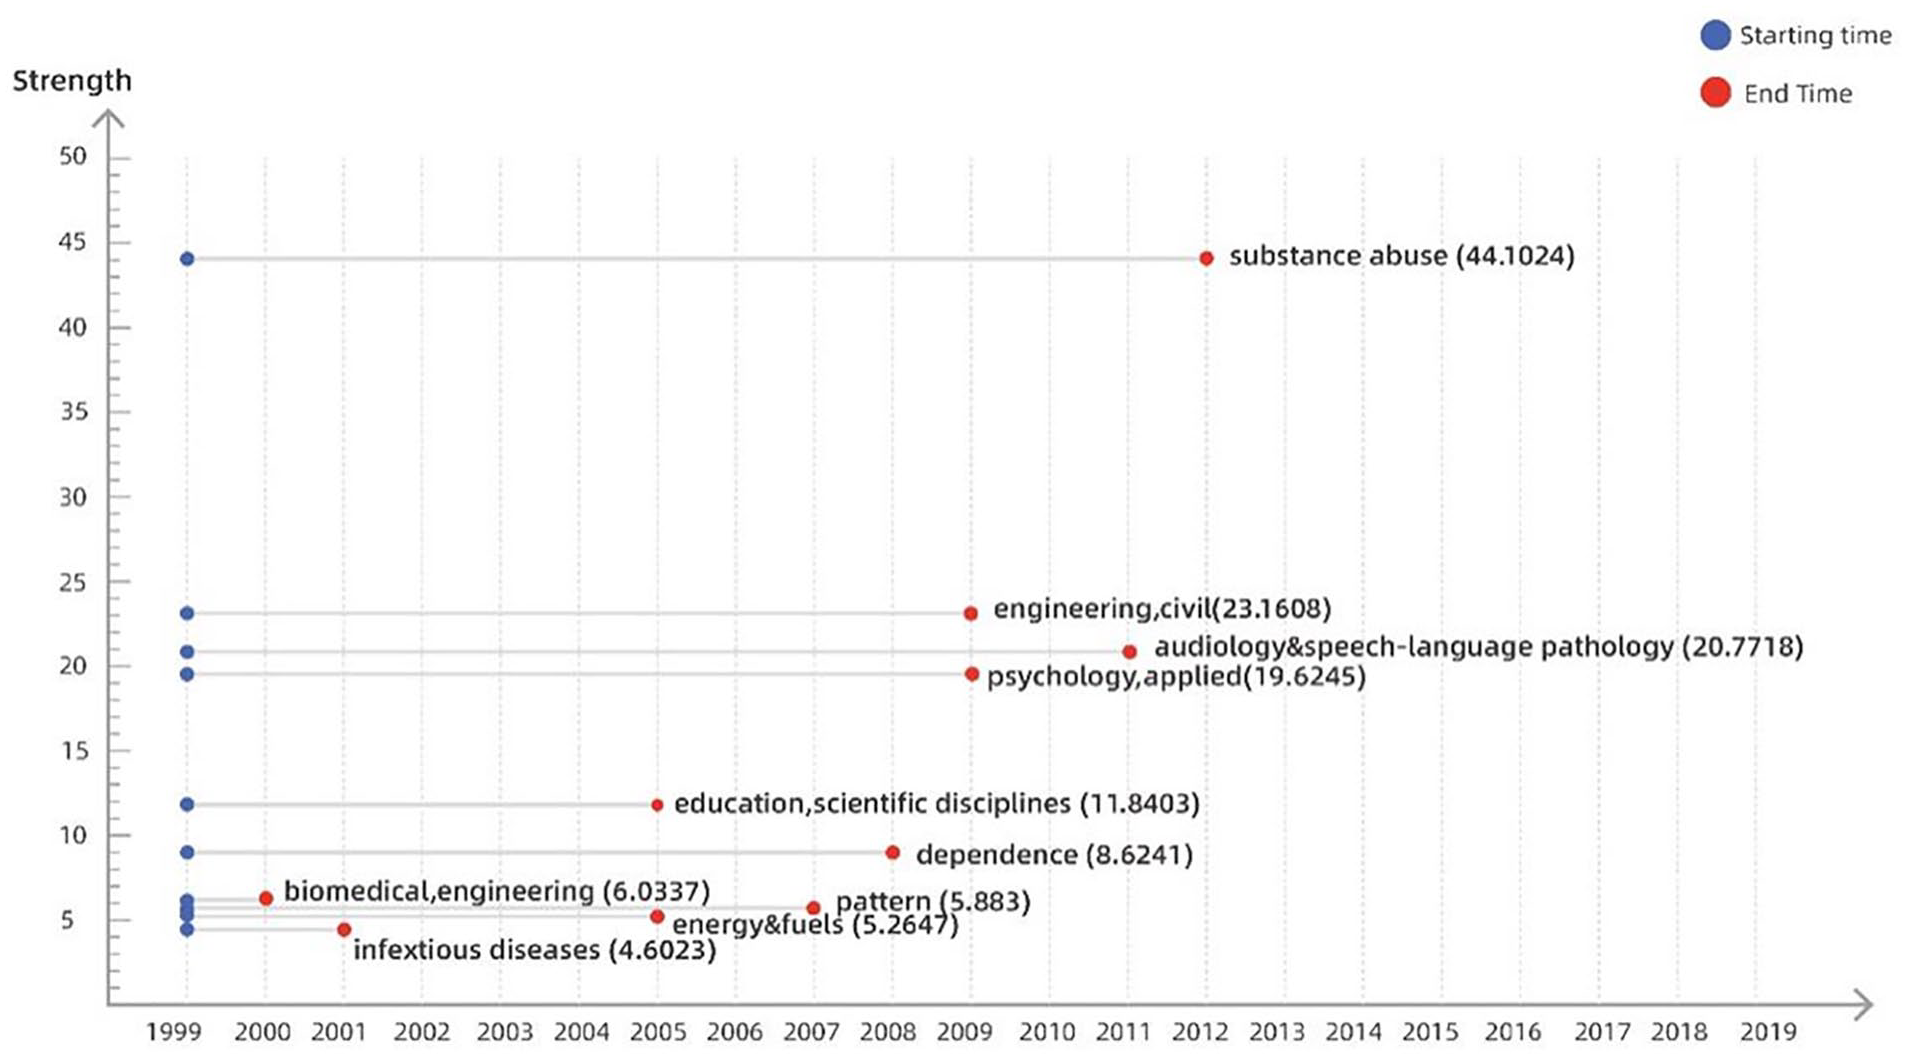
Keywords with burst duration until 2019.
Keyword evolution
Figure 6 demonstrates the citation relationship between modules, and the map reveals a structure in which all modules are interconnected via citation chains. For example, “usability” has been extensively cited in the field of user interface and finally evolved into “social media.” These links are not direct all the time because modules on opposite sides are connected via intermediate modules. Figure 6 provides a keyword screen view about the relationships among UXD research concepts and reveals the periods and directions in keyword evolution.

Weighted map of keywords based on citation patterns.
How a keyword cites or is cited by other articles is another matter to be explored. Each module in the image stands for a cluster of nodes, and the weighted and directed connections between modules imply the citation flow and the between-module relationship. The width and color of arrows represent flow volumes. The physical size of each module refers to the time used at a node by a random walker as per the citations within the module, and inter-module arrows suggest the direction of a citation: A → B means “A cites B” (Rosvall & Bergstrom, 2008).
Noticeably, these links were not direct all the time, as modules on opposite sides were only gathered by intermediaries (Rosvall & Bergstrom, 2008). For example, though quality improvement rarely relates to cultural heritage or vice versa, the two are strongly linked to intermediaries and thus ultimately link to each other. One linkage is: cultural heritage → vision → aging→ design thinking → family → canada → quality improvement, and another long linkage: focus group → stakeholder → co-creation → hospitality → user-generated content.
Keywords
In general, keyword analysis is a feasible method to unearth research frontiers (He, 1999). Based on citation frequency and the VOS viewer, we created a heat map (Figure 6) to present the new “hot” areas of design research. Each point on the map is colored based on the density of items at that point. By default, red indicates high density and large numbers of items; conversely, a smaller count of items around a topic will have lower weight and bluish color. According to the high cited frequency (Figure 7),there are always four hot spots: design, user experience, health research, and technology. Interconnection was found between design and UX and between user experience and technology, indicating that UXD researchers paid more attention to the relationships between these keywords. Along with the advancement of science—technology and the continual improvement in UXD research systems, other keywords such as model, care, and usability have also become hot spots in this field.

Heatmap of keywords created on the VOS viewer.
Article Analysis of UXD Research
Co-citation analysis
An article co-citation network facilitates studies on the structure, dynamics, and paradigm development of a given research field. Co-citation frequency, an indicator of the level of research activity or hotness, can uncover the cluster types and key nodes of current research and help to accurately follow research trends in this field. Figure 8 shows the article co-citation network in UXD research (see for readability, the nodes with too small thresholds are hidden from the graph).

A document co-citation network with 2,063 nodes and 2,050 edges.
Top 10 most-cited documents for UXD
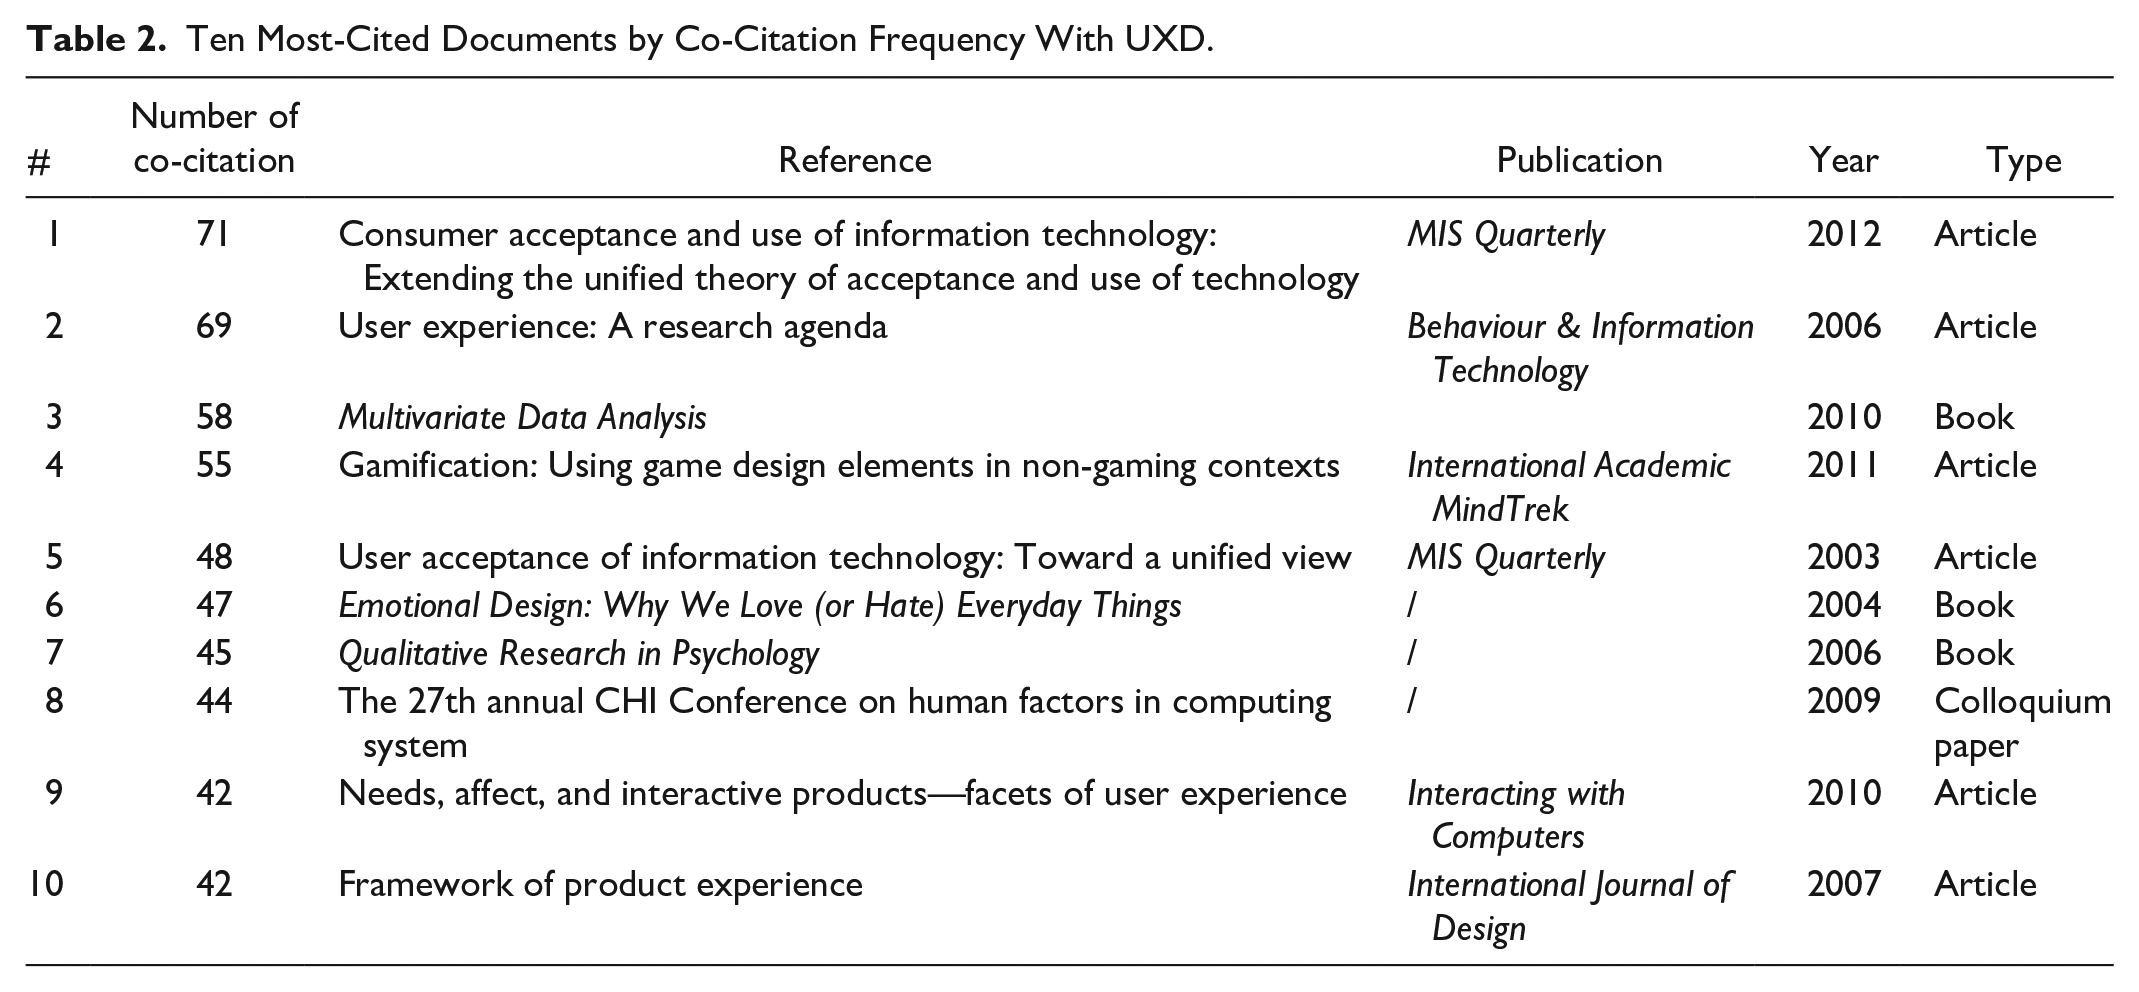
The 10 most cited documents by co-citation frequency with UXD are shown in Table 2, including articles, books, and reviews. Co-cited frequency refers to the total number of articles cited at the same time as other studies cite the cumulative number of results. Evidently, the most-cited paper in UXD research is “Consumer Acceptance and Use of Information Technology: Extending the Unified Theory of Acceptance and Use of Technology (UTAUT)” published in MIS Quarterly in 2012, which was cited 71 times (Table 2). In this study, UTAUT was used to analyze consumer acceptance and technology use and to validate the underlying influence factors (Venkatesh et al., 2012). The second most-cited paper is “User Experience: A Research Agenda” published on Behavior & Information Technology. In this study, Hassenzahl and Tractinsky (2006) discussed implications and future trends in UX from three aspects: instrument, emotion and affect, and experience. The third most-cited publication is the book Multivariate Data Analysis, which has been cited 58 times. In this book, Hair et al. (2011) simplified many statistical studies into fundamental concepts, and thereby explained to students how to understand and use the results of specific analytical tools.
Ten Most-Cited Documents by Co-Citation Frequency With UXD.
Author Analysis of UXD Research
This analysis emphasizes interconnections among authors in a certain field, which can be identified by detecting the co-existing frequency of independent works from different authors in the bibliography. When two authors are more co-cited, they are more closely related intellectually. The network shown in Figure 8 has 823 nodes and 1,343 links (the nodes with too small threshold values are hidden from the graph for readability). Each node indicates one cited author, who is provided with citation tree rings around several time slices: the area of each node approximates the total co-citations of the relevant author. The nodes in the map stand for co-cited authors, and the between-node lines indicate co-citation connections. The larger the node area, the greater the number of co-citations. A spectrum of colors suggests the temporal ranking of co-citation author connections among cited authors: purple and yellow imply the oldest and freshest links, respectively. The ring radius of one node is proportional to the co-citation author in the relevant time slice (Chen, 2006; Figure 9).

An author co-citation network with 823 nodes and 1,343 edges.
Top 10 by co-citation centrality for UXD
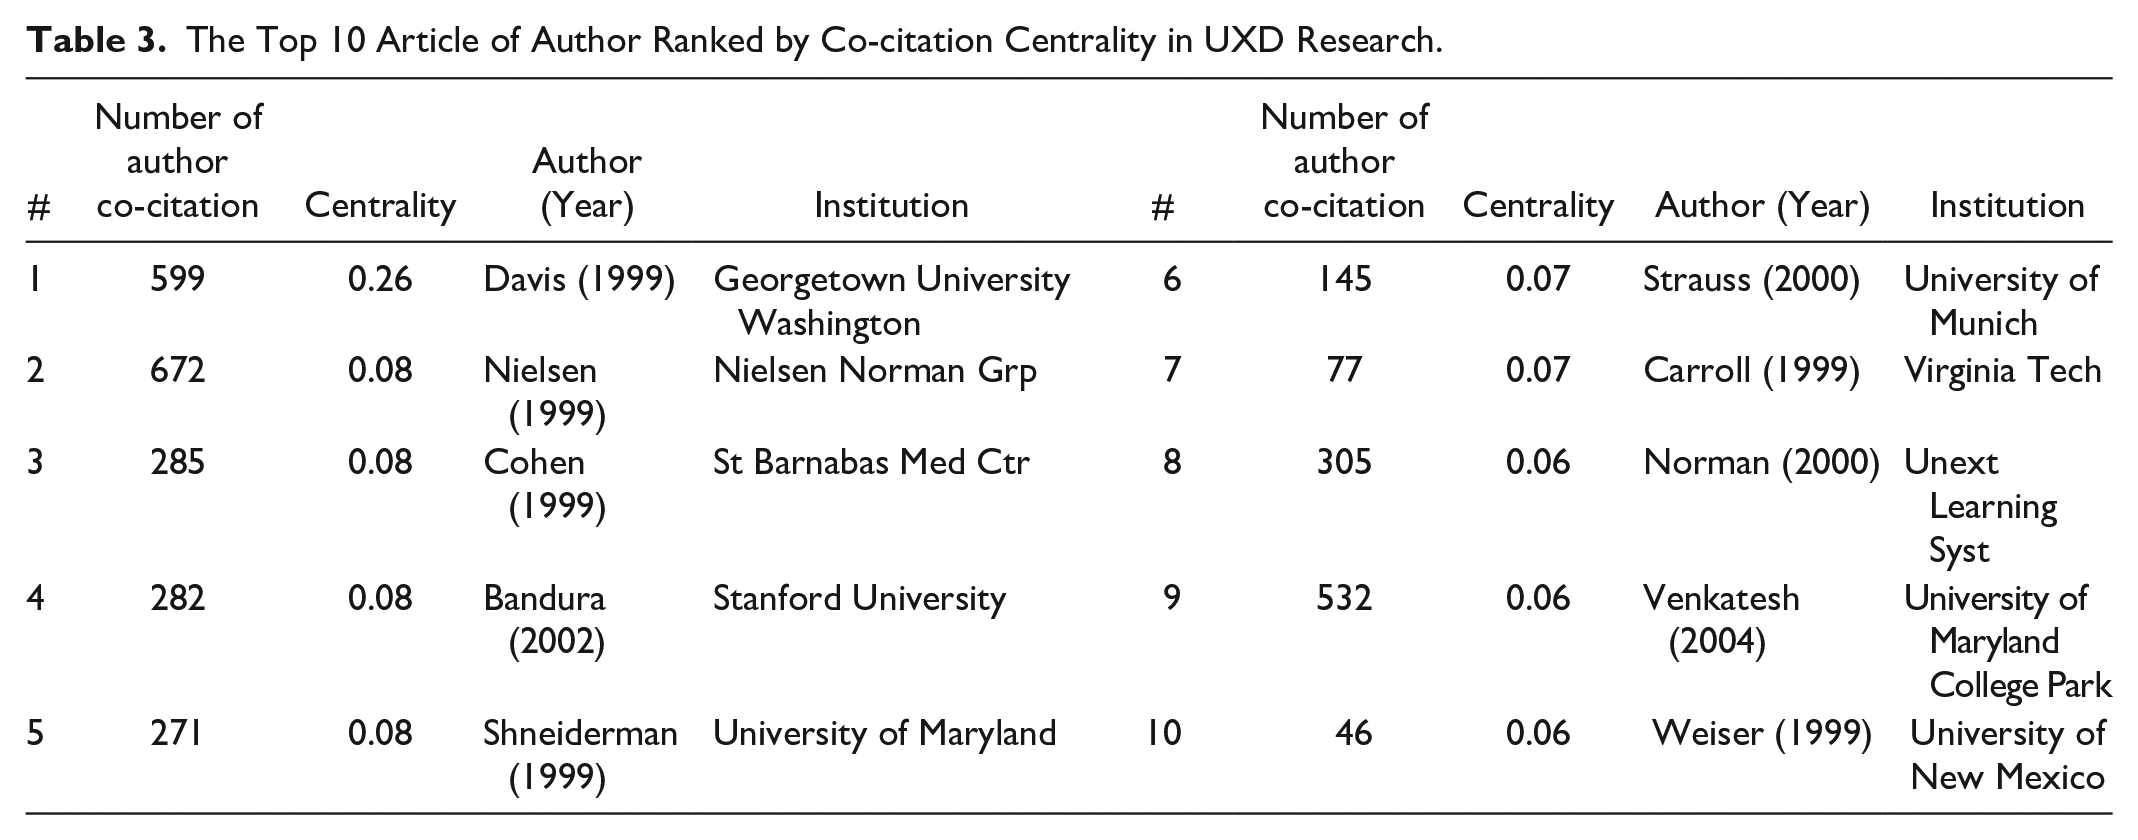
Centrality refers to the number of short-route stretches for all vertices that cross the node. Based on the assumption that item transport obeys the shortest possible path, a high-centrality node predominantly affects item transfer on networks (Freeman, 1977). During our knowledge graph analysis, centrality was employed to measure the closeness of one node to other nodes and to reflect the influence and significance of the node in the network. In total, our database contains 14,816 authors, and we list in Table 3 the top ten scholars scored by productivity in UXD-related journals for a different major from 1999 to 2019. Comparison of the authors’ institutions demonstrates that the majority of institutions are from the United States, which may lead to a relatively close cooperative relationship between institutions. The research areas of these authors can be roughly divided into four categories: Health care science and services, computer science, theory and methods, and human-computer interaction. These research directions are also reflected in the co-occurrence frequency of subjects (Table 5), and are hot spots of UXD research. These most-cited authors include the approved pioneers who initiated the concept of national UXD research. For example, Davis (1999) had the highest centrality (0.26). Other authors with high centrality included Nielsen (1999), Cohen (1999), Bandura (2002), and Shneiderman (1999), and these four papers all have high centrality of 0.08, ranking the second.
The Top 10 Article of Author Ranked by Co-citation Centrality in UXD Research.
Top 10 citation burst authors for UXD
As for the temporal dimension, Table 4 demonstrates the contributions to UXD research from the 10 top-ranked co-cited authors from 1999 to 2019 analyzed by citation burst detection. First, the research activities of the Top 10 authors all started in 1999. Compared with other authors, Preece J, Carroll JM, Dix A, and Belkin NJ all had longer CB citation burst times, as they lasted from 1999 to 2010.
Top 10 Citation Burst Authors According to Co-citation Links With UXD.

Category of UXD Research Analysis
Disciplinary distribution
During the development of UXD, researchers have conducted extensive studies by combining UXD with different subjects, including ergonomics, medicine, informatics, commerce, and economics. Table 5 lists the classifications and frequencies of the disciplines involved in UXD research.
Co-occurrence Frequency of Subjects Involved in UXD.

Interdisciplinary distribution
The top five subjects included in UXD research from 1999 to 2019 were Computer Science; Engineering; Computer Science, Information Systems; Engineering, Electrical & Electronics; and Telecommunications. Researchers have deeply studied UXD in computer science, so studies from computer science are highly influential in UXD research. Figure 10 demonstrates the subjects involved in UXD and the relationship strengths of UXD in different subjects. A larger node area indicates a higher frequency. The purple ring stands for centrality, and nodes with high centrality are regarded as pivotal in the literature.

Discipline network in UXD research.
Table 6 elaborates the duration of influence from the Top 10 disciplines in precise citation bursts. In Citespace, the burst detection algorithm was used to detect burst words with high-frequency change and fast frequency growth by examining the time distribution. With the help of these citation bursts, possible developing trends in UXD research were elaborated from the aspects of time and influence, and the influence, duration, and contribution of each discipline were clearly illustrated from the time dimension. The top three disciplines ranked in terms of CB strength from 1999 to 2019 were pharmacology (24.7315), optional assessment and management science (22.2931), and physics (13.2803). In particular, pharmacology has the highest strength and longest duration (up to 13 years). The reason may be that pharmacology is an excellent primary discipline, and life science has always been an influential category of natural sciences.
Top 10 Highly Ranked Citation Burst Disciplines With Burst Duration.

Regions and Institutes Driving UXD Research
Distribution of countries
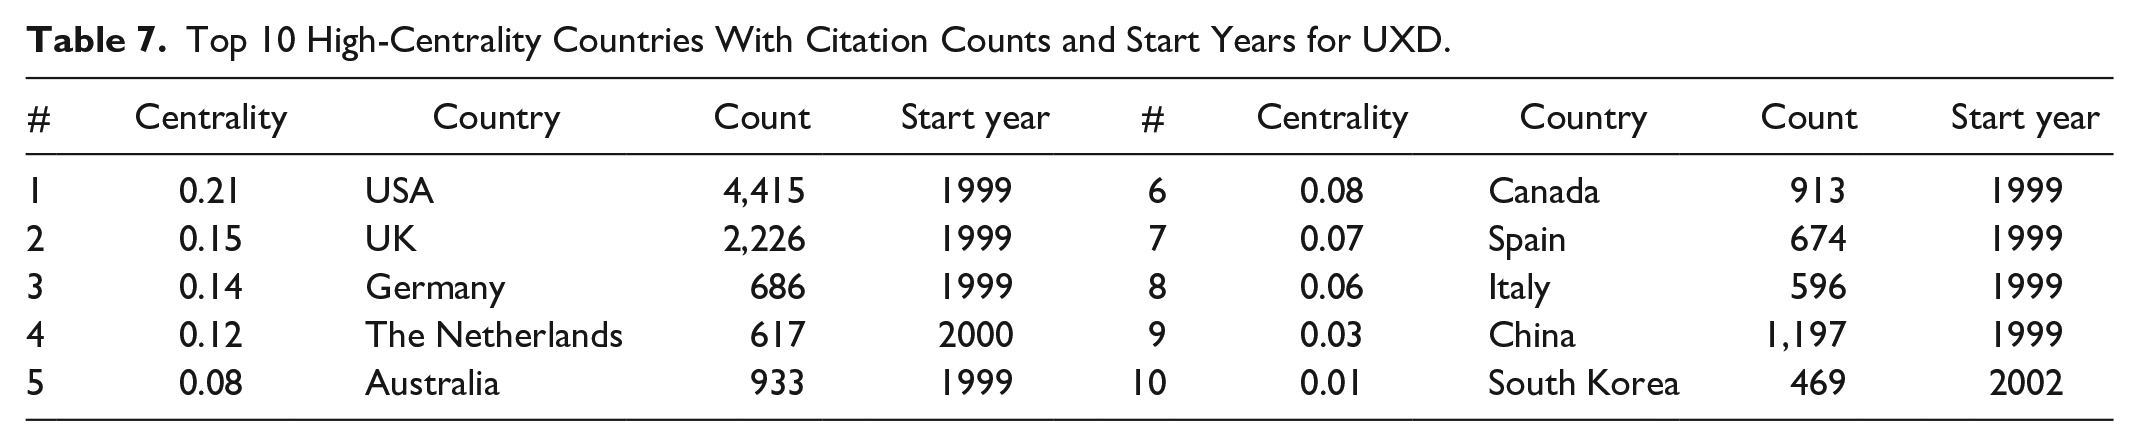
As a hotspot in many research fields in recent years, UXD research has attracted attention from many countries. The spatial distribution of UXD studies visually reflects disciplinary associations among countries/regions. In our study, we ranked the number of UXD documents from different countries/regions over the past 20 years. The top five countries/regions were the USA (4,415), UK (2,226), China (1,197), Australia (933), and Canada (913), which possess the dominant positions and influence in UXD research. Furthermore, the number of documents from the USA is twice that of the UK, indicating the dominance of USA in UXD research achievements.
Table 7 lists the top ten high-centrality countries for UXD. This finding reveals the global position of a nation related to UXD research since 1999, and the USA is absolutely dominant and leading in UXD research. The UK and Germany rank second and third, respectively. Despite its large number of publications, China did not rank top, so the publication quantity of a country does not necessarily stand for its influence.
Top 10 High-Centrality Countries With Citation Counts and Start Years for UXD.
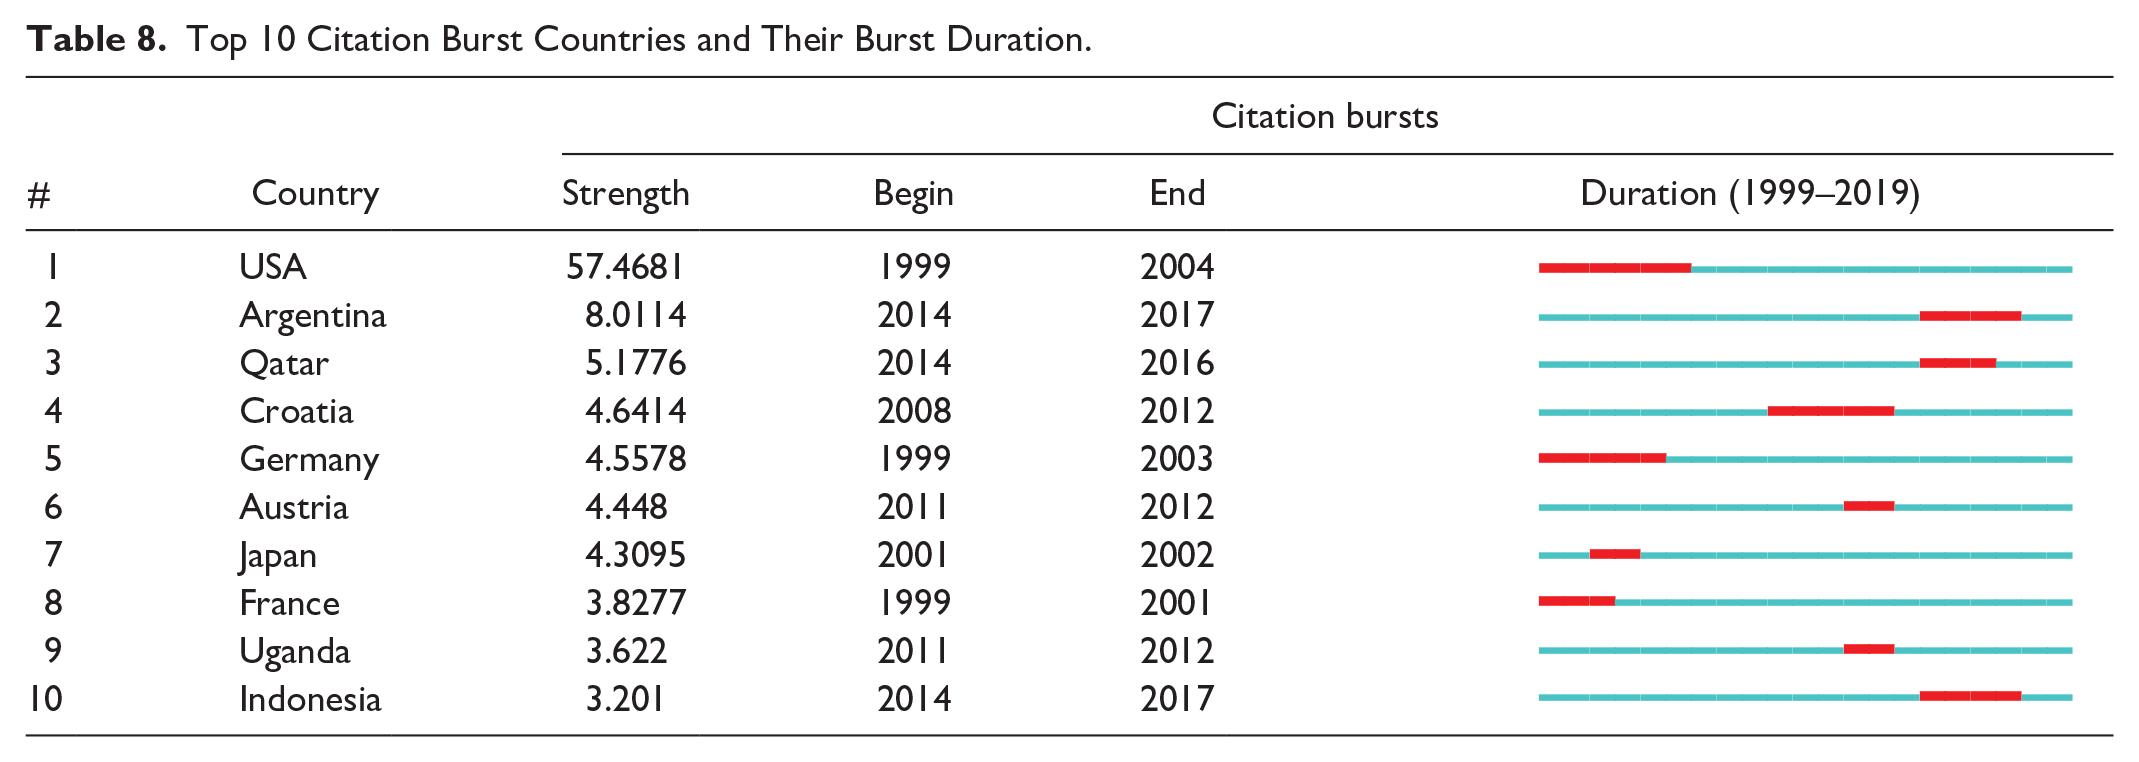
As for the time dimension, Table 7 shows the contribution to UXD research from the top ten countries based on citation bursts. Although it burst the earliest in the USA, France, and Germany (all in 1999), the first place was consistently held by the USA (Table 8). In addition, the Top 10 countries only involved three developing countries: Argentina, Croatia, and Uganda. Although the citation bursts in Argentina and Croatia only started in 2014, their strengths ranked in the top three. Therefore, citation burst time is not the only influencing factor of strength. Noticeably, Uganda started citation bursts in 2011. According to WOS database, Ware et al. (2011) in their highly-cited article on UXD in Uganda used quantitative and qualitative surveys to aid medical and public health research. This article has been cited 178 times. Subsequently, most of the articles are related to health care experience design research (Meessen et al., 2011; Semrau et al., 2016).
Top 10 Citation Burst Countries and Their Burst Duration.
Distribution of contributing institutions
The global distribution of research institutions in Figure 11 is consistent with the geographical locations of the major UXD research nations. The size of the spot in Figure 11 indicates the number of publications in that area. However, as for the distribution densities of research institutions, the networks are broader and denser and form groups in Europe and the USA. In comparison, China, Australia, and Canada have released large numbers of publications, but their institutions are scattered, and the publications mainly come from only a few research institutions.

Geographical distribution of institutions with UXD publications.
The Top 10 institutions (Table 9) ranked by the number of UXD publications are King’s College London (164), University of Toronto (154), University College London (152), the University of British Columbia (145), and the University of Manchester (134), of which three institutes are from the UK. Among the top 20 institutes organized by the number of publications, eight are from the USA, and five are from the UK, indicating the institutional dominance and continued success of these two countries in UXD research. In the Asia-Pacific region, however, only a few institutions have conducted UXD studies.
Top 10 Institutions of UXD Publications.

Discussion
UXD is a rapidly developing field that has been studied for two decades. In this systematic review, we mapped the current domains of UXD research by crossing all high-quality UXD-related publications, determining their contents and rearranging the research gaps. CB indicators were applied to identify and characterize the keywords, dominant articles, countries and authors, visualize UXD research, and represent the evolution map and research trends.
First, most studies on UXD focused on design-related hot issues in technological fields. Keyword analysis was our major contribution. By the end of 2019, ongoing citation bursts, keyword evolution, and changes in hot keywords provide promising backbone nodes for the whole keyword network. In sum, keywords experience, technology, model, and care stand out in the heat map, which seems to strongly focus us on “design thinking.” Additionally, a prominent link of cultural heritage → vision → aging → design thinking → family → Canada → quality improvement is highlighted in Figure 5. This offers a feasible way to build concept networks for UXD research and contributes to the merging of design research.
Second, analysis of the most-cited documents implies that publications in UXD concern the user, business, and technology orientation. This analysis also allows us to recognize the turning points for new research directions and the burst frequencies for the speed at which new ideas are taken up. Moreover, the journals publishing the most-cited documents are not necessarily relevant to UXD issues, indicating that journals from other fields are cited multiple times in UXD research, which contributes to the interaction of UXD research with other disciplines.
Third, combined analyses of authors, institutions, and collaborative research among authors clarify invisible colleges, the figures who connect one sub-field and one phase of the UXD research program with another. Unsurprisingly, it screens out some principles that work in support of UXD (Nielsen) as well as scholars who are dominant in more than one subfield (Cohen for human factor engineering, Bandura for psychology, Strauss for and Norman for next-century interfaces).
Fourth, as for the contributions of nations and institutions, massive UXD publications are concentrated in the USA, the UK, and China, but the institutions are mainly distributed in the USA and Europe. The distribution of studies may thus vary across design majors, institutions, countries, regions, and over time. These research targets were selected based on nation-specific standards and guideline patterns. Nevertheless, as UXD research is further internationalizing, more nations and institutions are seeking international cooperation.
Fifth, the language of UXD publications is too simple and deserves more attention. The analysis also uncovered the leadership of Anglo-American journals, scholars in the selection of data sources (WoS), and document types (journal articles). Among the UXD-related journals, 22% are from the UK and USA. This dominance also reflects the economic weights and scientific and technological progresses of Anglo-American societies and institutions and the influence of English as a scientific lingua franca.
Conclusion
This literature review analyzes UXD research and reveals existing gaps and future trends to conceptualize and monitor UXD skills.
UXD has been developed and applied differently in different research contexts. We identified internal connections and external extensions of the design research. The disciplinary consistency of a specific UXD research field unearths the degree to which each field has been shaped by merging disciplines and their corresponding functions. Each relevant article in WoS was ascribed to one or more subject types, according to the place of the journal published.
Much work has been done, but more is still needed. Particularly, UXD researchers and UXD developers shall consider five takeaways. (a) Health research and technology have always been the focus of UXD researchers. With the advancement of science and technology and the continuous improvement of UXD research systems, keywords such as model, care, and usability have also become hot spots in this field. (b) Most of the classic publications on UXD are related to computer science and interface interaction. Innovation or new ideas for traditional research methods and/or formulating standards are more likely to be transiently and extensively cited and become hotspots. (c) Cross-disciplinary collaboration among researchers is especially needed. Eminent scholars in this field usually engage in collaborative research in many fields. (d) UXD is involved in in-depth cross-collaboration in subject areas. UXD is adopted and integrated into various domains, which brings challenges and opportunities. Relevant disciplines for co-occurrence include computer science, engineering, information systems, and telecommunications. Although medical informatics, psychiatry, and educational research are much smaller disciplines than UXD fields, they are also significant references. (f) English is the main language used in UXD research journals, and this advantage also represents the economies of scale and technological progress of the Anglosphere. Nevertheless, research breakthroughs from the developing world cannot be ignored.
The application of bibliometric methods to the quantitative visual analysis of design research in this study will be informative for design researchers and support the sustainable development of this field. Such information will facilitate the flow of design knowledge and ideas through international collaboration. However, as an emerging academic field, UXD science lacks academic stature compared to other more-established fields. Thus, UXD researchers should be motivated to publish their studies in design-related journals, which will improve the influence of UXD. This is a long-term task for the design community, which will build the future of UXD research.
Limitations and Future Work
Despite several instructive conclusions that guide researchers into UXD in the last decades, this study still has some limitations related to the methods. Co-citation network analysis returned 15 major clusters with many small clusters, which may facilitate critical information from these ignored small clusters. Other approaches besides bibliometrics, such as meta-analysis and systematic review, can bring their own perspectives, which may remarkably change the conclusions. Moreover, these methods may be compared and combined to complement each other. With suitable methods, more scientific, more convincing conclusions can be drawn to further understand UXD.
Footnotes
Declaration of Conflicting Interests
The author(s) declared no potential conflicts of interest with respect to the research, authorship, and/or publication of this article.
Funding
The author(s) disclosed receipt of the following financial support for the research, authorship, and/or publication of this article: This study was funded by Project 202101042004, supported by the Chinese Ministry of Education, and by Project JUSRP1093ZD, supported by the Fundamental Research Funds for the Central Universities.