
Abstract
With the development of Information Technology and Internet of Things, using unobtrusive sensors to monitor the home-based behavior of the elderly, and assisting the care givers to make care decisions based on this data plays an important role in ensuring the health and safety of the elderly living alone. Adopting the Design Science Approach, this study designs, implements, and evaluates a care decision support system based on home-based behavior of elderly. This system preprocesses the behavior data collected by sensors and divides it into Instantaneous Behavior data and Continuous Behavior data. Adopting Multivariate Gaussian Model and Topic Model, this system automatically provides the visualized results of overall analysis, baseline analysis, and long-term analysis. It can assist caregivers in finding early signs threatening elderly’s health and safety, and making care decisions. Three caregivers with more than 1-year relevant experience participates in the evaluation, and the results indicate that the system designed in this paper has more support effectiveness. This system provides a more effective tool of supporting caregivers making decisions for elderly living alone.
Introduction
With the increase in the aging of the population, senior care has become a major issue in many countries. “Aging in place” is the choice of many elderly (Huh, 2018), but chronic diseases and their complications may affect these independent elderly’s health, safety, and quality of life (Zhu et al., 2018). With the development of Information Technology, remote monitoring systems based on Internet of Things and sensor technology have been widely used in hospital or home setting (Bravo et al., 2016; Carrington et al., 2018). These systems can monitor the behaviors and symptoms of the elderly for a long time and find early signs threatening elderly’s health and safety. They can assist caregivers in making care decisions (Colnar et al., 2020).
According to the theory of behavioral medicine, people’s daily behavior cannot only affect the health, but also reflect potential health problems (Marcelino et al., 2015). A small change in the behavior of the elderly may contain early warnings of their health and safety (Zhu et al., 2018). Integrating unobtrusive, ambient sensors into an elderly’s living environment, and supplementing with data analysis techniques may provide an efficient way to provide the necessary monitoring required for older people to “aging in place” (Herbert & Molinsky, 2019). Some studies in the field of medical informatics have explored the using of behavior data to assist caregivers in making care decisions (Chung et al., 2017; Folter et al., 2014; Lee et al., 2020; O’Brien et al., 2012). However, there are still some problems that have not been solved. On the one hand, these studies couldn’t give an overall judgment on the behaviors of elderly. When there are more elderly people to serve, the overall behavior judgment can help the caregivers to quickly identify the elderly who may have abnormalities, and can improve the efficiency of their care decision-making. On the other hand, these studies couldn’t identify elderly’s behavior routine clearly. The behavior routine of the elderly has a great potential impact on their health, and the sudden change of the behavior routine often means that the elderly’s body or life has undergone significant changes.
In order to solve these problems, this study designed care decision support system using the monitoring data of elderly’s home-based behaviors. This system performed overall behavior judgement with Anomaly Detection of multiple behaviors, and behavior routine analysis with Topic Model. Then the visualized results were feedbacked to caregivers to assist them in care decision making. The effectiveness of this system was evaluated through experimental and comparative analysis.
Related Works
Increased information technology in the clinical and home setting has added the complexity and influence of Care Decision-making Support. More and more studies have used different types of data and methods to support care decision-making, such as diagnostic data (Greenes, 2011; Hekmatnejad et al., 2019), meteorological data (Chen et al., 2012), and medical and physical sign data (Haraty et al., 2015). Moreover, using data of elderly’s body movements collected by wearable devices, some studies have recognized and predicted the occurrence of falls. And then they could activate the fall protection facilities and assist in decision making (Sung et al., 2020; Yu et al., 2009). Although these researches in the field of care decision support provided some methods to help caregivers make correct and timely decisions, they were inadequate in some ways. Decision support using meteorological data is not sufficiently targeted and personalized. Decision support using physical signs and fall detection data can often only be triggered when the elderly’s health has deteriorated significantly, or accidents have occurred. It is difficult to realize early detection and early prevention of these damages. Prevention of diseases and accidents is as important as treatment and remediation (Sung et al., 2020).
In addition to meteorological and physical signs, the daily behavior of the elderly is also a type of data source. According to the theory of behavioral medicine, people’s daily behaviors can reflect their health to a certain extent, and even reflect potential health problems (Marcelino et al., 2015). Therefore, it is of great value and significance to identify the potential health problems of the elderly and help caregivers make care decisions by analyzing their daily behaviors data. O’Brien et al. (2012) proposed a system to visualize the home-based behavior data of the elderly by using Density Map and Building Structure Map. Folter et al. (2014) built a system to visualize the home-based behaviors data of the elderly by using the Line Chart and Scatter Plot, so as to improve the efficiency of nursing. Chung et al. (2017) used the Work Flow to visualize the home-based behaviors of the elderly and identify the implicit behavior routine.
These studies have made good attempts, but there are some deficiencies. On the one hand, these studies fail to judge whether abnormal the behaviors of the elderly are or not as a whole. For example, Folter et al. (2014) emphasized the analysis of single behavior and lacked the analysis of overall behaviors. Although O’Brien et al. (2012) and Chung et al. (2017) considered various behaviors, the former only focused on the spatial information of the behavior, and the latter focused only on the chronological order of the various behaviors. In practice, the overall judge of behaviors will be helpful to make care decision. On the other hand, most of these studies couldn’t identify elderly’s behavior routine clearly. Although Chung et al. (2017) visualized the chronological order of the behaviors with WorkFlow, it was difficult to identify the behavior routine from WorkFlow. In practice, the behavior routine and its change are important to care decision-making.
Based on this, the objective of this study is to design a Care Decision Support System that could address the problems of existing studies. The Design Science Approach can create, implement and evaluate the innovative artifacts to help solve identified problems. And the goal of it then moves beyond offering explanations of phenomena to design interventions for solving problems (Alharbey & Chatterjee, 2019). Therefore, this study adopted design science approach, and it was organized in the flow of “System Design,” “System Implementation,” “System Evaluation,” “Discussion,” and “Conclusion” sections.
System Design
Framework of Care Decision Support System
According to existing studies, the basic logic of care decision support system is that analyzing data, and then giving feedbacks to caregivers in order to assist them in making care decisions (Folter et al., 2014). Based on this logic, this study established the framework of care decision support system, as shown in Figure 1:

Framework of care decision support system.
First, through preprocessing the behavior data collected by sensors, this study divides elderly’s home-based behaviors into Instantaneous Behavior and Continuous Behavior. Instantaneous Behavior refers to the behavior that only has the start time attribute, such as opening door, and the data of this behavior only includes the number of times it occurs. Continuous Behavior refers to the behavior that not only has the start time attribute, but also has the duration attribute, such as sleeping. Data of this behavior includes the duration of the behavior and the number of times it occurs.
Second, overall analysis of behaviors is performed to determine whether the elderly’s behaviors are abnormal as a whole.
Third, detailed analysis of behavior is performed. It includes short-term analysis (such as daily) and long-term analysis (such as monthly) on instantaneous and continuous behavior.
Finally, results of these analysis are feedbacked to the caregivers with visualization. It can assist them to make care decisions.
Method of Behavior Analysis
This study preprocessed the behavior data according the method proposed by Zuo et al. (2017), and divided it into instantaneous behavior data and continuous behavior data. Then overall and detailed analysis were performed, as shown in table 1:
Method of Analyzing Elderly’s Home-Based Behavior Data.

In terms of overall analysis, this study analyzes the home-based behaviors of the elderly as a whole, and helps the caregivers judge whether the overall behavior of the elderly is abnormal on that day. In terms of detailed analysis, each behavior of the elderly is analyzed individually.
Overall analysis
The purpose of the overall analysis is to calculate the abnormal degree of behaviors as a whole on every day. The degree can be used to determine whether the elderly’s various behaviors are abnormal. According to the logic of Anomaly Detection (Valladares et al., 2017), the lower probability that the elderly’s behavior belongs to the normal range on a certain day, the more abnormal it is. The Multivariate Gaussian Model, that is a common method for Anomaly Detection, is used to detect abnormal behavior. This study trained the Gaussian Model with normal behavior data of this elderly firstly, and then calculated the probability that the detected behavior belongs to the normal range using trained model. The lower the probability is, the more abnormal the detected behavior is.
Daily baseline analysis
Daily Baseline Analysis is one part of the Detailed Analysis. Its focus is to determine the baseline of each behavior, so as to determine whether each behavior of the elderly is within the normal range on a certain day. The baseline determination method adopted in this study is as follows:
On the one hand, the baseline of instantaneous behavior includes baseline of the number of times this behavior occurred in a certain day, referred to as BAN (Baseline of Action Number).

DAN is the number of times this behavior occurred in a certain day during the sampling period, and M is the sample window. The normal range of this behavior attribute is a certain proportion of the baseline.
On the other hand, the baseline of continuous behavior includes baseline of the number of times this behavior occurred in a certain day (BAN), and baseline of total duration of this behavior in a certain day, referred to as BAD (Baseline of Action Duration).

DAD is the total duration of this behavior in a certain day during the sampling period, and M is the sample window. The normal range of BAD is also a certain proportion of the baseline.
Long-term routine analysis
Long-term routine analysis is another part of the Detailed Analysis. It mainly uses the Continuous Behavior data to identify the behavior routine of the elderly in a certain period. Topic Model based on LDA (Late Dirichlet Allocation) algorithm is used to analyze the routine.
The Topic Model based on LDA Algorithm is the mainstream method in the field of Text Analysis, which is used to identify topics from document (Hernandez et al., 2020). Scholars have introduced it into the field of behavior analysis to identify potential behavior patterns, and achieved good results (Castanedo et al., 2014; Ihianle et al., 2016).
Basically, the Topic Model based on LDA Algorithm is a three-level Bayesian probability model, including three structures of words, documents, and topics (Castanedo et al., 2014). The topic model regards a document as a word frequency vector, and considers that the document is composed of topics according to a certain probability distribution. And each topic is composed of words in the document according to a certain probability distribution (Ihianle et al., 2016). LDA takes a document as a bag of words, and counts the frequency of each word in the document. In addition, LDA assumes that each word appears independently of each other in the document, regardless of the order in which they appear.
This study regards behavior data collected by sensors in a certain period of times as an “artificial word,” and regards all artificial words of one sensor in 1 day as a “text.” The text of several days is regarded as a “document.” The Topic Model is used to identify the topics in the behavior document, which is this behavior routine in these days (Rieping et al., 2014).
This study adopts the method of Castanedo et al. (2014) to generate artificial word from sensor data. The form of artificial word is shown in Figure 2.

Example of artificial word.
The artificial word is a vector composed of six digits. The last digit is the time segment which the behavior occurs. According to the method of Castanedo et al. (2014), this study divides the 24 hours a day into nine time segments, which are represented by numbers from 1 to 9. About 1 represents from 0:00 to 5:59, 2 represents from 6:00 to 6:59, 3 represents from 7:00 to 8:59, 4 represents from 9:00 to 10:59, 5 represents from 11:00 to 13:59, 6 represents from 14:00 to 16:59, 7 represents from 17:00 to 18:59, 8 represents from 19:00 to 20:59, and 9 represents from 21:00 to 23:59.
The first five digits of the artificial word represent the sensor activation status. Each digit represents to 1 minute. Within 1-minute corresponding to this digit, if the sensor is activated, it is assigned as 1, otherwise it is assigned as 0. In each time segment, every 5 minutes, one artificial word composed of six digits is generated. And each artificial word only reflects a special sensor data.
According to this method of generating artificial word, 288 (24 × 60/5) artificial words are generated each day from a special sensor to form a “text.” Some “texts” make up a “document.” Taking this “document” as the input of Topic Model, the output will be several “topics.” And each topic represented as a probability combination of these artificial words, means a behavior routine.
Visualization
In the context of large number of complex data, visualizing the data can effectively improve people’s understanding, and assist them to make decisions. Therefore, visualization has been widely used in many fields, such as medical health (Zhao et al., 2017), social network (Zhu & Watts, 2010), behavior analysis (Chung et al., 2017; Folter et al., 2014), etc. In the field of behavior analysis, common visualization forms include density map (Wang & Skubic, 2008), building structure diagram (Salim et al., 2014), Work Flow (Chung et al., 2017), line chart (Le et al., 2014), etc.
This study visualizes the analysis results to assist caregivers in making care decisions. Specifically, the results of daily baseline analysis and long-term trend analysis are visualized with line chart, and the results of long-term routine analysis are visualized in the form of density map.
Care decision support
The visualization of results can be used to assist caregivers to make care decisions.
First, according to the results of the overall analysis, if the abnormal degree of behavior is lower than a certain threshold value, the caregivers can determine that the elderly is likely to have health and safety risks, and give him/her special attention.
Second, according to the results of daily baseline analysis, if the behavior data of the elderly exceeds the normal baseline range on a certain day, the caregivers can identify the abnormal behavior and make corresponding care preparation.
Third, according to the results of the long-term trend analysis, if the behavior of the elderly shows a bad trend (such as increased trend of in-bed time or reduced trend of activity times), the caregivers can identify the abnormal behavior trend and make corresponding care preparation.
Finally, according to the results of long-term routine analysis, if the behavior of elderly shows a bad routine, such as sleeping late, the caregivers can identify the abnormal routine and make corresponding care preparation.
System Implementation
In order to demonstrate the effectiveness of care decision support system, this study built a prototype system (System A) and used it in the setting of a senior care technology company in Beijing, to analyze the real home-based behavior data of elderly. The company uses non-intrusive sensors installed in the living room, bedroom, corridor, and toilet to monitor elderly’s home-based behavior. In the sensor network, preset digits, such as 1, 2, 3, 4, 5, 6, represent different behaviors, which are fall, call, in-bed, shower, toilet, and activity. In practice, not all the six sensors are installed in every elderly’s home, so the data of these six behaviors are not complete in the database. The example of original data is shown in Figure 3:
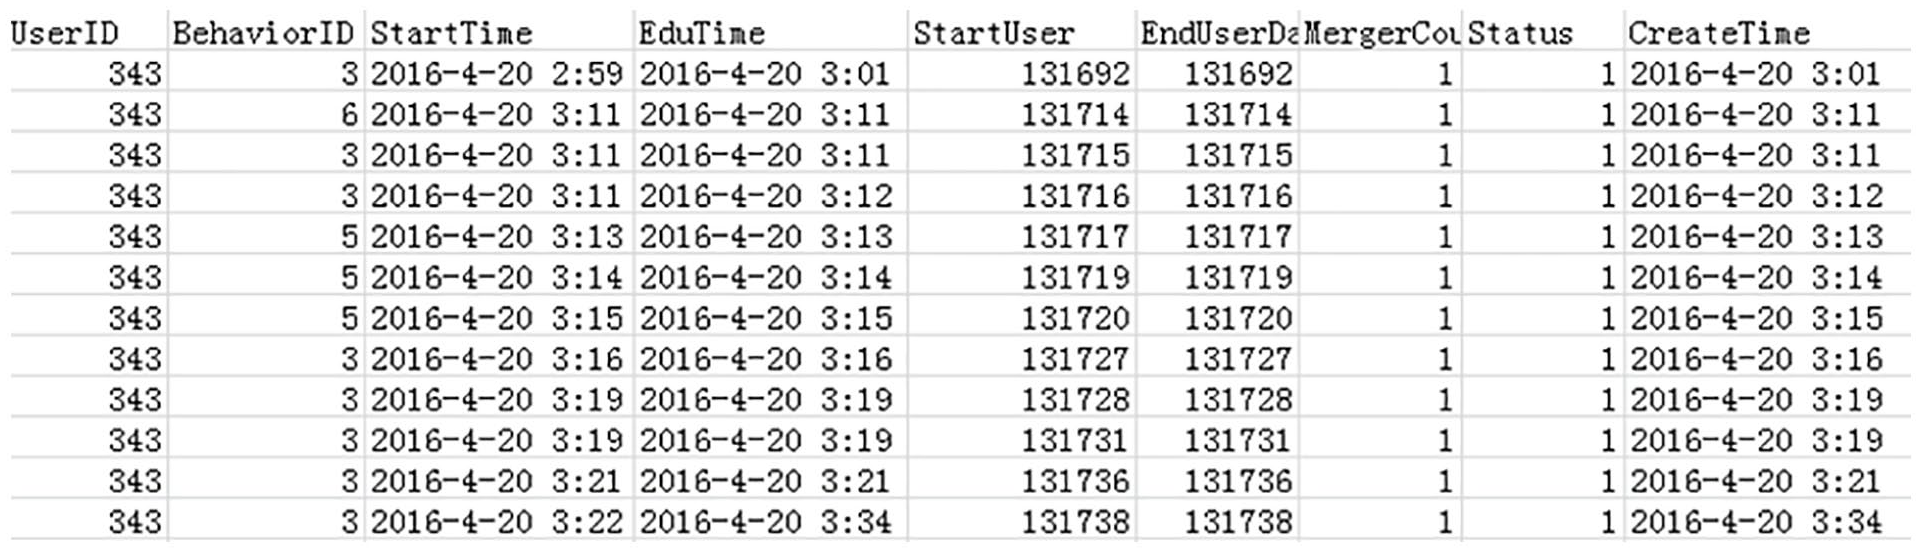
Example of original data.
The field named “BehaviorID” is the behavior digits, such as 3 represent in-bed, 5 represent toilet, and 6 represent activity. The field named “StartTime” is the start time of the behavior. The field named “EndTime” is the end time of the behavior, and the field named “CreateTime” is the create time of the record. There are no other field used in this study, so they will not be explained.
This study selected the elderly whose UserID is 343 as the sample to analysis his behavior data from April 20, 2016 to October 20, 2016. There are two reasons why this dataset was chosen. On the one hand, the amount of this dataset is large, with a total of 38,000 records. On another hand, the time span of this dataset is long, which records the behavior of the elderly for half a year. For some reasons, the data missing of this elderly is serious for some days. These records with more serious missing data were deleted. In the end, there are 93 days data of complete behavior records.
There are three sensors in No. 343 elderly’s home. One senor was installed under the mattress to monitor the in-bed behavior. One senor was installed on the corridor to monitor the activity behavior, and the senor was installed on the toilet to monitor the toilet behavior. The senor installed on the corridor is an infrared sensor, which records the instantaneous behavior data. The sensors installed under mattress and on the toilet are pressure sensors, which record continuous behavior data.
Care Decision Support System Designed in This Study
Pre-procession
According the method of Zuo et al. (2017), the behaviors were divided into instantaneous behavior and continuous behavior firstly. In this study’s context, data of activity is instantaneous behavior data. Data of in-bed and toilet is continuous behavior data. Second, the records about continuous activity data were merged within a certain time range.
Five behavior attributes, including the number of times activity occurs per day, number of toilet per day, number of bed per day, duration of toilet per day, duration of bed per day, are extracted from the preprocessed dataset for behavior analysis. An example of data is shown in Figure 4:

Example of preprocessed dataset.
Overall analysis
This system performs overall analysis with all three home-based behaviors data of the elderly every day to calculate the degree of abnormal behavior through Multivariate Gaussian Model. These five behavior attributes are selected as input, and the behavior data of all normal days of last month is selected as training dataset. For example, when calculating the degree of abnormal behavior in a certain day in June, the behavior data of all normal days in May is selected as the training dataset. Since the outputs of multivariate Gaussian model are not easy to compare, this system transforms them to values within 100. The transformation method is to take the logarithm with the base of 10 for the output of multivariate Gaussian model, and then add 100. The smaller the abnormal degree is, the more abnormal the behaviors of the elderly are. According to the above method, the behavior abnormal degree of the elderly on June 14 is 59.2.
Baseline analysis
This system conducted baseline analysis on activity, toilet, and in-bed behaviors according to the method given above. The baseline of each behavior attribute in every month is determined based on the data of previous month. For example, the baseline of “activity_num” in June is determined based on the data of May. The average of “activity_num” in all days of May is calculated, and then the upper and lower baselines of June are taken as the 20% fluctuation of the average. The floating ratio can be adjusted according to the actual situation. For example, for the behavior attributes that should not fluctuate too much, a lower floating ratio can be set.
Long-term trend analysis
This system conducted long-term trend analysis on monthly basis. When performing daily baseline analysis, line chart is used to show the behavior data from first of this month to the current day to visualize the behavior trend. For example, for “activity_num,” when conducting baseline analysis on May 20, the line chart is used to show data of “activity_num” from May 1 to 20. Then the line chart on May 31 is the complete behavior trend in May. The baseline analysis and line chart of “activity_num” trend on May 27 are shown as Figure 5.

Line chart of “activity_num” in May.
The horizontal axis represents the date and the vertical axis represents the number of activities. The blue dots indicate the number of activities per day. The two horizontal lines are the upper and lower baselines. It can be seen from Figure 6 that the number of activities of the elderly on May 3, May 12, and May 15 was too much, exceeding the upper baseline. Using the same method, baseline and long-term trend analysis on other four behavior attributes can be conducted.

The “in-bed” routine density map of No. 343 elderly in May.
Long-term routine analysis
This system conducted Long-term routine analysis using continuous behavior data to identify the elderly’s behavior routine. The data of in-bed behavior was used as an example to illustrate this analysis process. At the end of each month, the in-bed behavior data is analyzed to identity the in-bed routine of the elderly at this month. According to the above analysis method, this system converted the in-bed data into “artificial words” according to the method of Castanedo et al. (2014). Then, the in-bed behavior routine was identified using Topic Model.
This system used the in-bed behavior data of No. 343 elderly in May to identify his in-bed routine. First, the daily in-bed behavior data of this elderly in May was used to make words. The overall situation of artificial words is shown in Table 2.
Artificial Words of In-Bed Behavior in May.
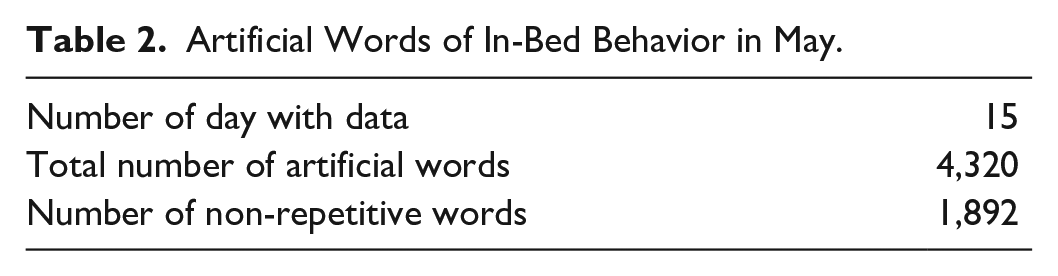
In our data set, there are only 15 days having data in May. About 288 artificial words are constructed every day, and the total number of these words is 4,320. There are 1,892 different words in this “document.” Then Topic Model was used to analyze this “in-bed document,” and four “topics” were identified. As shown in Table 3.
Topics of In-Bed Behavior in May.

The number in brackets is the probability that the artificial word belongs to the corresponding topic.
Each topic is a probability combination of artificial words, and the four words with the highest probability for each topic are listed in Table 3. The meaning of each topic is also understood according to these artificial words. For example, Topic 0 contains four artificial words with the highest membership probability, whose first five digits are all 0. It means that the sensor has not been triggered. Topic 1 contains two artificial words with the highest membership probability, which are 1,11,119 and 1,11,118. It means that the sensor was triggered from 7:00 to 10:00 pm, and the elderly was in bed during this period.
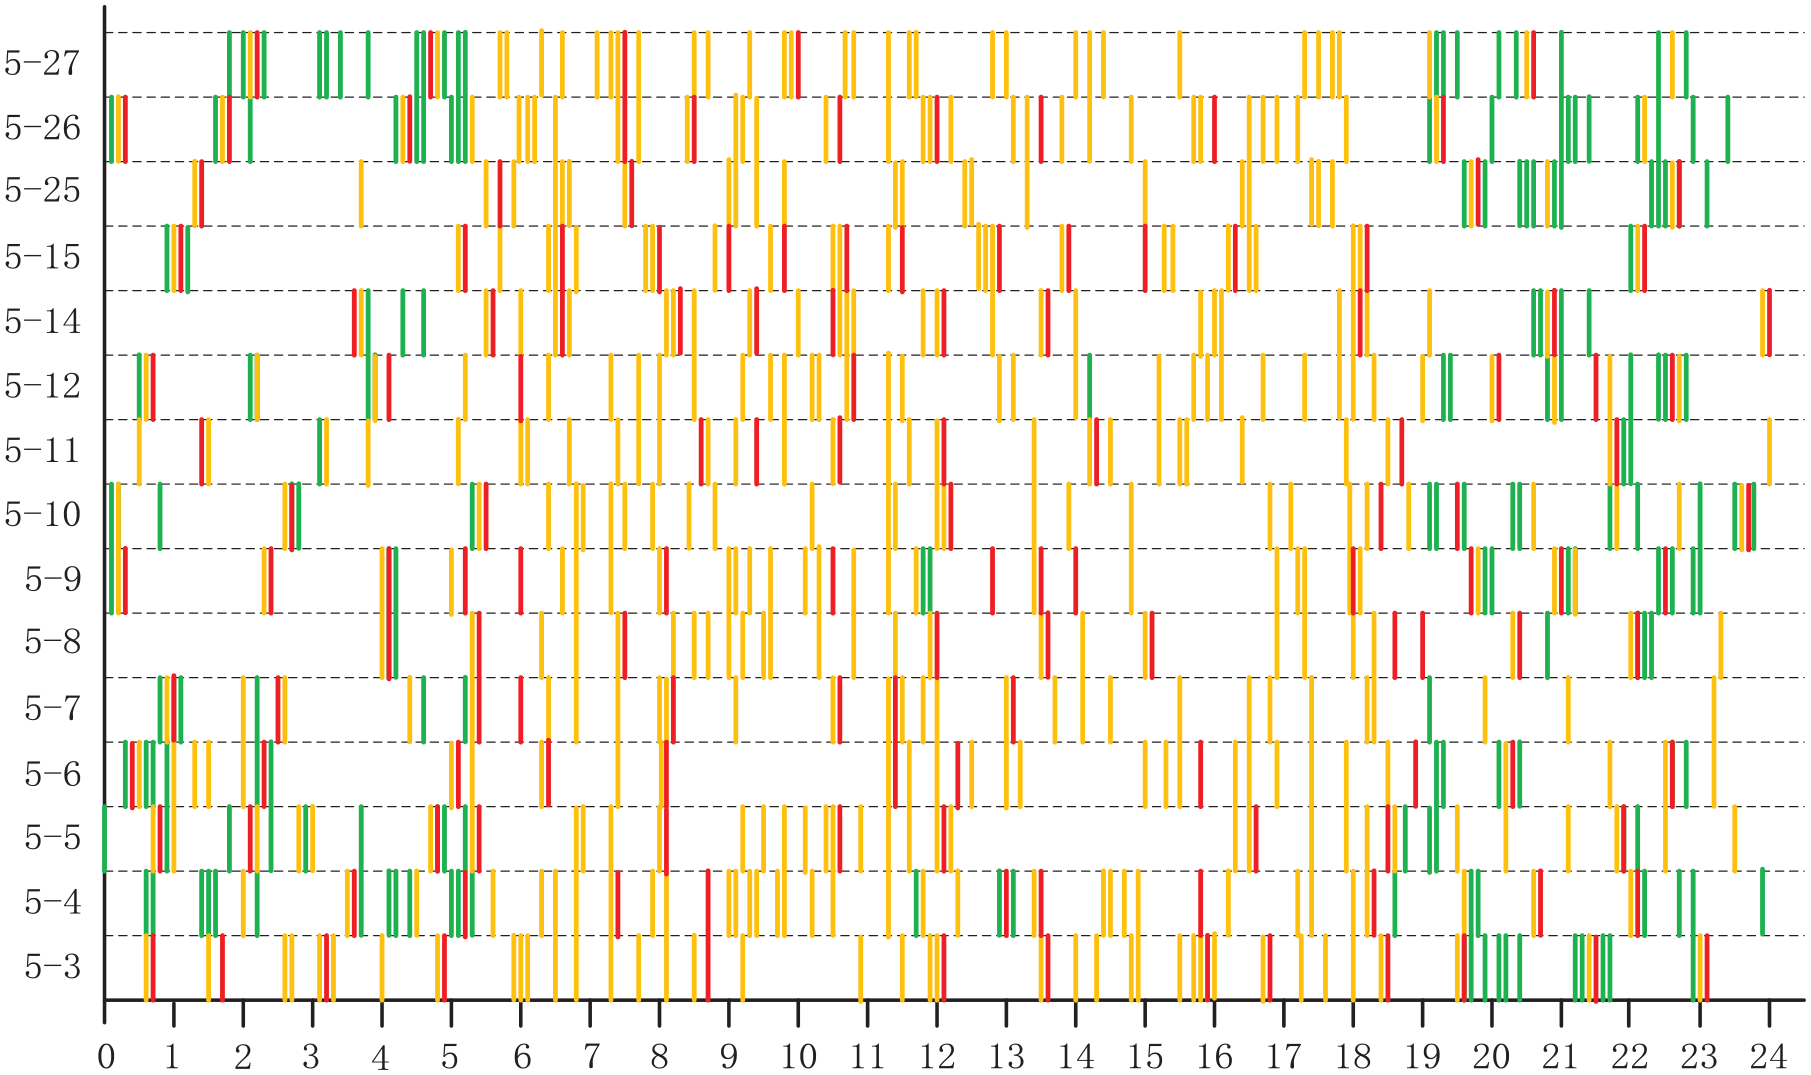
It should be noted that some artificial words may belong to more than one topic. For example, the probability that the word 000006 belongs to Topic 0 is 0.076, belongs to topic 1 is 0.041, and belongs to Topic 2 is 0.101. this system uses density map for visualization, and marks these artificial words according to the topic that they have the highest membership probability. Figure 6 shows the density map of in-bed routine of No. 343 elderly in May.
The vertical axis represents the date and the horizontal axis represents the 24 hours of 1 day in Figure 7. Red represents Topic 0, which means not in bed. Yellow represents Topic 1, which means in bed at night. Light Green represents Topic 2, which means in bed in the early morning. Dark Green represents Topic 3, which means not in bed. It can be seen from the Figure 7 that in the first half of the night (19:00–24:00), the in-bed routine of this elderly in May was OK. But in the latter half of the night (0:00–6:00), there were problems.

The activity trend of No. 343 elderly in May by System B.
Finally, the above analysis results are reported to the caregivers in a visual way every day. Behavior abnormal degree is given at the top of the interface with eye-catching font. The baseline and trend analysis results are reported using line charts. At the end of this month, the long-term routine analysis results are reported using density maps
Benchmark System
In order to demonstrate the effectiveness of the care decision support system designed in this study, two representative systems were selected as the benchmark. The behavior analysis system (System B) designed by Folter et al. (2014) is mainly used for baseline and trend analysis of patient behavior. The behavior analysis system (System C) designed by Chung et al. (2017) is mainly used to analyze the routines of the elderly’s home-based behavior. There are some reasons why these two systems were chosen as the benchmark systems. One hand, these two systems are published in a relatively recently, which can reflect the latest research progress in the field to a certain extent. On the other hand, these two systems are published in the top journals in the field of Medical Informatics.
System B
This study also takes the behavior data of No. 343 elderly in May as an example to show these two benchmark systems. System B counted the number of patient’s behavior, and used broken line chart and scatter chart to analyze the baseline and trend of behavior. Figure 7 is an illustration of System B using the activity data of No. 343 elderly in May.
The horizontal axis is the date of May contained in the dataset, and the vertical axis is the number of times the activity sensor is triggered. The red dot is the actual number of times the activity sensor is triggered. The blue broken line is the moving average of the daily times the activity sensor triggered. On the one hand, the caregivers judge the change trend of the behavior according to the blue broken line, and make corresponding care preparation if the behavior shows a bad trend. On the other hand, according to the deviation degree between daily actual behavior and moving average, the caregivers judged whether the behavior was abnormal. If it is found that the deviation between the actual data and the moving averages is too large (such as May 8 and May 12 in Figure 8), corresponding care preparation should be carried out.
Work flow of No 343 elderly’s three behaviors by System C.
System C
System C uses Work Flow to show the sequence of different behaviors, so as to analyze the home-based behavior routines of the elderly. Figure 8 is an illustration of System C using the three behavior data (including activity, toilet and in-bed) of No. 343 elderly in May.
The horizontal axis is 24 hours a day, and the vertical axis is the date contained in the data set. In Figure 8, the green bar indicates in-bed behavior, the yellow bar indicates activity behavior, and the red bar indicates toilet behavior. Each bar indicates the start time of the corresponding behavior. In the form of Work Flow, System C can show the sequence of various behavior in each day. For example, on May 6, the elderly fist was in bed, and then went to toilet, followed by behavior of activity and being in bed at about 0:30 am. This is a complete process of getting up in the early morning. In addition, the system shows the “Work Flow” of several days together, which can help caregivers to identify the behavior routine of the elderly to a certain extent. For example, according to the figure, it can be roughly judged that the elderly generally goes to bed at about 20:00 and gets up at about 5:00 in the morning. The elderly has no habit of taking a lunch break.
System Evaluation
The evaluation focused on the effectiveness of the proposed system. Therefore, this study used experimental and comparative analysis. Experiments were conducted to compare proposed system (System A) with two benchmark systems (System B and System C). Some caregivers were invited to participate in the experiment. Questionnaires and interviews were used to collect data on system evaluation. Using the Likert Scale (from 1 very low to 7 very high) questionnaires, the participants’ evaluation about effectiveness of every system was collected. According to existing studies, the effectiveness was evaluated as a whole (Folter et al., 2014). Through interviews, the participants were asked to give reasons why they evaluated a system at this level.
Participants
3 caregivers participated in the experiments, evaluating which system is more effective in the care decision support. These caregivers, comprising one female and two male, are from this senior care technology company. All participants were independent from the research team, and had over 1-year professional experience of working with remote monitoring technology and care decision making. In China, the companies that provide home-based care services based on behavioral monitoring data are just starting up, and there are few caregivers with such experience. Therefore, we only found three caregivers with relevant experience to participate in the evaluation.
Procedure
The evaluation focused on users’ perception towards the system based on their use of it during the experiment. First, 1 month data from the data set of No. 343 elderly was selected randomly. The data was analyzed and visualized through the three systems. Second, the visualization results of these systems were feedbacked to the caregivers who participated in the experiments, and the caregivers were asked to judge the effectiveness of the three systems in supporting them making care decisions independently. Interviews were arranged in an attempt to provide qualitative and interpretive analysis.
Results
The evaluation results of the three evaluators are shown in Table 4.
Evaluation Results About System Effectiveness.

The Care Decision Support System designed in this study was perceived to be more effective than these two benchmark systems. On the one hand, in terms of average score, the care decision support system designed in this study has the best effectiveness in assisting caregivers to identify abnormal behaviors of the elderly and make care decisions (the average score is 5.33). On the other hand, in the terms of each evaluator’s score, the effectiveness of system designed in this study evaluated by each evaluator was higher than that of the other two benchmark systems. Based on the above two aspects, it can be found that the system designed in this study is superior to the two benchmark system in terms of supporting caregivers to make decisions.
Discussion
According to Design Science approach, this study designed care decision support system based on elderly’s home-based behavior. Based on the real data, the comparison with two benchmark systems shows that the system is more effective in care decision support. It provides a more effective method for home-based care decision support.
First, in this study, all behaviors of the elderly were evaluated as a whole, and a behavioral abnormality degree within 100 was given. It can support caregivers to judge whether the elderly behaviors are abnormal or not, and help them quickly identify the elderly who need to be focused on. To a certain extent, it improves their work efficiency. The system designed by Folter et al. (2014) only can realize the analysis of single behavior. Although the system designed by Chung et al. (2017) can express a variety of behaviors, it mainly focusses on the sequence of these behaviors, and cannot give intuitive results of whether they are abnormal. That is also one reason why all evaluators believe that the system designed in this study is more effective.
Second, in this study, daily baseline analysis and long-term trend analysis were conducted for each behavior. Daily baseline analysis can help caregivers to identify abnormal behaviors, and long-term analysis can help them to identify abnormal trend in specific behavior. In terms of visualization, Folter et al. (2014) used line plot and scatter plot to show the analysis results. However, the system only shows the degree of deviation, and does not give the normal baseline range. It is not convenient for caregivers to identify whether the behavior is normal. In this study, the behavior baselines were set for each behavior of elderly, and the comparison between each day behavior and the baseline was displayed in a visual way. The caregivers can easily find whether each behavior of the elderly is within the baseline range. That is other reason why all evaluators believe that the system designed in this study is more effective than System B.
Third, in this study, behaviors are divided into instantaneous behavior and continuous behavior. For the continuous behavior, on one hand, the analysis in this study can reflect not only the spatial information of these behaviors (For example, the in-bed behavior occurs in the bedroom, and toilet behavior occurs in the toilet.), but also the temporal information (such as baseline analysis of in-bed’s total duration or toilet’s total duration). O’Brien et al. (2012) proposed a method for visualizing the elderly’s home-based behaviors by using density map and building structure diagram. But this method can only show the spatial information of the behaviors. On the other hand, this study uses Topic Model to identify the long-term routine of specific behavior, so as to help caregivers find unhealthy behavior routine. Chung et al. (2017) used the Work Flow to visualize the home-based behavior of elderly. However, it focuses on the sequence of different behaviors, and could not reflect the routine of a certain behavior clearly. That is third reason why all evaluators believe that the system designed in this study is more effective than System C.
Conclusion
Care decision support system based on home-based behavior of elderly can assist caregivers in improving independent elderly’s health, safety, and quality of life. The existing studies could not give an overall judgment on the behaviors of elderly, and not identify elderly’s behavior routine clearly. The system designed in this study evaluated all behaviors of one elderly as a whole with the Multivariate Gaussian Model, and it could support caregivers to judge whether the elderly’s behaviors are abnormal or not. This system also identified the behavior routine of specific behavior using Topic Model, and it could help caregivers find unhealthy behavior routine. The evaluation was conducted and the results indicated that the effectiveness of this system was better than two benchmark system.
There are also some limitations in this study. First, the problem of Cold Start. Overall Analysis and Detailed Analysis (such as baseline analysis and long-term trend analysis) are adopted in this study. They all face the Cold Start problem, which requires large efforts in human observation and manual annotation for constructing training datasets. Future research needs to consider some unsupervised learning approaches to overcome this problem. Second, the relationship between behaviors is not considered. The relationship between various behaviors and the sequence may also contain important information, and future research needs to consider how to incorporate the relationship information of various behaviors into the behavior analysis. Third, the generalizability of the dataset is not enough. On the one hand, the dataset used in this study includes three home-based behaviors of elderly collected by sensors. Compared with the complexity of home-based behavior, only three behaviors are not enough. Future research needs to use more abundant behaviors. On the other hand, only one elderly’s dataset was used in this study. Although the system designed in this study showed good effectiveness, more evaluations using other elderly’s dataset are needed in the future. Fourth, too few caregivers participated in system evaluation. Because the service of using sensors to collect the behavior of the elderly at home and providing care has just started in China, there are few caregivers with relevant experience. With the expansion of this service, future research may invite more caregivers with relevant experience to participate in the system evaluation.
Footnotes
Declaration of Conflicting Interests
The author(s) declared no potential conflicts of interest with respect to the research, authorship, and/or publication of this article.
Funding
The author(s) disclosed receipt of the following financial support for the research, authorship, and/or publication of this article: This work was supported by “Nanhu” Scholars Program for Young Scholars of Xinyang Normal University [Grant No. 2019B053]; the Planning Project of Henan Philosophy and Social Science [Grant No. 19BSH011].
Ethical Approval
This study was conducted with the approval of the ethics committees of Xinyang Normal University.