
Abstract
Walking speed (WS) is considered an important indicator for overall health. Despite this, there is a paucity of data relating to WS values in the Arab region. The present study aims to establish preferred (PWS) and maximal walking speeds (MWS) in young adults in Qatar and examine how gender, body mass index, and physical activity (PA) components influence WS. One hundred ninety-six healthy participants (age: 22 ± 2 years; 60% females) performed a standardized walking test on a flat 10-m pathway, completed the short form of the International PA Questionnaire, and had their height and weight measured. PWS and MWS were normalized for height (rPWS and rMWS). Results. Females demonstrated slower PWS, MWS, and rMWS compared to males. Moreover, MWS and rMWS were lower in obese participants compared to underweight, normal weight and overweight individuals. There was a significant positive relationship only between vigorous PA and rPWS and rMWS. This is the first study to establish reference WS values for healthy young adults in Qatar. Overall, we demonstrated that WS was lower compared to similar adults worldwide. The established healthy walking values can serve as reference for clinical evaluations within Qatar. Future PA guidelines and public health interventions should focus on WS values.
Introduction
Walking is the most common form of physical activity (PA), and it can be performed at either light, moderate or vigorous intensity (Ciprandi et al., 2017). Walking speed (WS) is considered a robust measure for assessing and monitoring functional status and overall health (Studenski et al., 2011; Verghese et al., 2011). WS is a valid, reliable, and sensitive measure (Goldberg & Schepens, 2011; Rydwik et al., 2012); for tests performed in both clinical and research settings (Graham et al., 2008; Peel et al., 2013). WS has been shown to be predictive of many health outcomes (Middleton et al., 2015). A high preferred walking speed (PWS) may also be associated with adults meeting the recommended levels of PA (Ciprandi et al., 2017). In addition, maximal walking speed (MWS) is increasingly being investigated as a valuable measure for clinical assessment of mobility function (Middleton et al., 2016).
Gender- and age-stratified WS reference (i.e., normative) values are established for healthy adults from different countries around the world, as summarized in a meta-analytical study (Bohannon & Williams Andrews, 2011). Ethnic background, geographic, socio-economic, and/or environmental factors all affect WS (Al-Obaidi et al., 2003; Levine & Norenzayan, 1999). Within the state of Qatar, more than 50% of the population do not engage in regular PA (Qatar National Physical Activity Guidelines, 2021). These high levels of physical inactivity are due to a multitude of factors including cultural, social and environmental factors (i.e., hot, humid desert climate). Indeed, 44% of Qatari females achieve <5,000 steps per day (Sayegh et al., 2016); despite the on-going community-based walking program (i.e., step into health), an intervention to increase PA levels utilizing wearable technologies. Subsequently, as well as the environment affecting PA levels, it may also affect WS (Levine & Norenzayan, 1999). Although PWS and MWS have previously been related to factors such as maximal strength of lower extremities (Bohannon, 1997) or obesity (Fernández Menéndez et al., 2019), it is unclear how components of PA influence WS outcome measures in healthy young adults. Despite this, only three studies have examined walking behaviors in the Gulf and Arab regions, and all of them were limited due to small sample sizes [i.e., 15 females and 15 males from Kuwait (Al-Obaidi et al., 2003); 17 males from Tunisia (Dhahbi et al., 2014); nine males and nine females from Qatar (Majed et al., 2020)]. In the recent study from Qatar, Majed et al. (2020) revealed lower walking speeds for their Qatari and Arab sample as compared to international normative values referenced in the literature. Although the later study has the merit to be the first to explore walking behavior in Qatar, it has done so in a controlled laboratory setting on a motorized treadmill.
Given that >70% of the Qatari population is either “overweight” or “obese” (Qatar Biobank 2016-2017), it could be expected that WS will be significantly lower than in other countries, especially considering the lack of PA and environmental challenges. Establishing reference WS values is the first step in developing public health interventions and PA guidelines within the state of Qatar, particularly important given that the Qatar National Physical Activity Guidelines (2021) does not contain any information regarding the WS or step cadence necessary to elicit positive health benefits. Therefore, the primary aim of the present study was to establish reference values for PWS and MWS in young male and female adults in Qatar, and examine the relationship between WS and gender, body mass index (BMI) and PA. We hypothesized that (1) WS would be lower in the present sample as compared to international norms, (2) WS would be lower in obese participants as compared to normal weight subjects, (3) WS would be positively correlated to components of PA due to their significant association with peripheral muscle strength and functional capacity (Vardar-Yagli et al., 2015).
Methods
A total of 196 participants (age: 22 ± 2 years; 60% females) were randomly recruited on Qatar University’s campus (Doha) from the student body to participate in the study. Qatar University is the only public university in Qatar and the biggest academic institution in the country. Only healthy participants between the age of 18 to 26 years were included in the study. Exclusion criteria were defined as any past or present disease (e.g., metabolic or cardiovascular), health condition (e.g., neuromuscular, skeletal or cognitive) or injury that might interfere with the ability to walk normally. Physical characteristics are presented in Table 1. Prior to data collection, all participants signed an informed consent according to the university’s code of practice and ethics and to the Declaration of Helsinki. An institutional review board approval was received before the experiment (QU-IRB 856-E/17). All experimental testing took place outdoors in February (average temperature = 20°C to 25 °C, humidity = 60%−75%) on the university’s campus.
Participants’ Physical Characteristics.

Note. Values are reported as mean (standard deviation) unless otherwise stated.
Significant difference between gender (p < .001).
Initially, body mass scales (GS 28, Beurer, Germany) and a stadiometer (MZ10017, ADE, Germany) were used for anthropometric assessments that followed the standards of the International Society for the Advancement of Kinanthropometry (ISAK) (Marfell-Jones et al., 2012). Participants’ body mass and height were assessed while they were barefoot and wearing minimal clothing. Measurements were taken by trained research assistants that are ISAK certified (level 1). Secondly, participants performed a standardized walking test consisting of six walking trials on a 14 -m non-slippery pathway marked by cones as visual targets demonstrating its beginning and end (Middleton et al., 2015). Two meters on each end of the pathway were dedicated for acceleration and deceleration phases for accurate speed measurement (Middleton et al., 2015). A stopwatch served to determine the time needed to cross the intermediate 10 -m, thus allowing for appropriate acceleration and deceleration phases (Middleton et al., 2015). The use of a marked walkway and a stopwatch have been shown to be valid and reliable for WS testing (Adell et al., 2013; Castell et al., 2013; Puthoff & Saskowski, 2013), in particular pertaining to clinical feasibility (Middleton et al., 2015). Participants were asked to walk at their PWS for three trials and at their maximal MWS for three additional trials. The following instructions were provided for each condition respectively, “walk at your most comfortable pace” and “walk as fast as possible and safely, but without running.” A demonstration was given prior to the first trial. All trials were separated with a 20-second rest interval. The time required to cover the intermediate 10-m was recorded. For the walking test, participants were wearing their usual comfortable clothing and footwear (i.e., no sandals, heels or traditional clothing such as abaya or thobe). Finally, PA levels were assessed using the self-administered short form of the International Physical Activity Questionnaire (IPAQ-SF) that was not only validated in comparison to other self-reported physical activity questionnaires across 12 countries (Craig et al., 2003), but also against the gold-standard doubly labeled water (Maddison et al., 2007). Each participant was given a printed copy of the IPAQ-SF questionnaire and was asked to complete it while seated as a last step of their participation.
Body mass index (BMI) was calculated as the ratio between body mass (kg) and height squared (m2). A BMI category was assigned to each participant following the World Health Organization classification (Table 1). WS (cm s−1) was calculated as the ratio between the covered distance (i.e., 1,000 cm) and the mean time (in seconds) required to cover the distance. Relative PWS (rPWS) and MWS (rMWS) were calculated as the ratio of the mean speed of the three respective trials and the individual body height (m). This measure used in a previous study limits the effect of height on WS (Al-Obaidi et al., 2003).
Data from IPAQ-SF was cleaned, outliers were removed and truncation rules applied according the IPAQ guidelines. The variables used for this study were the reported time per week (minutes week−1) spent in walking (low-intensity), moderate-intensity PA, vigorous-intensity PA, and sitting (i.e., sedentary behavior). Weekly total energy expenditure (MET-min week−1) was calculated as the sum of weekly energy expenditure for each type of activity. This was computed as the product of the time spent per week (minutes week−1) in each activity and the corresponding multiple of the resting metabolic rate (MET-min), using 3.3 MET-min for walking, 4 MET-min for moderate PA, and 8 MET-min for vigorous PA (Ainsworth et al., 2000). The resulting value (MET-min week−1) that corresponds to that of a 60 kg person was then multiplied by each participant’s body weight and divided by 60 to convert it into kcal week−1, as recommended by the IPAQ guidelines for data processing and analysis.
Statistical analyses were performed using the Statistical Package for the Social Sciences (SPSS) version 26 (IBM, SPSS Inc, Chicago, IL, USA). GraphPad Prism 8 (GraphPad Software, CA, USA) was used to create Figure 1. Normality of the descriptives was verified using the Shapiro-Wilk test. Descriptive analyses were performed for age and anthropometric measures (i.e., height, body mass and BMI) and PA variables (i.e., walking, moderate- and vigorous-PA and sitting) for male and females separately. Independent t-tests were used to analyze differences in physical characteristics between males and females. Linear mixed models were used to determine differences in walking speeds (PWS, rPWS, MWS, rMWS) between gender and BMI. The least squares mean test provided pairwise comparisons between the fixed effects. Normality and homogeneity of variance of the residuals were checked using quantile-quantile plots, and scatter plots respectively, and deemed plausible in each instance. The relationship between PA (walking, moderate, vigorous and sedentary minutes) and each WS (PWS, rPWS, MWS, rMWS) was assessed using a random coefficient model. Chi square (χ2) tests were used to examine the association between gender, BMI, and whether participants met the PA guidelines, and WS (PWS, rPWS, MWS, rMWS). Cramer’s V was obtained in order to determine the strength of the association, with the following criteria applied 0.00 to <0.10 negligible association, 0.10 to <0.20 weak association, 0.20 to <0.40 moderate association, 0.40 to <0.60 relatively strong association, 0.60 to <0.80 strong association, 0.80 to 1.00 very strong association (Rea & Parker, 2014). Data is reported as mean (±standard deviation) unless otherwise stated. Significance was accepted as p ≤ .05.

Walking speeds for males and females, and by BMI category.
Results
Males were on average 16 kg heavier [t194 = 6.423, p < .001] and 0.18 m taller [t194 = 17.264, p < .001] than females. There were no differences for age or BMI (p ≥ .71). The percentage of participants in each BMI category is presented in Table 1. Additionally, on average males completed more vigorous PA (t302 = 2.466, p = .02) and walking (t298 = 4.287, p < .001), and had higher total EE (t292 = 4.418, p < .001) compared to females. Results showed that 90% of females and 81% of males met the PA guidelines (i.e., ≥150 minutes of moderate or vigorous PA per week). More details on PA levels are shown in Table 2.
Physical Activity Results From the IPAQ-SF.

Note. Data are presented as median (interquartile range). Mod and Vig PA = moderate and vigorous physical activity; Total EE = weekly total energy expenditure.
There was a significant main effect of gender for PWS (f = 6.76, p = .01), MWS (f = 46.07, p < .001), and rMWS (f = 12.07, p = .001), and of BMI for MWS (f = 10.69, p < .001) and rMWS (f = 9.55, p < .001). Females demonstrated slower PWS (f = 6.76, p = .01, 95% CI = −10 to −10 cm s−1), MWS (f = 46.0, p < .001, 95% CI = −20 to −40 cm s−1), and rMWS (f = 12.1, p = .001, 95% CI = −4 to −14 cm s−1) compared to males. Moreover, MWS and rMWS were lower in obese participants compared to underweight (p = .02, 95% CI = −2 to −33 cm s−1 and p = .009, 95% CI = −3 to −21 cm s−1 respectively), normal weight (p < .001, 95% CI = −17 to −29 cm s−1, and p < .001, 95% CI = −9 to −19 cm s−1 respectively) and overweight (p < .001, 95% CI = −1 to −29 cm s−1 and p = .001, 95% CI = −4 to −16 cm s−1 respectively) individuals. There was a significant relationship between vigorous minutes of PA and rPWS (p = .05) and rMWS (p = .001). Participants who engaged in more minutes of vigorous PA had a faster rPWS and rMWS. Additionally, there was no association between whether participants met the PA guidelines and rPWS (χ2 = 0.49, V = 1.0) or rMWS (χ2 = 0.49, V = 1.0). Individual data is shown in Figure 1.
Discussion
The present study is the first to establish normative values for WS in healthy young adults in Qatar. The main findings indicated lower PWS for the present sample as compared to global norms, and lower MWS for obese individuals compared to all other BMI categories (Figure 1), partially supporting hypotheses (1) and (2). Furthermore, participants who engaged in more minutes of vigorous PA had a faster rPWS and rMWS, accepting hypothesis (3).
On average, PWS in the present study was lower for males (123.06 ± 21.30 cm s−1) and particularly for females (131.06 ± 13.83 cm s−1) compared to worldwide data (please refer to Table 3 for direct comparisons). Conversely, PWS was higher for both males and females only when compared to values reported from the Gulf Peninsula [i.e., Kuwait (Al-Obaidi et al., 2003)] and Arab regions [i.e., Tunisia (Dhahbi et al., 2014)] (Table 3). Meta-analytical data showed a global average difference in PWS of 1.70 cm s−1 between males and females in their 20 seconds (Bohannon & Williams Andrews, 2011), while in the present study there was a greater magnitude in gender difference (i.e., 8.0 cm s−1), which is in agreement with healthy young Kuwaiti (Al-Obaidi et al., 2003). These results may be partially explained by differences in body composition, engagement in PA, or maximal lower limb strength (Bohannon, 1997). Despite there being no differences in BMI between males and females in the present study, males demonstrated greater engagement in vigorous PA and walking, and had higher total EE compared to females. Caution should be taken when interpreting these findings, given that both PA and body composition (i.e., BMI) were not directly and/or objectively quantified in the present study. Future research employing objective and direct measures of PA (e.g., accelerometer and wearable technology), body composition (e.g., waist circumference, skinfolds) and strength measures, would be required in order to ascertain the differences in PWS between males and females.
Preferred Walking Speed (PWS, cm s−1) Reference Values in Healthy Young Adults (20–29 Years) Worldwide Compared to Young Female (n = 119) and Male (n = 77) Adults From Qatar (18–26 Years).
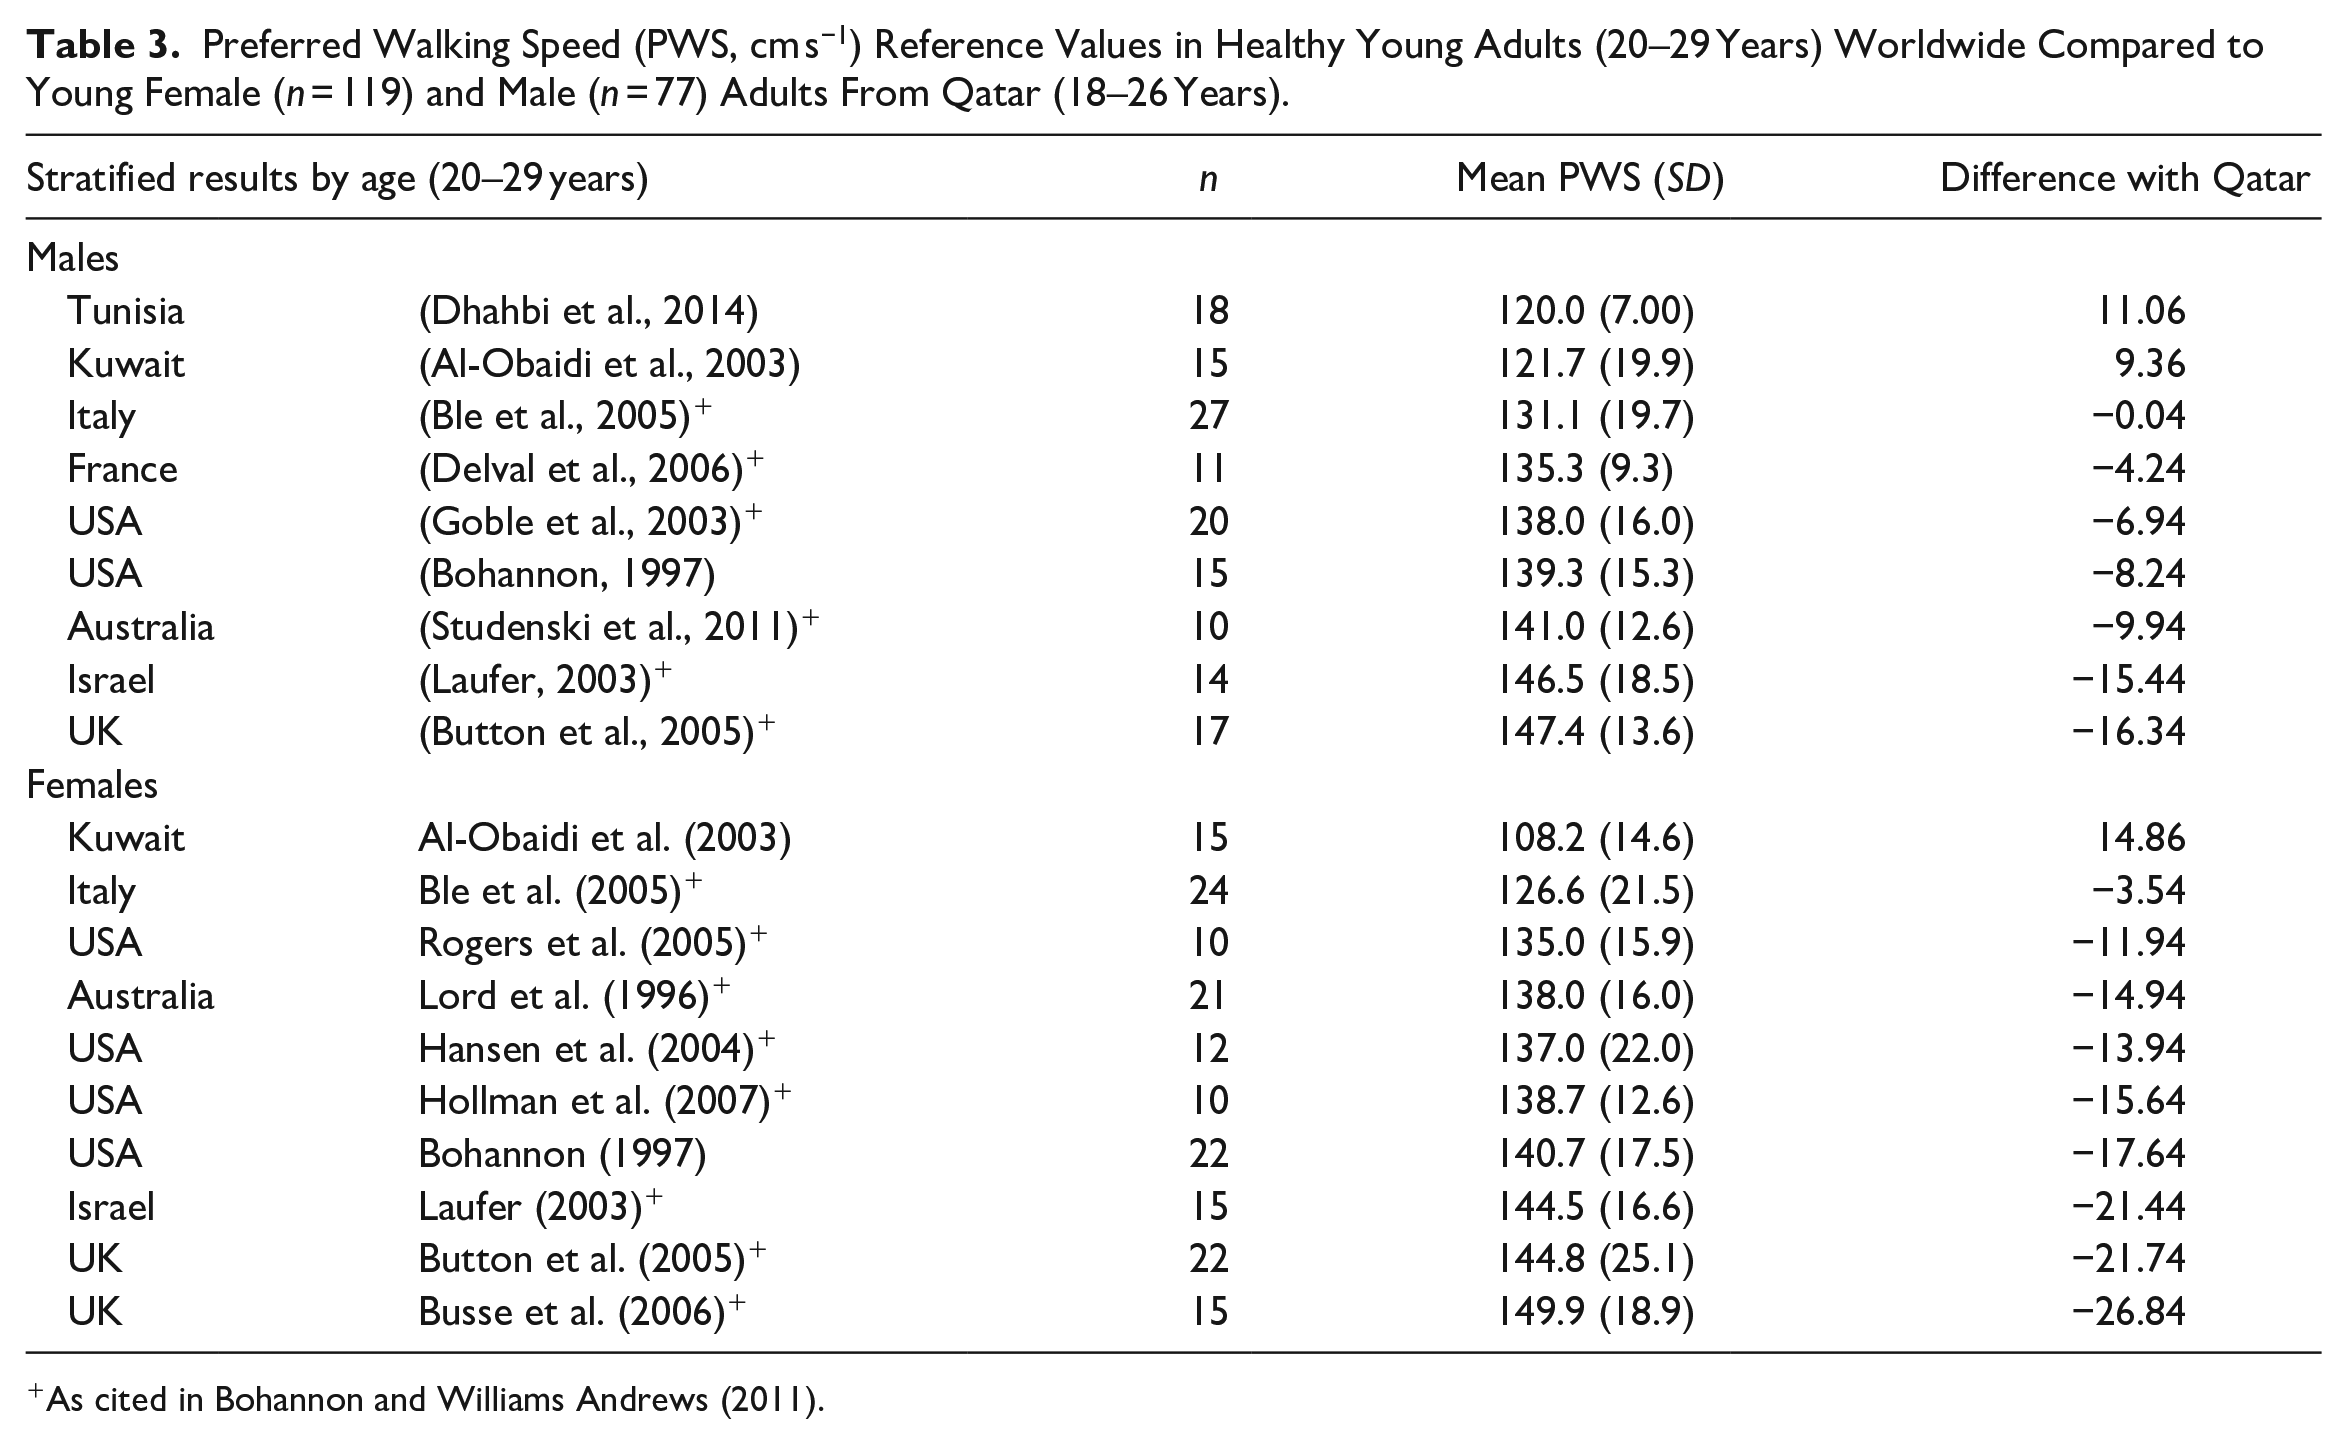
As cited in Bohannon and Williams Andrews (2011).
MWS is typically utilized and measured in older adults (Bohannon & Wang, 2019; Ng et al., 2013; Rantanen et al., 1998). While a very limited number of studies have examined MWS in young adults worldwide, no studies have done so in the Gulf Peninsula or Arab regions, making the comparison of data problematic. The MWS of males (200.66 ± 32.87 cm s−1) and females (170.01 ± 23.11 cm s−1) in the present study were slightly higher (i.e., 8%) in comparison to normative values reported in a recent study from the USA on adults (80 males and 179 females) of a similar age range (Bohannon & Wang, 2019). Interestingly, in a 1997 study investigating walking speed reference values in the USA, Bohannon found MWS values that were about 37% to 57% faster for males and females respectively, as compared to the recently reported values. Although both studies present discrepancies in the sample size and the protocol used to assess walking speed, the large difference in MWS over the 22-year period might possibly reflect changes in other related factors in the community such as those related to obesity or fitness levels. Indeed, only the female sample in the 2019 study had a higher average BMI (i.e., 27.78 kg m−2) as compared to that of the 1997 study (i.e., 21.85 kg m−2). In the present study, obese participants showed lower MWS compared to all other BMI categories in the present study (Figure 1). This finding supports previous studies (Fernández Menéndez et al., 2019; Liu & Yang, 2017), indicating that obese adults prefer to walk slower possibly in an effort to decrease the energy expenditure and increase comfort. The slower walking speed found in obese individuals is expected to reduce the energy expenditure, joint loads (DeVita & Hortobágyi, 2003), mechanical work (Malatesta et al., 2009), and/or ground reaction forces (Browning & Kram, 2007) resulting from the additional mass carried against gravity. Conversely, some studies found that people with obesity walk at similar speeds than normal-weight individuals (Browning & Kram, 2005; Rosso et al., 2019). Variation in findings are presently unclear. However, given that MWS (i.e., step cadence) has been linked to morbidity and mortality, and that >70% of Qatari adults are overweight or obese, it is essential to establish age- and gender-stratified WS across the state of Qatar, as this is the first step to improving the Qatar NPAG, and developing public health interventions.
Slower PWS and MWS in the present study and existing data within the Arab region, compared to worldwide data, may be due to geographic, environmental, and/or cultural factors (Levine & Norenzayan, 1999). Cities with the slowest WS were more likely to have warm climates and emphasize collectivistic culture. Additionally, MWS was found to correlate with maximal lower limb strength in disabled women (Rantanen et al., 1998) and in healthy young adults (Bohannon, 1997). Given that 83% of the Qatari population participate in little or no PA, and maximal lower limb strength is likely associated with PA, this could partially explain the findings. In support of this postulation, the present study showed that participants who engaged in greater amounts of vigorous PA had higher PWS and MWS. However, causal inference cannot be made at this stage. Further research examining the exact mechanisms related to MWS would need to be performed. Nevertheless, this study highlights the importance of utilizing walking outcome measures at a population level to improve the NPAG and future public health interventions across the state of Qatar.
Caution must be taken when interpreting these results, as the sample was homogeneous (i.e., from the university campus only), and therefore, these results may not be representative of the Qatari population as a whole. The authors speculate that those who volunteered for the study were the more “health conscious” individuals from the university. Future studies should measure WS, step cadence and step count across all schools and workplaces within the state of Qatar, to establish gender- and age-stratified normative values. Additionally, PA was not measured objectively, and was only determined from the IPAQ-SF. Future studies should employ accelerometers and/or other wearable technologies to accurately quantify PA, and provide additional variables such as step count, and cadence. Furthermore, direct quantification of body composition should be employed in future studies, as BMI, utilized in the present study, does not provide information on the distribution or type of tissue (i.e., lean muscle mass or adipose tissue). Nevertheless, compared to previous research from other countries (Table 3) and from Qatar (Majed et al., 2020), the sample size was larger, and the simple walking test employed can be easily replicated in a clinical setting, which are considered as strengths of the current study.
Conclusions
Establishing WS reference values can facilitate clinical comparisons for rehabilitation and functional assessment. Moreover, reference values are an important first step in developing public health interventions and PA guidelines within the state of Qatar, particularly essential given that the first edition of the Qatar NPAG does not contain any information regarding the WS or step cadence necessary to elicit positive health benefits. Both gender and obesity appear to affect MWS and PWS. Walking is the most popular form of exercise, and is a culturally and socially acceptable form of exercise in the current population. Subsequently, it is important that future research establishes gender- and age-stratified WS normative values across the state of Qatar, and provides specific public health recommendations and interventions related to WS (i.e., step cadence, step count), to improve the existing community-based programs. Additionally, in a community setting, both values provide valuable information regarding, for example, safe crossing of streets where safety margins of signal timings can be optimized for pedestrians.
Footnotes
Acknowledgements
The authors are grateful to Mohammad Prince, Bahaa Aboghaba, Aya Sewefy, Dhoha Abdelrahman, Somaia Gabr, and Rana Marzuq for their help in the data collection and to all participants who volunteered in the study.
Declaration of Conflicting Interests
The author(s) declared no potential conflicts of interest with respect to the research, authorship, and/or publication of this article.
Funding
The author(s) disclosed receipt of the following financial support for the research, authorship, and/or publication of this article: This work was supported by a Qatar University (![]() ) grant [QUST-1-CAS-2018-21] received by LM. The funders had no role in study design, data collection and analysis, decision to publish, or preparation of the manuscript. The findings achieved herein are solely the responsibility of the authors. Open access funding was provided by the Qatar National Library.
) grant [QUST-1-CAS-2018-21] received by LM. The funders had no role in study design, data collection and analysis, decision to publish, or preparation of the manuscript. The findings achieved herein are solely the responsibility of the authors. Open access funding was provided by the Qatar National Library.
Ethics Statement
The study was approved by Qatar University’s Institutional Review Board (IRB) with the following approval number: QU-IRB 856-E/17. A written informed consent was obtained from all participants prior to the start of the study.