
Abstract
Based on population migration data from Baidu and the spatial Durbin model, this paper examines the impact of population mobility on the spatial transmission of COVID-19 and provides a basis for forecasting epidemic transmission and guiding public health intervention plans from the perspectives of population mobility and geographical space. The results show that epidemic spreading displays a clear spatial pattern that includes not only spreading from Wuhan to the surrounding areas but also secondary transmission in the Beijing-Tianjin-Hebei, Yangtze River Delta and Pearl River Delta regions through population flows. The epidemic degree in each area is directly affected by the number of population inflows from Wuhan and indirectly affected by the spatial spillover effect from other areas. Due to the lack of strict restrictions on population flows, the spatial spillover effect in areas outside Hubei gradually strengthened after the closure of Wuhan and exceeded the direct effect, and the intensity of population flows within Wuhan had a significant impact on the spread of the epidemic. Without considering the spatial spillover effect, the model will overestimate the impact of population inflows in Wuhan on the local epidemic and underestimate the total effect of regional patterns on epidemic transmission.
Introduction
At the end of 2019, the outbreak caused by a novel coronavirus in Wuhan, China, spread rapidly. In approximately 1 month, the virus had spread to all provinces in China and to more than 30 countries and regions. On January 20, 2020, the Chinese National Health Committee identified the infectious disease as a class-B infectious disease and took preventive and control measures for class-A infectious diseases. On January 23, 2020, Wuhan announced the “closure” of the city. Public transport, subway, ferry, and long-distance passenger transport enterprises in Wuhan were forced to suspend operation, and airports, railway stations and other departure channels were temporarily closed. Subsequently, other provinces and cities have begun to control population flows by launching level-1 response strategies for major public health emergencies. Novel coronavirus infection was identified as a “public health emergency of international concern (PHEIC)” by the WHO on January 30, 2020, and the new coronavirus disease was named “COVID-19” on February 11th. Since the outbreak of the epidemic, the government has organized medical teams from all provinces and cities to help Hubei, and the medical control measures in all regions have been strengthened. However, at the national level, especially in Hubei Province, the epidemic remains severe. By February 13, 2010, 63,932 COVID-19 cases were diagnosed in China, and 1,381 cases were fatal. The outbreak coincided with China’s Spring Festival, and many population flows accelerated the spread of the epidemic.
Humans around the world have been impacted by new viruses, such as severe acute respiratory syndrome (SARS), H1N1 influenza virus, h7n9 influenza virus, Middle East respiratory syndrome and Ebola virus (WHO Ebola Response Team, 2014), and international public health emergencies, especially in recent years; such events have triggered a dramatic response from the global public. Despite the efforts made in various countries in the fields of medicine and public health, the incidence of infectious diseases has not decreased with economic development. After 2003, to avoid the reoccurrence of SARS and the occurrence of similar epidemics, scholars focused on studying the transmission mechanisms of epidemics; however, in the early stage, few studies have attempted to capture the spatial components of epidemic data (Wang et al., 2006). In fact, the spatial flows of a population are closely related to the spread of epidemics. Population flows can promote the spread of infectious diseases, thus increasing the scale of infectious diseases from the regional or national level to potentially the international scale (Frenk et al., 2011; Tang et al., 2006). The cross-regional spread of SARS was consistent with the population flows among cities, which indicated that population flows were the most important factor that influenced the spread of SARS (Wang et al., 2016). Notably, the global aviation network promoted the international spread of SARS (Parashar & Anderson, 2004). The novel coronavirus not only spread to the areas surrounding Wuhan but also to Beijing, Shanghai, Guangzhou and other places, which formed new epidemic centers. Although many studies have explored the spread of the epidemic in local areas (such as communities, hospitals and surrounding cities), few studies have been performed at the national level (Xu et al., 2014). In recent years, with the large-scale construction of infrastructure, such as high-speed railways, the numbers and magnitudes of population flows among cities in China have significantly increased. Additionally, because the outbreak of the epidemic coincided with the Spring Festival, the passenger traffic volume was significantly higher than the standard volume. Therefore, it is necessary to study the impact of large-scale population migration on the spread of the epidemic.
It is important to identify how population mobility affects epidemic transmission to improve the effect of epidemic control. Many scholars have performed studies to explain the spatial process of the transmission of infectious diseases and the corresponding influential factors, such as spatial heterogeneity, spatial proximity and other economic, social and environmental variables. Scholars have used the susceptible-infector model (SI), susceptible-infector-remover model (SIR) and their extended versions to study the spatial spread of SARS in cities (Sigdel & Mccluskey, 2014; Wang et al., 2005) and the effects of proximity, population mobility and network topology on the spread of SARS (Han et al., 2014; Reiner et al., 2014; Xu et al., 2006). Some studies have used gravity models to analyze the spatial characteristics of the flows of infected people and the intensity of disease transmission (Balcan et al., 2009; Truscott et al., 2012). With the help of geographic information systems (GISs), scholars can use spatial statistics and spatial analysis technology to describe the spatial and temporal clustering (Liu et al., 2015), spatial correlation (Lee & Wong, 2011; Ying & Chen, 2013) and spatial heterogeneity (Agusto, 2014) trends of SARS and influenza A (H1N1) in detail. In general, these studies have made notable contributions to understanding the mechanisms of disease transmission from a spatial perspective. However, in these studies, the spatial dependence and spillover effect of epidemic transmission have not received sufficient attention, and the spatial characteristics of infectious disease transmission cannot be accurately described, especially the impact in relevant regions and feedback related to the transmission source and adjacent regions (Griffith & Fischer, 2013). Spatial autocorrelation models or spatial error models are usually needed to test the spatial dependence and spatial spillover effect of epidemic transmission. However, these models use a spatial weight matrix based on spatial proximity and geographical distance to measure the impact of spatial dependence on epidemic transmission and cannot depict the important impact of regional population flows on epidemic transmission.
In view of the shortcomings of previous studies, we use population migration data from Baidu to analyze the spatial transmission mechanism of the epidemic from the perspectives of population mobility and urban connection. We attempt to determine how the epidemic spread from Wuhan to other areas based on a floating population network by answering the following questions: What are the spatial characteristics of the epidemic distribution in China? and Are the various measures used to control population flows, such as closures, regulations and community isolation, effective? The innovation of this paper is mainly reflected in the following aspects. (1) From the perspective of population flows, the spatial mechanism of epidemic transmission is discussed. The virus not only infects local residents through population flows but also leads to spillover effects in other regions through population flows among regions, and the estimation result without considering spatial spillover effects will be biased. Moreover, the prevention and control measures for infectious diseases usually directly control the target population in a certain area and indirectly affect the population in the relevant area. (2) An improved measurement method is adopted to measure the impact of population flows and the corresponding spillover effects. Spatial econometric models rely on characteristic variables related to source and destination areas and on functions suitable for describing the relationships among sources and destinations. In this paper, the spatial Durbin model (SDM) is used to evaluate the direct effect and spillover effects of population flows on epidemic transmission. (3) The urban geographic units in China were selected to analyze population flows, epidemic spreading and spatial spillover effects. In the process of spatial data analysis, it is necessary to consider the spatial scale effect. If the spatial scale is too large, spillover effects will be unmeasurable, and regional internal differences will be ignored, thus reducing the accuracy of the analysis; thus, fine spatial units are used to identify geographical correlations.
The remainder of the paper is arranged as follows. The second section uses spatial statistical and spatial data analysis methods to assess the spatial distribution characteristics of Wuhan population outflows before the outbreak and the temporal and spatial evolution characteristics of the epidemic spread. In the third section, based on a gravity model, the regional population flows are integrated in a mechanism analysis of the spatial spread of the epidemic; then, an econometric model is constructed for subsequent evaluations. The fourth section includes the presentation and discussion of the empirical results. The final section is the conclusion of the article.
Spatial Characteristics of Population Flows and Epidemic Spreading
Spatial Characteristics and Trend of Epidemic Spreading
The Chinese Center for Disease Control and Prevention conducted a retrospective analysis of 44,672 confirmed cases in 31 provinces as of February 11. The results showed that the peak period of cases in Hubei Province and other provinces was from January 24 to 27, 2020, indicating that the population flows during the Spring Festival accelerated the spread of the epidemic (Novel Coronavirus Pneumonia Emergency Response Mechanism Epidemiology Group of China Center for Disease Control and Prevention, 2020). Based on the data for confirmed cases published by national and regional health committees each day, the spatial distribution characteristics of cases on January 25, January 31 and February 13 are shown in Figure 1. The spatial spread of the epidemic was mainly from Wuhan to the surrounding areas. In terms of time, the virus mainly spread to other areas within Hubei Province in the early stage and then to neighboring areas around Hubei Province. These areas are relatively close to Wuhan City, and the populations and economies are highly linked. Second, in addition to the spread of the epidemic to the surrounding geographical areas, spreading occurred to far-away central cities such as Beijing, Shanghai, Wenzhou, Shenzhen, and Guangzhou. To further characterize the local spatial distribution characteristics of the epidemic, the local indicators of spatial association (LISA) can be used to analyze the corresponding spatial clustering characteristics. First, the local Moran’s I index for the number of confirmed cases at three points in time was calculated, and a LISA cluster diagram was drawn based on a significance test (Figure 2). If a particular region’s characteristics of a variable’s value is high, and the adjacent area’s value is also high, namely, the High value area geographically represented the characteristics of the spatial agglomeration, such area is the H-H association area (High-High type association area); It is clear from Figure 2 that most H-H type cases were distributed around Wuhan, including inner cities in Hubei Province and other cities in the vicinity of Hubei Province. The number of H-H type cases increased with time, and the epidemic gradually spread to the surrounding areas. Additionally, as the epidemic spread, there H-H type areas were observed in the Beijing-Tianjin-Hebei, Yangtze River Delta and Pearl River Delta regions, indicating that diffusion occurred.

Spatial distribution of the COVID-19 cumulative number at different time points: (a) 25/1/2000, (b) 31/1/2020, and (c) 13/2/2020.
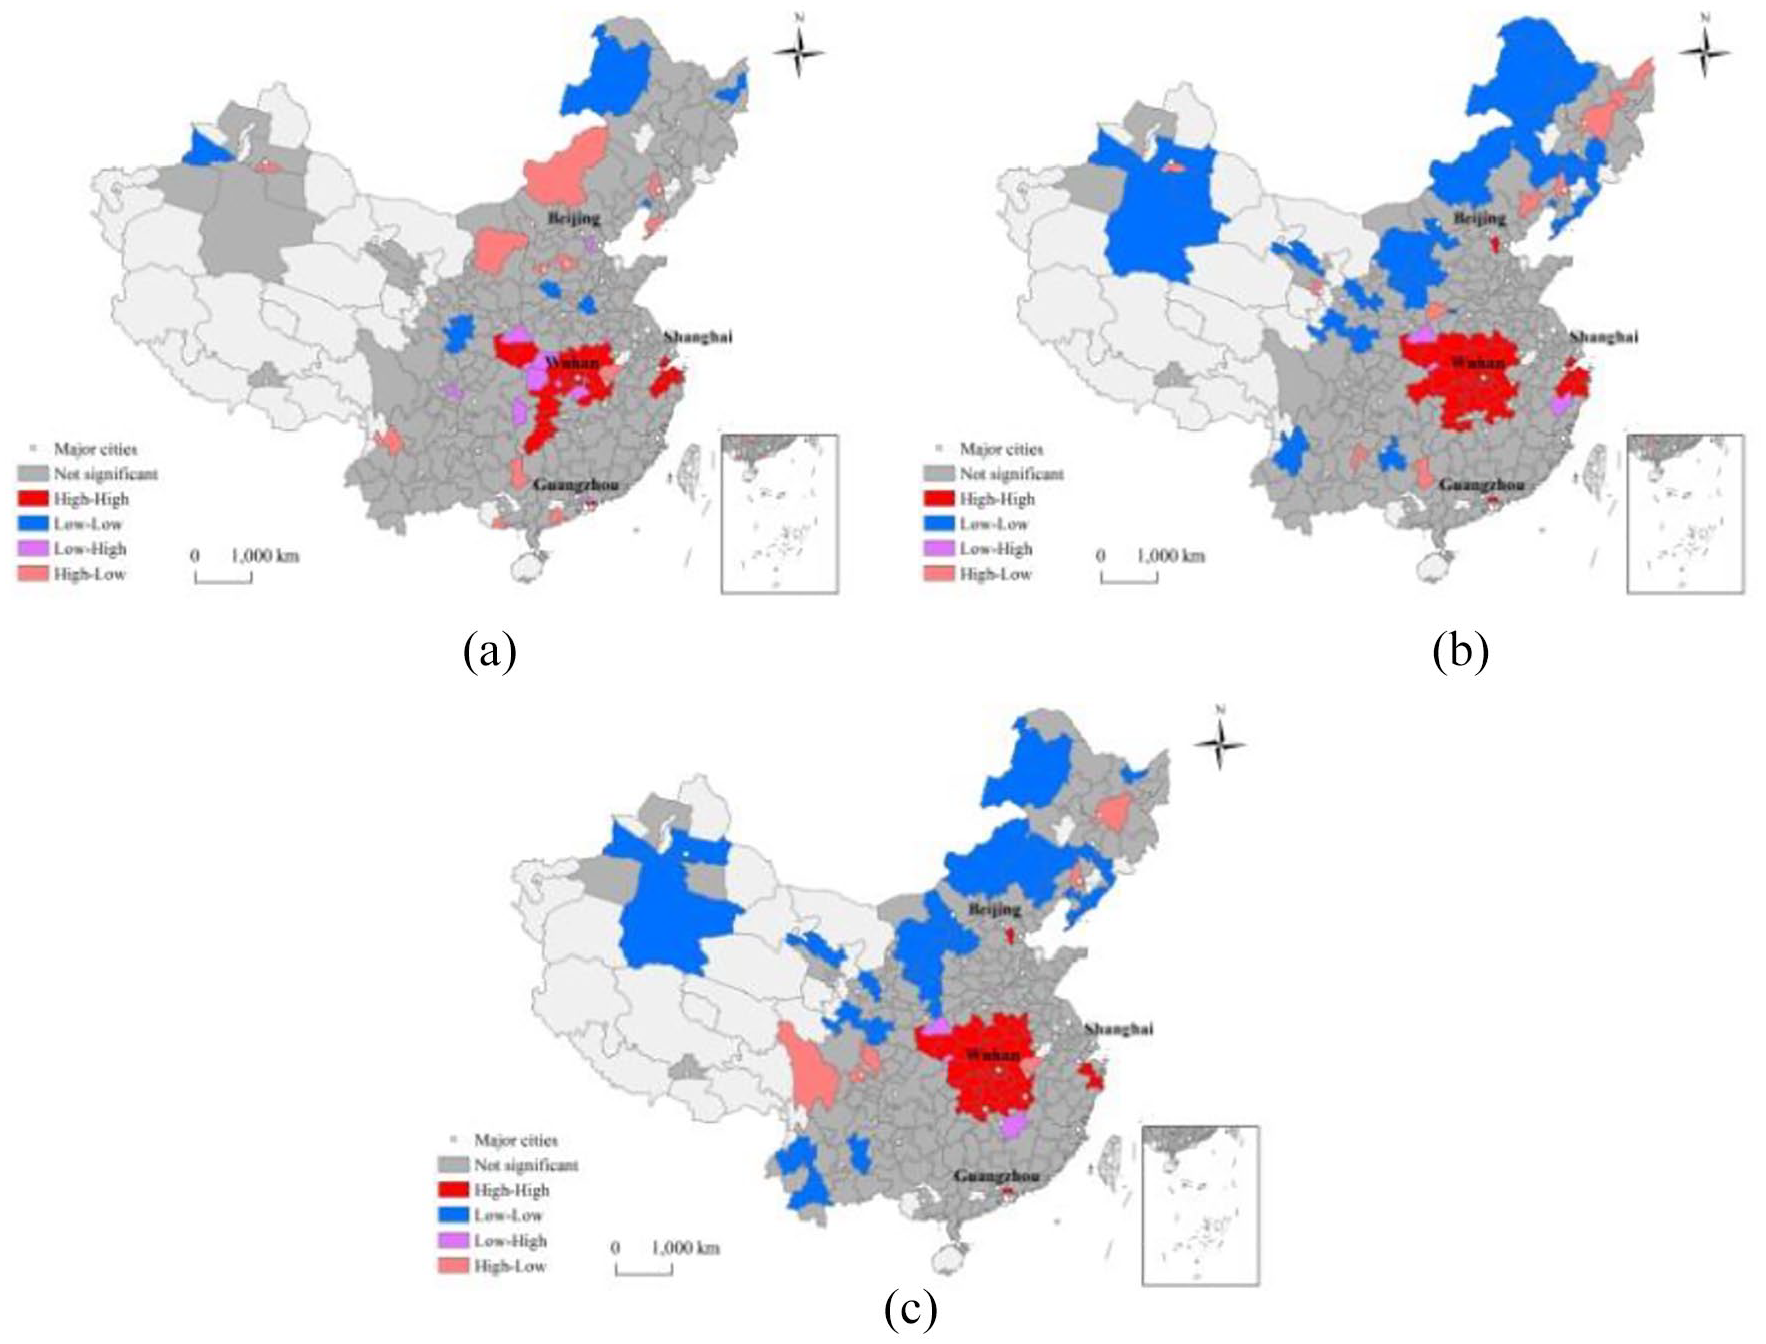
Spatial agglomeration of the number of COVID-19 cases at different times: (a) 25/1/2000, (b) 31/1/2020, and (c) 13/2/2020.
Correlation Between Population Migration and Epidemic Spread
Cross-regional population flows are the main mechanisms for the spread of epidemics. We use population migration data from Baidu to visually observe the relationship between population migration and spreading. Baidu flow scale index is divided into population outflow scale index and population inflow scale index. Baidu does not directly open the population flowing concrete numerical value because of the data privacy protection. Thus, it concretes numerical value into scale index. The population flow scale index represents the scale of the actual population flow and it can compare cities objectively. First, according to the scale of population outflows from Wuhan over time, the spreading process can be divided into three stages. The first stage was before the Spring Festival, and the scale of population outflows continually increased in this period, varying from 3.46 on January 1 to 8.14 on January 9. The second stage began on January 10, when the whole country was celebrating the Spring Festival; the scale of population outflows from Wuhan increased rapidly from 6.62 on January 10 to 11.84 on January 22, with a particularly high increase in the 3-day period from January 21 to January 23. The Spring Festival coincided with the maximum population outflow scale in Wuhan (higher than that before the Spring Festival in 2018). In view of the severe situation created by the epidemic, Wuhan began to close on January 23, and the scale of population emigration in Wuhan abruptly decreased to 3.89, or only 50% of the value in the same period in 2018. Since then, the scale of population outflows in Wuhan has continued to decline. After January 28, the scale of population outflows remained below 0.3 (Figure 3). From a regional perspective, the scale of flows to Wuhan was significantly larger than the scales of flows to other provinces, and there was a clear peak in travel before the Spring Festival. However, the population flows to other provinces were relatively stable in the period around the Spring Festival, with only a small increase before the festival (Figure 4). Therefore, in Wuhan and the surrounding areas in Hubei Province, the flows were considerably affected by the Spring Festival. Overall, the increased return flow before the Spring Festival intensified the spatial transmission intensity of the epidemic, and the timely control of population flows in Wuhan and other areas of Hubei significantly inhibited the further spread of the epidemic.

Trends of Wuhan population outflows before and after the Spring Festival in 2019 and 2020.

Regional distributions and trends of population outflows in Wuhan.
To intuitively show the correlation between the population inflows from Wuhan and the regional epidemic situation, we selected the top-100 cities with population inputs from Wuhan pop during the Spring Festival as observed samples; the population inflows to these cities account for more than 90% of the total population outflow from Wuhan each day. The population outflows from Wuhan mainly flow to other prefecture-level cities in the province and the adjacent areas around Hubei. The top-15 cities are all cities in Hubei Province, and they include Xiaogan, Huanggang, Jingzhou, Xianning, Ezhou, Xiangyang and other prefecture-level cities, as well as Xiantao and Tianmen, which are county-level cities. Areas outside the province with large inflows from Wuhan include Xinyang, Chongqing, Changsha, Beijing, Nanyang and Shanghai, as well as neighboring cities in other provinces such as Henan, Hunan and Jiangxi; these cities had many confirmed cases outside the province. By drawing scatter plots of the population inflow scale and the number of confirmed infections in each city on January 31 (a) and February 13 (b), we find that the relationship between epidemic development and population inflows from Wuhan is very obvious (Figure 5). However, the spatial spillover effects in other regions should be considered because the population flows in these regions also had an important impact on the spread of the epidemic.

Correlation between the number of confirmed cases and the total population inflow from Wuhan: (a) 31/1/2020 and (b) 13/2/2020.
Measurement Method and Data Description
Construction of the Measurement Model
In a multi-region setting, epidemic spreading can be represented by a weighted average of the local infection rate and spatial infection rate, and a spatial correlation model of various regions can be used to determine the scope and speed of spreading (Xia et al., 2004). If only a simple spatial migration of infected people occurs, then distance may be the most important determinant of spreading. However, due to the complexity of economic and social relations, the spatial network of virus transmission is generally more complex. Because the spread of epidemics depends on the flow of individuals with viruses and the incubation period, we introduce a gravity model. Such models are widely used in transportation theory research. The strengths of the connections between regions depend on the sizes of the two regions and the distance between the two regions, as shown in Formula (1):
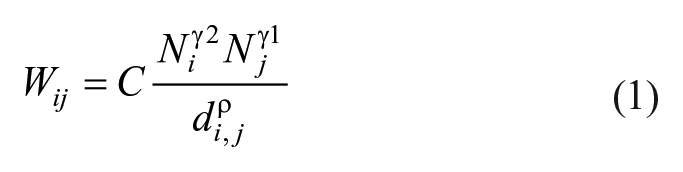
In Formula (1),

In formula (2), α quantifies how the instantaneous infection intensity changes with the size of the source region, γ determine how the attraction of region i changes with population size. On the basis of two regional models and according to the gravity model, the transmission intensity of region i to region j is

In the above formula,
Based on the analysis of the above models, an econometric model is constructed. The increase in the number of infected people in each region is closely related to the number of population flows with a history of exposure in Wuhan. In addition to focusing on the impact of population migration from Wuhan to local areas, other important factors include the population scale, population density, and location characteristics and traffic factors in each region. Based on the above factors, the basic measurement model is established as follows:

In formula (4),
The focus of this study is establishing a spatial mechanism for population migration in the context of epidemic spreading, that is, to investigate the impact of the number of infections in other regions on the number of infections in a given region. Some scholars did seminal spatial econometric work on the coronavirus virus spread (Jagodnik et al., 2020; Krisztin et al., 2020; Narayanan et al., 2020). Considering the significant spatial dependence of the number of infections and the spatial distribution of population flows, this paper constructs an SDM that includes the spatial lag effects of independent variables, which can capture the spatial spillover effect of epidemics (Elhorst, 2010). The advantage of the SDM is that unbiased estimations of coefficients can be obtained based on this model, whether the real data generation process is based on a spatial lag model or spatial error model. Additionally, this approach does not impose any restrictions on the scale of potential spatial spillover effects, making it generalizable. The form of the SDM is as follows:

In equation 5, W represents the N-order spatial weight matrix. The spatial weight matrix and variables are multiplied to form spatial lag variables. The weighted coefficients for other regions and the Wuhan population inflow (
To measure the intensity of the novel coronavirus epidemic in other areas, the correlations between other regions and the local area must be determined to identify the transmission mechanism. Based on the intercity population flow matrix, this paper measures the spatial spillover effect. The urban population flow matrix was obtained from Baidu population flow data. Since each flow involves an origin-destination pair, the population flow matrix is a

In formula 6, W is the spatial weight matrix of population flows, wij is the spatial weight of the influence of characteristic variables corresponding to region i on those in region j; in this paper, this value is the spatial weight of the epidemic effect in region j due to population flows from region i. The multiplication of the spatial weight matrix with the corresponding variables for other regions yields the weighted sum of the variables for other regions. With the establishment of a spatial weight matrix, the transmission mechanism of epidemic spreading through regional population flows is formed.
Index Selection and Data Description
There are two ways to quantify the intercity population flow data: use a gravity model to predict the flows of elements and observe the spatial interactions between regions or use survey methods to obtain sample data, such as census data and survey data, for intercity population migrations (Gao, 2018). However, the data obtained by estimation and sample survey methods cannot directly and comprehensively reflect the overall effects of all important factors. The development of big data technology has made it possible to directly observe migration behavior. In this paper, we use the “Baidu migration” based on urban migration data as a new measure of population migration. “Baidu migration” data are obtained from the Baidu location-based service (LBS) following encryption and desensitization (to protect privacy). As of February 2019, Baidu maps serves requests for more than 100 billion daily location services, and the number of monthly active hardware devices reached 1.1 billion, covering all major administrative divisions at the provincial, municipal, district and county levels. In the context of the popularization of smart devices, “Baidu migration” big data provide excellent representativeness and can comprehensively reflect the actual population mobility and migration situations in China (Zhou & Wang, 2017).
In this paper, we use daily intercity floating population data from January 10 to January 24, 2020, to form the Baidu migration measurement index of intercity population flows. Considering the availability of data, this study selects the top-100 cities with the strongest connections with Wuhan; population migration data are available for migrations from each city to the other 99 cities. The daily cross-city flow data for individual cities from January 10 to January 24, 2020, are summed to obtain the total urban migration and emigration values. We use the cross-city population flow data during the Spring Festival to build the spatial weight matrix. Notably, according to existing research, the peak period of case incidence was January 24 to 27, and 68.6% of the reported patients lived in or visited Wuhan within 14 days before the onset of the disease or had close contact with Wuhan patients. On January 10, the first day of the Spring Festival, the flows of students and workers returning home began to rapidly increase, so this period was the key period for epidemic spreading through population flows.
Other variables that may have affected the spread of the epidemic were also controlled. These important factors include the internal travel intensity, population size and density, passenger transport scale and geographical location. In this paper, the intensity index of urban travel (intensity), urban resident population (pop), population per square kilometer of built-up area (density), number of high-speed rail departures (HSR), and distance to adjacent large cities (dis) are measured. Among them, HSR data were obtained from 12,306 China Railway website, which is an important website for railway service customers to purchase travel tickets. The city travel intensity was obtained from Baidu data, and the city travel intensity was calculated as the ratio of the number of people who have traveled in the city to the resident population of the city. The distance from a large city was expressed by the shortest distance between each city and four municipalities directly under the central government, provincial capitals, and sub-provincial cities. Other data were from the “China Urban Statistical Yearbook.” As shown in the following table, I_31/1, I_5/2 and I_13/2 is the number of confirmed cases on January 31st, Feb 5th, and Feb 13th, respectively, flow_wh is the population inflow scale in Wuhan, pop is the number of permanent residents, density is the population density, intensity is the urban travel intensity, HSR is the number of HSR departures, and dis is the distance to large cities. The statistical descriptions of variables are listed in Table 1.
Statistical Descriptions of Variables.

Note. All values were log normalized.
Results and Discussion
Regression Results for the Benchmark Model
The peak period for reported cases in and outside of Hubei Province was January 24 to 27. A total of 68.6% of the reported infected individuals lived in or visited Wuhan within 14 days before the onset of the disease or had close contact with Wuhan patients. Considering that the median latency of COVID-19 is 3 days, the cumulative number of confirmed cases on January 31 is selected as the explanatory variable (Guan et al., 2020). Moreover, in terms of the spatial characteristics of the spread of the epidemic, the number of infected in other provinces was increasing before January 31, and the growth rate then slowed. Second, since the reported cases reached a peak from February 3 to 5, we took the number of confirmed cases on February 5 as the explanatory variable. Notably, considering the latent time of the cases and the time interval between infection and diagnosis, it is reasonable to take the number of confirmed cases on February 5 as the result of the population flows from Hubei to all parts of the country before the Spring Festival. Finally, the confirmed cases after February 5 include many secondary transmission cases from the region. Thus, we take the number of confirmed cases reported on February 13 as the explanatory variable to identify the changes in the spatial spillover effect. The measurement results are shown in Table 2.
Regression Results for the Basic Model.

Note. Values in brackets refer to p statistics; ***, **, and * denote significance at levels of 1%, 5%, and 10%, respectively.
Model (1) and (2) use the pneumonia infections before January 31 as dependent variable. Model (1) does not add the variables of ln(pop) and ln(dis_wh), while model (2) adds these two variables in order to observe whether the regression results have change, at the same time, observe these two variables effect on the spread of the pneumonia. Model (3) and (4) use the pneumonia infections before February 5 as interpreted variable. Model (5) and (6) use the pneumonia infections before February 13 as interpreted variable. In the estimation results for models (1), (3), and (5), the regression coefficients of ln(flow_wh) are significantly positive at the 1% level (coefficients are .759, .827, and .887, respectively). The results indicate that the number of COVID-19 cases was significantly affected by population inflows from Wuhan during the Spring Festival, and the greater the population inflow magnitude, the more serious the epidemic. Among those of the three models, the regression coefficients of ln(flow_wh) increase in turn without considering the effects of other factors, indicating that over time, the impact of population inflows from Wuhan gradually increased. In regression models (2), (4), and (6), two factors are added: the regional population and distance to Wuhan. The regression results show that first, the regression coefficients of ln(flow_wh) are still significantly positive at the level of 1% and gradually increase. In model (2) and model (4), the estimated coefficients for ln(pop) are significantly positive at the 1% level (coefficients are .451 and .302, respectively). The results indicate that the regional population size has a significant impact on the regional epidemic situation. Moreover, a large population in a region generally coincides with a strong connection with Wuhan and, thus, increased probability of population floating and epidemic spreading. The regression coefficient of geographical distance to Wuhan is significantly negative in models (2) and (4), which suggests that the epidemic spread decreased with geographical distance.
In addition, the regression coefficient of ln(intensity) is significantly positive in models (1) to (6), which indicates that under the control of population inflows in Wuhan, the higher the population travel intensity is, the greater the number of people infected, and the greater the impact of epidemic spreading. Moreover, sequential increases in coefficient values and significance levels suggest that the impact of urban travel intensity on the spread of the epidemic is becoming more and more obvious. The impact of population density (ln(density)) on the epidemic situation is significantly negative in most models, and the main reason for this result may be that the epidemic situation is more significantly affected by population flow. The regression coefficients of ln(HSR) and ln(dis) is not significant, indicating that the impact of the number of HSR departures and the distance to large cities is not obvious, which further illustrates the importance of population mobility.
Regression Results Considering Spatial Spillover Effects
The focus of this study is to establish the “spatial mechanism” of population flows in the context of the spread of the epidemic. In addition to examining the effect of population inflows in Wuhan on the local epidemic, we must examine the impact of population flows on the number of infections from other regions to accurately evaluate the spatial effect of epidemic transmission. The important role of the spatial spillover effect in the process of epidemic transmission is investigated in this section. The corresponding econometric equation was estimated, and the regression results are shown in Table 3.
Estimation Results of the Spatial Durbin Model.
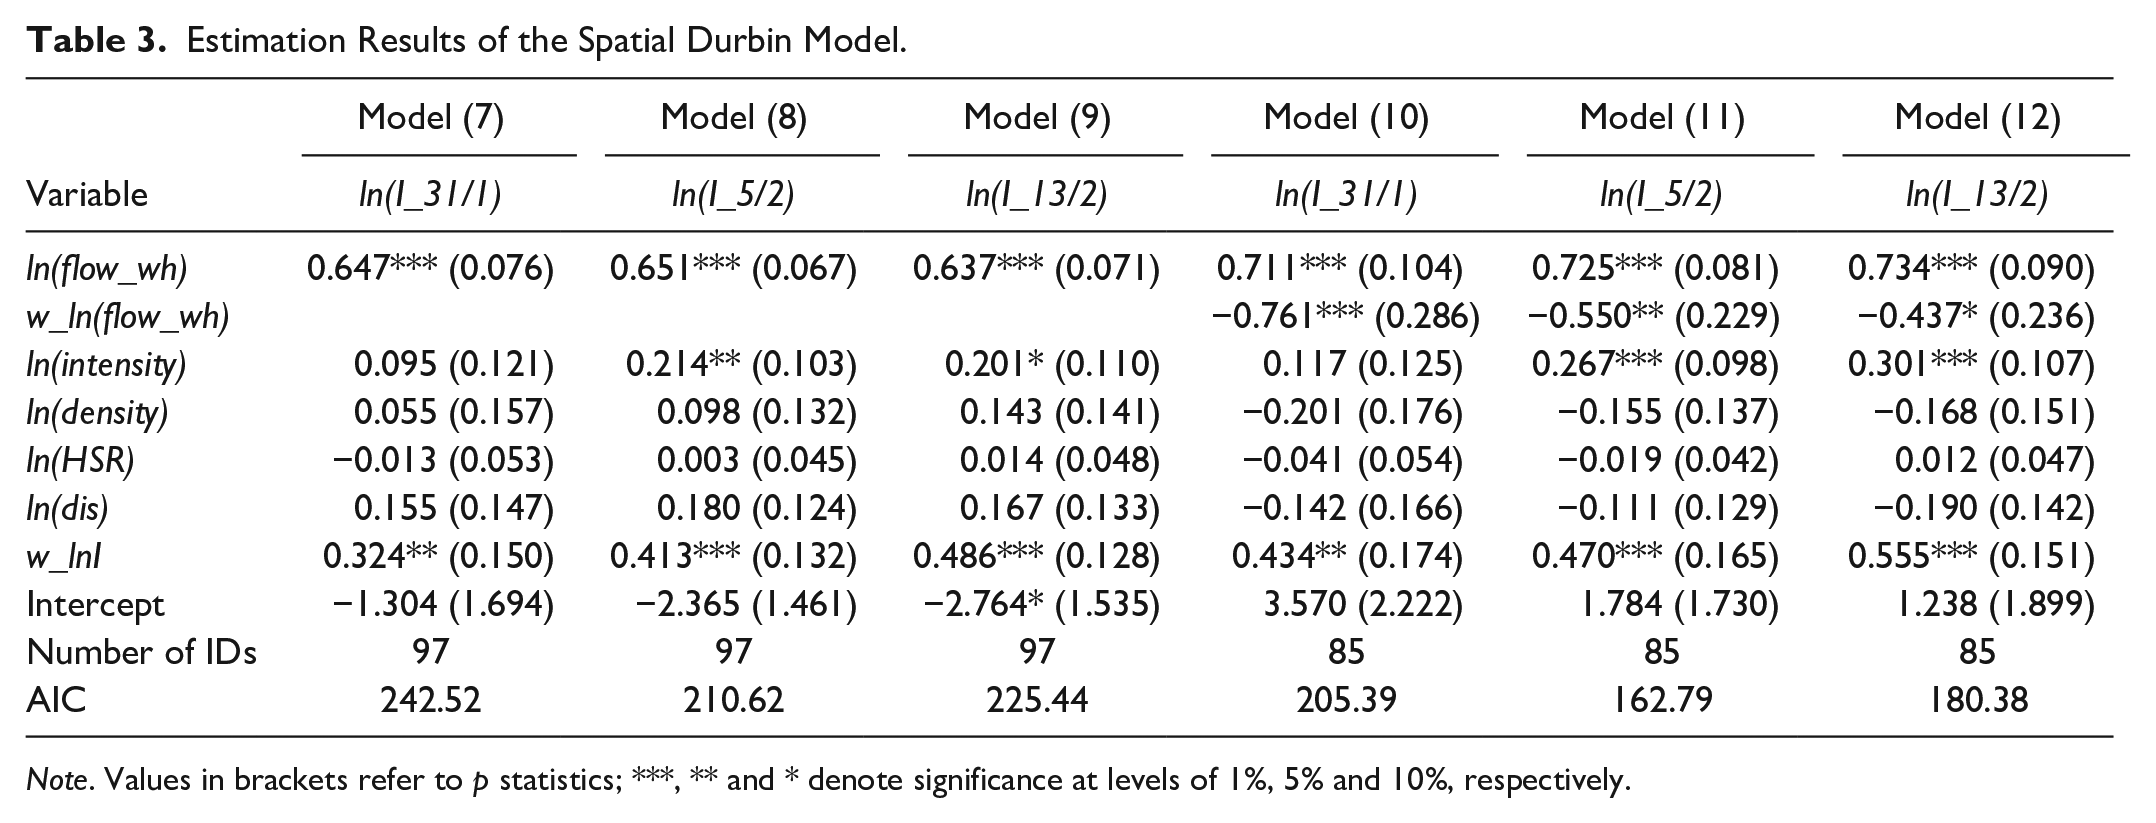
Note. Values in brackets refer to p statistics; ***, ** and * denote significance at levels of 1%, 5% and 10%, respectively.
Model (7) to (9) do not add the variable of Wuhan’s population flow into other areas, while, model (10) to (12) add the variable of Wuhan’s population flow into other areas. In model (7), model (8) and model (9), the regression coefficients of ln(flow_wh) are significantly positive at the level of 1% (coefficients are .647, .651, and .637, respectively), indicating that Wuhan population inflows had a significant positive impact on the local epidemic, but the coefficient values are lower than the estimated results in Table 2. Additionally, the regression coefficients of the epidemic-weighted variable (w_lnI) based on population flows are significantly positive at the 5% level (coefficients are .324, .413, and .486, respectively), which suggests that population flows in other regions had a significant positive impact on the local epidemic situation and reveals the existence of a spatial spillover effect. Moreover, the influence coefficients sequentially increase at three points in time, indicating that the spatial spillover effect gradually increased. The model shows that the outbreak in Wuhan had an exogenous impact on the closely related urban network of 97 cities with high population mobility. The population flows from Wuhan to these areas directly affected the severity of the epidemic. In the absence of restrictions on population mobility, these areas in turn affected epidemic spreading in Wuhan and Hubei through population migration. In this flow network, we must consider the effect of population mobility outside Hubei Province on the spread of the epidemic, which directly influences the implementation scope and intensity of epidemic intervention policies. Therefore, based on the above model, we investigate the direct impact and spatial spillover effect of epidemic spreading in areas outside Hubei Province.
In models (10), (11), and (12), the regression results for 85 cities outside Hubei Province are given. First, the regression coefficients of ln(flow_wh) are significantly positive at the 1% level (coefficients are .711, .725, and .734, respectively), which indicates that the population inflows from Wuhan had a significant positive impact on the local epidemic. The coefficient values are higher than the estimated results in Table 3, which indicates that the impact of population inflows from Wuhan on the development of the regional epidemic was obvious outside Hubei. Notably, the early local transmission trend in Hubei Province was serious. Second, the regression coefficients of the epidemic-weighted variable w_lnI based on population flows are significantly positive at the 1% level (coefficients are .434, .470, and .555, respectively), which indicates that the trends in other regions had a significant positive impact on the local epidemic and reveals the existence of a spatial spillover effect. In addition, the impact coefficients are greater than the estimated results in Table 2, indicating that the spatial spillover effect for the epidemic was notable in areas outside Hubei Province. Moreover, the influence coefficients sequentially increase at three points in time, indicating that the spatial spillover effect gradually increased. Finally, the regression results for the spatial lag term w_ln(flow_wh) of Wuhan population flows are significant based on models (10), (11), and (12) (the coefficients are −.761, −.550, and −.437, respectively), and the absolute values of the regression coefficients in the three models decrease in turn. The results indicate that the spread of the epidemic in the region was affected not only by the population connections with Wuhan but also by inflows from other regions, especially cities with strong population connections. Among other variables, only the regression coefficients of the travel intensity within Wuhan are significant in most models; that is, the greater the travel intensity within the city is, the greater the probability of effective contact and infection, and the more serious the urban epidemic development situation.
Direct and Spatial Spillover Effects
The above estimates suggest that the population inflows from Wuhan not only had a significant direct impact on the epidemic situation in the region but also generated a significant spatial spillover effect. It should be noted that the SDM mentioned extracts the maximum common divisor based on the spatial weight matrix of variable influence coefficients and cannot be used to obtain the direct impact of an explanatory variable on an interpreted variable or the actual size of the spatial spillover effect; therefore, it is impossible to perform accurate comparative numerical analyses. LeSage and Pace (2008) used a partial differential method to divide interactions among variables into direct effects and indirect effects. Therefore, referring to the method of LeSage and Pace (2008), the SDM can be rewritten as follows:

where I is a unit vector. Based on a partial differential matrix for all spatial units, the impact of population inflows in Wuhan on the number of confirmed cases can be expressed as follows:

The direct effect is the average value of the diagonal matrix elements, and the indirect effect, namely, the “spatial spillover effect,” is the average value of the sum of the nondiagonal elements in each row and column. In this paper, the spatial spillover effect of population inflows from Wuhan on the number of confirmed local cases is reflected by the spatial weight matrix. Based on the method of LeSage and Pace (2008), the calculation results for direct and indirect effects are shown in Table 4.
Direct and Spatial Spillover Effects.

Note. ***, **, and * denote significance at the 1%, 5%, and 10% levels, respectively.
Model (13)–(15) add all of the samples, while Model (16)–(18) show the regression results of sample exclude cities of Hubei province. After removal of sample of Hubei urban, the corresponding direct effect, indirect effect and total effect is bigger, shows a greater role in Wuhan population inflows. From the respective of time, the direct effect increases at first and decreases after that, and the indirect effect continues to increase, shows that region population flows between the influence the spread of the epidemic. The results show that the population inflows from Wuhan had a significant positive direct impact on the increase in the number of confirmed cases in the region. With the population flow matrix, the population inflows from Wuhan to other regions were found to yield a significant positive spatial spillover effect on the number of cases, and the overall effect was also positive and significant. Specifically, in model (15), for every 1% increase in the scale of the population inflow to Wuhan, the number of local confirmed cases increases by 0.655%, and if the scale of the population inflow from Wuhan to other regions increases by 1%, the number of local confirmed cases will increase by 0.585%, resulting in a total effect of 1.240%. The impact of the spatial spillover effect in model (5) is 1.4 times that for model (15) (the estimated coefficient of the Wuhan population inflow scale is 0.887 in model (5)). The results suggest that the model that does not consider the spatial spillover effect will overestimate the impact of population inflows from Wuhan on the local epidemic and underestimate the total impact of population flows in each region on the epidemic. The local population inflows in Wuhan and other areas had a significant impact on the local epidemic. It is worth noting that the regression coefficient for the ratio of the population inflow from Wuhan to the number of confirmed cases is significantly positive, which reflects the “cumulative effect” obtained by considering the two-way spatial spillover effect. In turn, an increase in the population inflow from Wuhan both increases the number of local cases and increases the magnitude of the epidemic in other areas through spatial spillover effects. In models (10), (11), and (12), the direct effect and spatial spillover effect of population flows on the epidemic situation in areas outside Hubei Province are given. The results indicate that the direct effect of population flows from Wuhan on the epidemic situation gradually increased, while the indirect effect increased faster and exceeded the direct effect in model (12), namely the indirect effect is 0.884 larger than the direct effect is 0.742, indicating that the indirect effect played a more important role after the closure of Hubei Province.
From the perspective of spatial mechanism of epidemic transmission, the epidemic spread from one place to another mainly through population flows. The virus not only infects local residents but also leads to spillover effects in other regions through population flows among regions. So, the coronavirus confirmed cases are spatially dependent. This paper and the researches by Krisztin et al. (2020) and Narayanan et al. (2020) all highlight the importance of spatial econometrics for capturing disease transmission pathways and network effects, as well as in quantifying the magnitude of spatial spillovers. However, there are main three differences between these three studies.
Firstly, this paper attempts to answer different questions. Krisztin et al. (2020) focus on the importance of alternative spatial linkage structures such as the number of flight connections, relationships in international trade, and common borders and attempt to answer which type of linkage playing a particularly important role in the early stages of the virus spread between countries. They allow for four alternative types of spatial weight matrices: common borders, the intensity of bilateral flight connections, the total number of weekly commercial flights between country pairs and trade intensity and international agreements guaranteeing. Narayanan et al. (2020) focus on evaluating the impact of social distancing behavior and stay-at-home behavior on the spatial transmission of COVID-19 through spatial econometric estimation. They believe that consultation among officials of nearby counties could lead to them adopting similar policies, and chooses the adjacency spatial weight matrix.
In this paper, we mainly studied the spread of epidemic among different cities in China in the early days of the outbreak of epidemic and focuses on examining the impact of population mobility on the spatial transmission of COVID-19. Compared with population flows between countries, the spread of epidemic between different cities is mainly due to the frequent population flow. And based on population migration data from Baidu, we capture the real population flow between cities. Furthermore, the transmission channel of the epidemic among Chinese cities is relatively clear. The spread of epidemic between different cities is mainly due to the frequent population flow. We made a clear choice of the spatial weight matrix of population flows to make the spatial econometrics estimation.
Secondly, there are obvious differences in model selection among these three papers. Narayanan et al. (2020) make use of cross-sectional spatial econometric model to examine the evolution of the estimated coefficients over time since the onset of the COVID-19 pandemic in the United States. Krisztin et al. (2020) make use of a spatial autoregressive (SAR) dynamic panel model and Poisson SEM to estimate the spatial spillover effect. However, considering the significant spatial dependence of the number of infections and the spatial distribution of population flows, this paper constructs an SDM dynamic panel model that includes the spatial lag effects of independent variables, which can capture the spatial spillover effect of epidemics.
Thirdly, to study the city lockdown effect, this paper also discusses the direct and spatial spillover effects in different periods before and after the lockdown of Wuhan. The result show that the spatial spillover effect between areas outside Hubei gradually strengthened after the lockdown of Wuhan and exceeded the direct effect, and the internal interactions among urban networks became an important source of influence. Moreover, similar with Narayanan et al. (2020), this paper also estimated the impact of social distancing and stay-at-home behavior on the spatial transmission of COVID-19. But different from Narayanan et al. (2020), which using cell phone tracking data to measure the stay-at-home behavior, this paper uses the population travel intensity to measure stay-at-home behavior. Therefore, to prevent and control epidemics, it is important to seal cities and control population flows in nearby areas after the initial outbreak.
Conclusions and Suggestions
Conclusions
The novel coronavirus has been the most serious public health emergency in China since its establishment. As a developing country with a large population, the outbreak and spread of the epidemic will not only harm human health but also burden the economic society. This paper uses Baidu population migration data to construct a spatial correlation weight matrix and constructs an SDM to empirically study the direct impact of population migration on epidemic transmission and spatial spillover effects. The results show that (1) in terms of spatial characteristics, the epidemic spread displayed a significant spatial pattern with Wuhan as the center and spreading to the surrounding areas; secondary transmission areas formed in Beijing, Tianjin, Hebei, the Yangtze River Delta and the Pearl River Delta through population flows. (2) The degree of epidemic in each area is directly affected by the inflow population from Wuhan. (3) The spatial spillover effect between areas outside Hubei gradually strengthened after the closure of Wuhan and exceeded the direct effect, and the internal interactions among urban networks became an important source of influence. (4) In addition to the population flows among cities, which significantly promoted the spread of the epidemic, the population flow intensity within a city also has a significant impact on the spread of the epidemic. The empirical results show that a model that does not consider spatial spillover effects will overestimate the impact of population inflows in Wuhan on the local epidemic and underestimate the overall effect of processes in other regions on epidemic transmission. In addition, differing from the daily urban connection mode, the Spring Festival scenario had a special impact on urban flows and the spread of the epidemic.
Recommendations
First, the control of population mobility through “External anti-input, internal non-proliferation” policies play a key role in controlling the spread of the epidemic. In addition to blockading the outbreak area and controlling population outflows, the impact in other areas, especially the city center, on the spread of epidemics through population diffusion should not be underestimated. Stringent measures should be immediately implemented in affected cities to avoid the emergence of new peak areas of transmission. Second, we should assess the direction and intensity of population flows to scientifically predict the development trends of epidemics and effectively control the epidemic in different areas. The festival effect led to the irregular spread of the coronavirus epidemic, and controlling the numbers of migrations and departures as well as types of travel destinations after the Spring Festival should have been considered for epidemic prevention and control. Third, because the travel intensity, population, population density, and transportation scale in a city are also important factors that influence the spread of epidemics, the corresponding cities should formulate policies in terms of the return to work schedule, industry selection, workplace management, etc., to avoid sudden increases in the population and population density. Moreover, the travel intensity within a city should be reduced through social network strategies. The management of districts, schools and workplaces can be catered to reduce the frequency of travel, and inspection, prevention and control efforts can be strengthened in key places with dense personnel populations, such as stations and public places. Finally, according to the spatial distribution characteristics of the epidemic and the migration characteristics of the population, we should strengthen the inspection and observation schemes for people and implement division and classification policies to avoid insufficient prevention and control scenarios. In particular, following the festival, travel to certain destinations, such as Guangdong, Zhejiang, Shanghai, Jiangsu, and Beijing, should have been controlled. This paper explains the spatial transmission mechanism of epidemic spreading based on the spatial law of population flow, and these findings are of great significance for predicting the spread of epidemics and establishing public health intervention plans from the perspective of urban connections and geographical space in the future.
Supplemental Material
sj-jpg-1-sgo-10.1177_21582440211071086 – Supplemental material for Population Flow and Epidemic Spread: Direct Impact and Spatial Spillover Effect
Supplemental material, sj-jpg-1-sgo-10.1177_21582440211071086 for Population Flow and Epidemic Spread: Direct Impact and Spatial Spillover Effect by Chao Zhang, Si Chen, Chunyang Wang, Yi Zhao and Min Ao in SAGE Open
Supplemental Material
sj-jpg-10-sgo-10.1177_21582440211071086 – Supplemental material for Population Flow and Epidemic Spread: Direct Impact and Spatial Spillover Effect
Supplemental material, sj-jpg-10-sgo-10.1177_21582440211071086 for Population Flow and Epidemic Spread: Direct Impact and Spatial Spillover Effect by Chao Zhang, Si Chen, Chunyang Wang, Yi Zhao and Min Ao in SAGE Open
Supplemental Material
sj-jpg-11-sgo-10.1177_21582440211071086 – Supplemental material for Population Flow and Epidemic Spread: Direct Impact and Spatial Spillover Effect
Supplemental material, sj-jpg-11-sgo-10.1177_21582440211071086 for Population Flow and Epidemic Spread: Direct Impact and Spatial Spillover Effect by Chao Zhang, Si Chen, Chunyang Wang, Yi Zhao and Min Ao in SAGE Open
Supplemental Material
sj-jpg-12-sgo-10.1177_21582440211071086 – Supplemental material for Population Flow and Epidemic Spread: Direct Impact and Spatial Spillover Effect
Supplemental material, sj-jpg-12-sgo-10.1177_21582440211071086 for Population Flow and Epidemic Spread: Direct Impact and Spatial Spillover Effect by Chao Zhang, Si Chen, Chunyang Wang, Yi Zhao and Min Ao in SAGE Open
Supplemental Material
sj-jpg-2-sgo-10.1177_21582440211071086 – Supplemental material for Population Flow and Epidemic Spread: Direct Impact and Spatial Spillover Effect
Supplemental material, sj-jpg-2-sgo-10.1177_21582440211071086 for Population Flow and Epidemic Spread: Direct Impact and Spatial Spillover Effect by Chao Zhang, Si Chen, Chunyang Wang, Yi Zhao and Min Ao in SAGE Open
Supplemental Material
sj-jpg-3-sgo-10.1177_21582440211071086 – Supplemental material for Population Flow and Epidemic Spread: Direct Impact and Spatial Spillover Effect
Supplemental material, sj-jpg-3-sgo-10.1177_21582440211071086 for Population Flow and Epidemic Spread: Direct Impact and Spatial Spillover Effect by Chao Zhang, Si Chen, Chunyang Wang, Yi Zhao and Min Ao in SAGE Open
Supplemental Material
sj-jpg-4-sgo-10.1177_21582440211071086 – Supplemental material for Population Flow and Epidemic Spread: Direct Impact and Spatial Spillover Effect
Supplemental material, sj-jpg-4-sgo-10.1177_21582440211071086 for Population Flow and Epidemic Spread: Direct Impact and Spatial Spillover Effect by Chao Zhang, Si Chen, Chunyang Wang, Yi Zhao and Min Ao in SAGE Open
Supplemental Material
sj-jpg-5-sgo-10.1177_21582440211071086 – Supplemental material for Population Flow and Epidemic Spread: Direct Impact and Spatial Spillover Effect
Supplemental material, sj-jpg-5-sgo-10.1177_21582440211071086 for Population Flow and Epidemic Spread: Direct Impact and Spatial Spillover Effect by Chao Zhang, Si Chen, Chunyang Wang, Yi Zhao and Min Ao in SAGE Open
Supplemental Material
sj-jpg-6-sgo-10.1177_21582440211071086 – Supplemental material for Population Flow and Epidemic Spread: Direct Impact and Spatial Spillover Effect
Supplemental material, sj-jpg-6-sgo-10.1177_21582440211071086 for Population Flow and Epidemic Spread: Direct Impact and Spatial Spillover Effect by Chao Zhang, Si Chen, Chunyang Wang, Yi Zhao and Min Ao in SAGE Open
Supplemental Material
sj-jpg-7-sgo-10.1177_21582440211071086 – Supplemental material for Population Flow and Epidemic Spread: Direct Impact and Spatial Spillover Effect
Supplemental material, sj-jpg-7-sgo-10.1177_21582440211071086 for Population Flow and Epidemic Spread: Direct Impact and Spatial Spillover Effect by Chao Zhang, Si Chen, Chunyang Wang, Yi Zhao and Min Ao in SAGE Open
Supplemental Material
sj-jpg-8-sgo-10.1177_21582440211071086 – Supplemental material for Population Flow and Epidemic Spread: Direct Impact and Spatial Spillover Effect
Supplemental material, sj-jpg-8-sgo-10.1177_21582440211071086 for Population Flow and Epidemic Spread: Direct Impact and Spatial Spillover Effect by Chao Zhang, Si Chen, Chunyang Wang, Yi Zhao and Min Ao in SAGE Open
Supplemental Material
sj-jpg-9-sgo-10.1177_21582440211071086 – Supplemental material for Population Flow and Epidemic Spread: Direct Impact and Spatial Spillover Effect
Supplemental material, sj-jpg-9-sgo-10.1177_21582440211071086 for Population Flow and Epidemic Spread: Direct Impact and Spatial Spillover Effect by Chao Zhang, Si Chen, Chunyang Wang, Yi Zhao and Min Ao in SAGE Open
Footnotes
Data Availability
Declaration of Conflicting Interests
The author(s) declared no potential conflicts of interest with respect to the research, authorship, and/or publication of this article.
Funding
The author(s) disclosed receipt of the following financial support for the research, authorship, and/or publication of this article: Key Program of National Natural Science Foundation of China (71733001), National Natural Science Foundation of China (71503067), National Natural Science Foundation of China (71804033) and National Social Science Foundation of China (18XJL009).
Supplemental Material
Supplemental material for this article is available online.
References
Supplementary Material
Please find the following supplemental material available below.
For Open Access articles published under a Creative Commons License, all supplemental material carries the same license as the article it is associated with.
For non-Open Access articles published, all supplemental material carries a non-exclusive license, and permission requests for re-use of supplemental material or any part of supplemental material shall be sent directly to the copyright owner as specified in the copyright notice associated with the article.