
Abstract
Sports big data has been an emerging research area in recent years. The purpose of this study was to ascertain the most frequent research topics, application areas, data sources, and data usage characteristics in the existing literature, in order to understand the development of data-driven baseball research and the multidisciplinary participation in the big data era. A scoping review was conducted, focusing on the diversity of using publicly available major league baseball data. Next, the co-occurrence analysis in bibliometrics was used to present a knowledge map of the reviewed literature. Finally, we propose a comprehensive baseball data research domain framework to visualize the ecosystem of publicly available sports data applications mapped to the four application domains in the big data maturity model. After searching and screening process from the Web of Science, Science Direct, and SPORTDiscus database, 48 relevant papers with clearly indicated data sources and data fields used were finally selected and full reviewed for advanced analysis. The most relevant research hotspots for sports data are sequentially economics and finance, sports injury, and sports performance evaluation. Subjects studied ranged from pitchers, position players, catchers, umpires, batters, free agents, and attendees. The most popular data sources are PITCHf/x, the Lahman Baseball Database, and baseball-reference.com. This review can serve as a valuable starting point for researchers to plan research strategies, to discover opportunities for cross-disciplinary research innovations, and to categorize their work in the context of the state of research.
Keywords
Introduction
The complexity of modern social and scientific challenges requires integration of knowledge and research collaboration among experts from different disciplines. The era of digital age enables the availability of large datasets for analysis in many fields, which provides a variety of unique opportunities for multidisciplinary research (Cao, 2017). Scholars from different disciplines have analyzed these datasets in various approaches, which has contributed to the development of data-driven research. The sports industry has not been immune to these developments (Morgulev et al., 2018). Data and analytics have been a part of the sports industry since the 1870s when box scores were first recorded in baseball games. Among all sports, baseball is one that is highly suitable for statistical analysis because of its playing style. Time outs are held between every play, so each play can be treated as an individual event. Thus, the database websites for analyzing numbers related to baseball outnumber other sports. The revolution of using the numbers to play the game more effectively started in baseball through the famous Moneyball book (Lewis, 2004) and movie, and this approach has been adapted by almost all sports. However, it has only recently been utilized to facilitate the operation of sports franchises (Assunção & Pelechrinis, 2019). One of the main reasons for this is the technological advancements that have allowed us to collect more fine-grained data and more sport informatics and analytics resources to be publicly available. These publicly accessible sports data have also opened up a number of multidisciplinary research activities outside the field of sports. Multidisciplinary research approaches scientific questions from the perspective of specific subdisciplines (Glazier, 2017) and also leads to interdisciplinary research within sports science (Piggott et al., 2019). Researchers across disciplines could be connected from upstream to downstream through a data-driven research chain.
Baseball databases are built for different purposes, with different benefits for the front office, coaches, and players. In the front office, free agent player trading is a major event in the Major League Baseball (MLB). Through player trading, teams obtain the talents they need and sell their excess talents. However, how can the team know how much the talent can help them win? The Win Above Replacement (WAR) was thus created for calculating each player’s value (Baumer et al., 2015; Sievert & Mills, 2016). Based on different market sizes of the franchise, the value of each win of the team is also different. When all these factors are calculated, a player’s free agent market value can be calculated objectively (Krautmann, 2019). Coaches use baseball databases most when they arrange starting lineups of the day (Sugrue & Mehrotra, 2006), when choosing pinching hitters (Chen et al., 2014), and when making game strategy (Chan & Fearing, 2018). The need for a database is because of the head-to-head records between the pitcher and the batter. Based on pitching velocity, pitch types, trajectory, and location, one pitcher might have great success against one batter while being beaten by another. With respect to the player, when standing on the pitching mound or the batting box, the player is on their own. They need to remember the conditional probability of the pitcher or the batter they are facing. The pitcher should know if the batter’s swing rate of the first pitch, and swing rate when the count is ahead and behind (Downey & McGarrity, 2019). The pitcher should also know the tendency of the batter, if they like to chase balls out of the strike zone (Morris-Binelli et al., 2018), or if they are a conservative batter who only swings at pitchers in the zone they like. On the other hand, a batter needs to remember the pitcher and the catcher’s habits. Do they throw their first pitch as a strike? What is the fastball percentage when the count is ahead and behind?
These complete baseball databases are built and maintained by the teams themselves for private research and use for team management and operations (Nicholas, 2018). However, most of the data are periodically released to the public by MLB and simultaneously collected and archived by sports fans, baseball enthusiast organizations, and news media. These publicly available baseball data have also been popularized in recent years with the proliferation of the Internet, allowing the public to search and retrieve it through MLB websites and the websites operated by other parties.
Many fan groups and related industries have been nourished and grown. The Society for American Baseball Research (SABR), with a history of half a century, is a pioneer in baseball data research. The SABR has created sabermetrics that has contributed to baseball (Nowlin et al., 2020) and continues to guide fans and promote the study of baseball (Dettman, 2017). Sports betting and fantasy sports based on baseball data represent a multi-million dollar industry that attracts a wide range of fans (Mahan et al., 2012). These publicly available baseball data can also be found on bookmakers and fantasy sports’ websites, allowing fans to study how to place bets and arrange the lineups of fantasy sports teams. Youtubers and bloggers related to baseball analysis are emerging to show their unique insights.
However, the ease of obtaining data has led to a gap between academic research and practical application. Some academics do not see the actual needs of the sports industry, and the results of their research cannot be applied in practice. Not many valuable practical reports have been published in academic journals for most decision-makers in ballpark reference (Fiander et al., 2021; Lyle & Muir, 2020). Although many baseball fans conducted studies based on baseball data and were able to explain certain phenomena in practice, these studies did not tend to appear in academic journals.
Baseball data are familiar to sports researchers, but the uses of such materials are diverse and multidisciplinary that will generate interest and create a broader participant base to make greater coverage and impact. The term “multidisciplinarity” is used to refer to contexts of two or more disciplines, even when they are not integrated, and is often measured by the “diversity” of research areas in the references cited by publications (Abramo et al., 2018). The complexity of modern social and scientific challenges requires integration of knowledge and research collaboration among experts from different disciplines. However, research that crosses disciplinary boundaries is difficult to catalyze and structure, and to finance, evaluate, and publish (Viseu, 2015). Although baseball data have been used in many studies for a long time, most existing systematic literature reviews (Bakshi et al., 2020; Koseler & Stephan, 2017; Mercier et al., 2018) focus on a single research topic within a specific field. Little attention has been paid in sports science to the convergence of multiple scientific disciplines around public data resources and their data-driven consequences, and thus, knowledge gaps exist. To the best of our knowledge, a comprehensive multidisciplinary scoping review has not yet been conducted. Therefore, the main purpose of this study is to organize the literature through a scoping review from a data-driven and multidisciplinary perspective, in order to ascertain the most frequently researched topics, characterize the usage of data, and systematize the evolution of the related research trends.
This research offers several contributions to data-driven research in the field of sports. First, we offer comprehensive multidisciplinary explorations, which break down disciplinary boundaries and visualize the interconnectedness of research themes in various fields centered on baseball data. Second, identifying the current state and progress of the literature so there is a clear understanding of the evidence in the area will provide reference in planning research strategies, and discover opportunities for cross-disciplinary research innovations based on publicly available sports data. In doing so, we extracted data from Web of Science, Science Direct, and SPORTDiscus, and using journal discipline classification as a proxy to quantify the multidisciplinary coverage of scientific output. In addition, we developed a comprehensive baseball data research domain framework. This integrated framework visualizes the baseball research ecosystem based on the big data maturity model (Comuzzi & Patel, 2016) and the lifecycle of sports game, which link the multiple streams of research infields. The emerging key themes from the research conducted using publicly available MLB data were identified by bibliometric analysis and formed into a knowledge map.
The remainder of this paper is structured as follows. Section 2 describes the methodology. Section 3 presents the obtained results. Section 4 conducts a discussion of the studies surveyed. Section 5 provides concluding remarks and future outlooks.
Methodology
Study Design
A scoping review is conducted to determine the coverage of a body of literature on a particular topic and to clearly indicate the amount of available literature as well as an overview of its highlights (Munn et al., 2018). The topic of publicly accessible baseball data is broad, so we conduct a scoping review to check for emerging evidence. This review would help to pose and valuably address more specific questions through a more precise systematic review (Armstrong et al., 2011). This research was conducted to answer the following research questions.
In which disciplines are baseball data most frequently applied in the academic literature? How diverse and multidisciplinary coverage of the applications is?
Which available resource, how much data, how many years of data, and which data fields have been collected from various types of studies?
What is the usage of baseball data? What are the emerging research trends? What about the development of the baseball data applications in the future?
This study was conducted according to Arksey and O’Malley (2005) framework, and the systematic reviews and meta-analysis (PRISMA) statement was used for reporting (Moher et al., 2009). Readers can refer to Section 2.4 to learn about how the four-step process (identification, screening, eligibility, and inclusion) of PRISMA was adopted to extract reviewed articles. The article retrieval was conducted from July 6 to August 13, 2020, and were then analyzed separately by two independent reviewers. Further, in order to identify correlations between multidisciplinary studies and to discover hotspots of research, the bibliometric approach was performed by VOSViewer (Van Eck & Waltman, 2010) to analyze the co-occurrence of author keywords.
Search Strategy
Publicly available MLB data is often used as research material by sports fans, and relevant articles often appear in the form of website blogs, newspapers, magazines, technical reports, and master’s theses. To focus on academic research and ensure the quality of the articles, three primary academic databases were selected, namely, comprehensive Web of Science, Science Direct, and sports-focused SPORTDiscus. Considering that baseball research is spread over many fields, such as medicine and computer science, we tend not to use domain-specific databases, such as PubMed, which focuses on medicine; IEEE Xplorer, which focuses on electronics and computer science; and others. Instead, we use principal multidisciplinary and sport-focused databases, which were assessed by Gusenbauer and Haddaway (2020) and were suitable for systematic reviews.
The challenge encountered in searching from academic databases is that the names of these baseball databases must appear in titles, abstracts, and keywords of the article. However, the data sources are usually detailed in the text. Although Google Scholar is capable of full-text search, the number of articles it retrieves is too large. We have not used Google Scholar in this study because setting specific criteria to filter by article type and quality is not possible, and it is inappropriate as principal search system (Gusenbauer & Haddaway, 2020).
To avoid an explosion of retrieved articles on baseball, we started with an exploratory database search by using several well-known public baseball sources as keywords, such as “MLB.com,” “PITCHf/x,” “Statcast,” “baseball-reference,” “Retrosheet,” “Lahman,” and “fangraphs.” Some popular media sites also provide baseball data, such as USA Today (usatoday.com) and ESPN (espn.com), but their site names are not used as search keywords. Because these sites mainly provide articles and baseball data are only a small part of the site. Although many other well-known baseball sites also provide open data, such as Baseball Savant (baseballsavant.mlb.com), Brooks Baseball (brooksbaseball.net), Baseball Prospectus (baseballprospectus.com), and Baseball Almanac (baseball-almanac.com), we did not include their names as the keywords in our search mainly because these terms rarely appear in the search fields of title, abstract, and keyword. If a site is missing in this way, it would be recaptured when reading the full text of the article.
Sometimes multiple baseball data sources were used in a study, duplicating the results of individual searches. To reduce duplication, these data source terms are combined with “baseball” into a string using the database retrieval syntax. Finally, the string “(‘PITCHf/x’ OR ‘Statcast’ OR (‘reference.com’ AND ‘baseball’) OR (‘Lahman’ AND ‘baseball’) OR (‘MLB.com’ AND ‘baseball’))” is used to search all fields of the three databases. The search year in this study was set from 2000 to 2020, mainly considering that some of the sites providing open data did not appear until after 2000, while the complete PITCHf/x data started from 2008. The source types were restricted to academic journals for SPORTDiscus. The filter settings of Web of Science and Science Direct exclude book chapter, proceeding paper, and editorial material.
Inclusion and Exclusion Criteria
The inclusion criteria for articles from the search results were (1) peer-reviewed papers published in a journal; (2) adopting public baseball data; (3) including analysis or demonstration with numerical baseball data; (4) could be identified which database fields are used, and the amount of data; and (5) written in English. Studies were excluded if (1) materials were proceedings paper, book chapter, or editorial material; (2) the data cannot free access on the internet; (3) the data were captured from documents.
Methodological Approach
The initial search identified 90 articles from three databases, and the eligibility assessment process was conducted as shown in Figure 1. After deleting seven duplicated articles, the remaining 83 articles were then screened for relevance based on their title and abstract. After the completion of the screening process, 16 articles were removed, leaving 67 articles selected for full-text assessment for eligibility. Of the 67 articles, 19 were removed because they did not use any dataset, the data source could not be identified, or non-public datasets were used. Finally, the remaining 48 articles were included in this review.
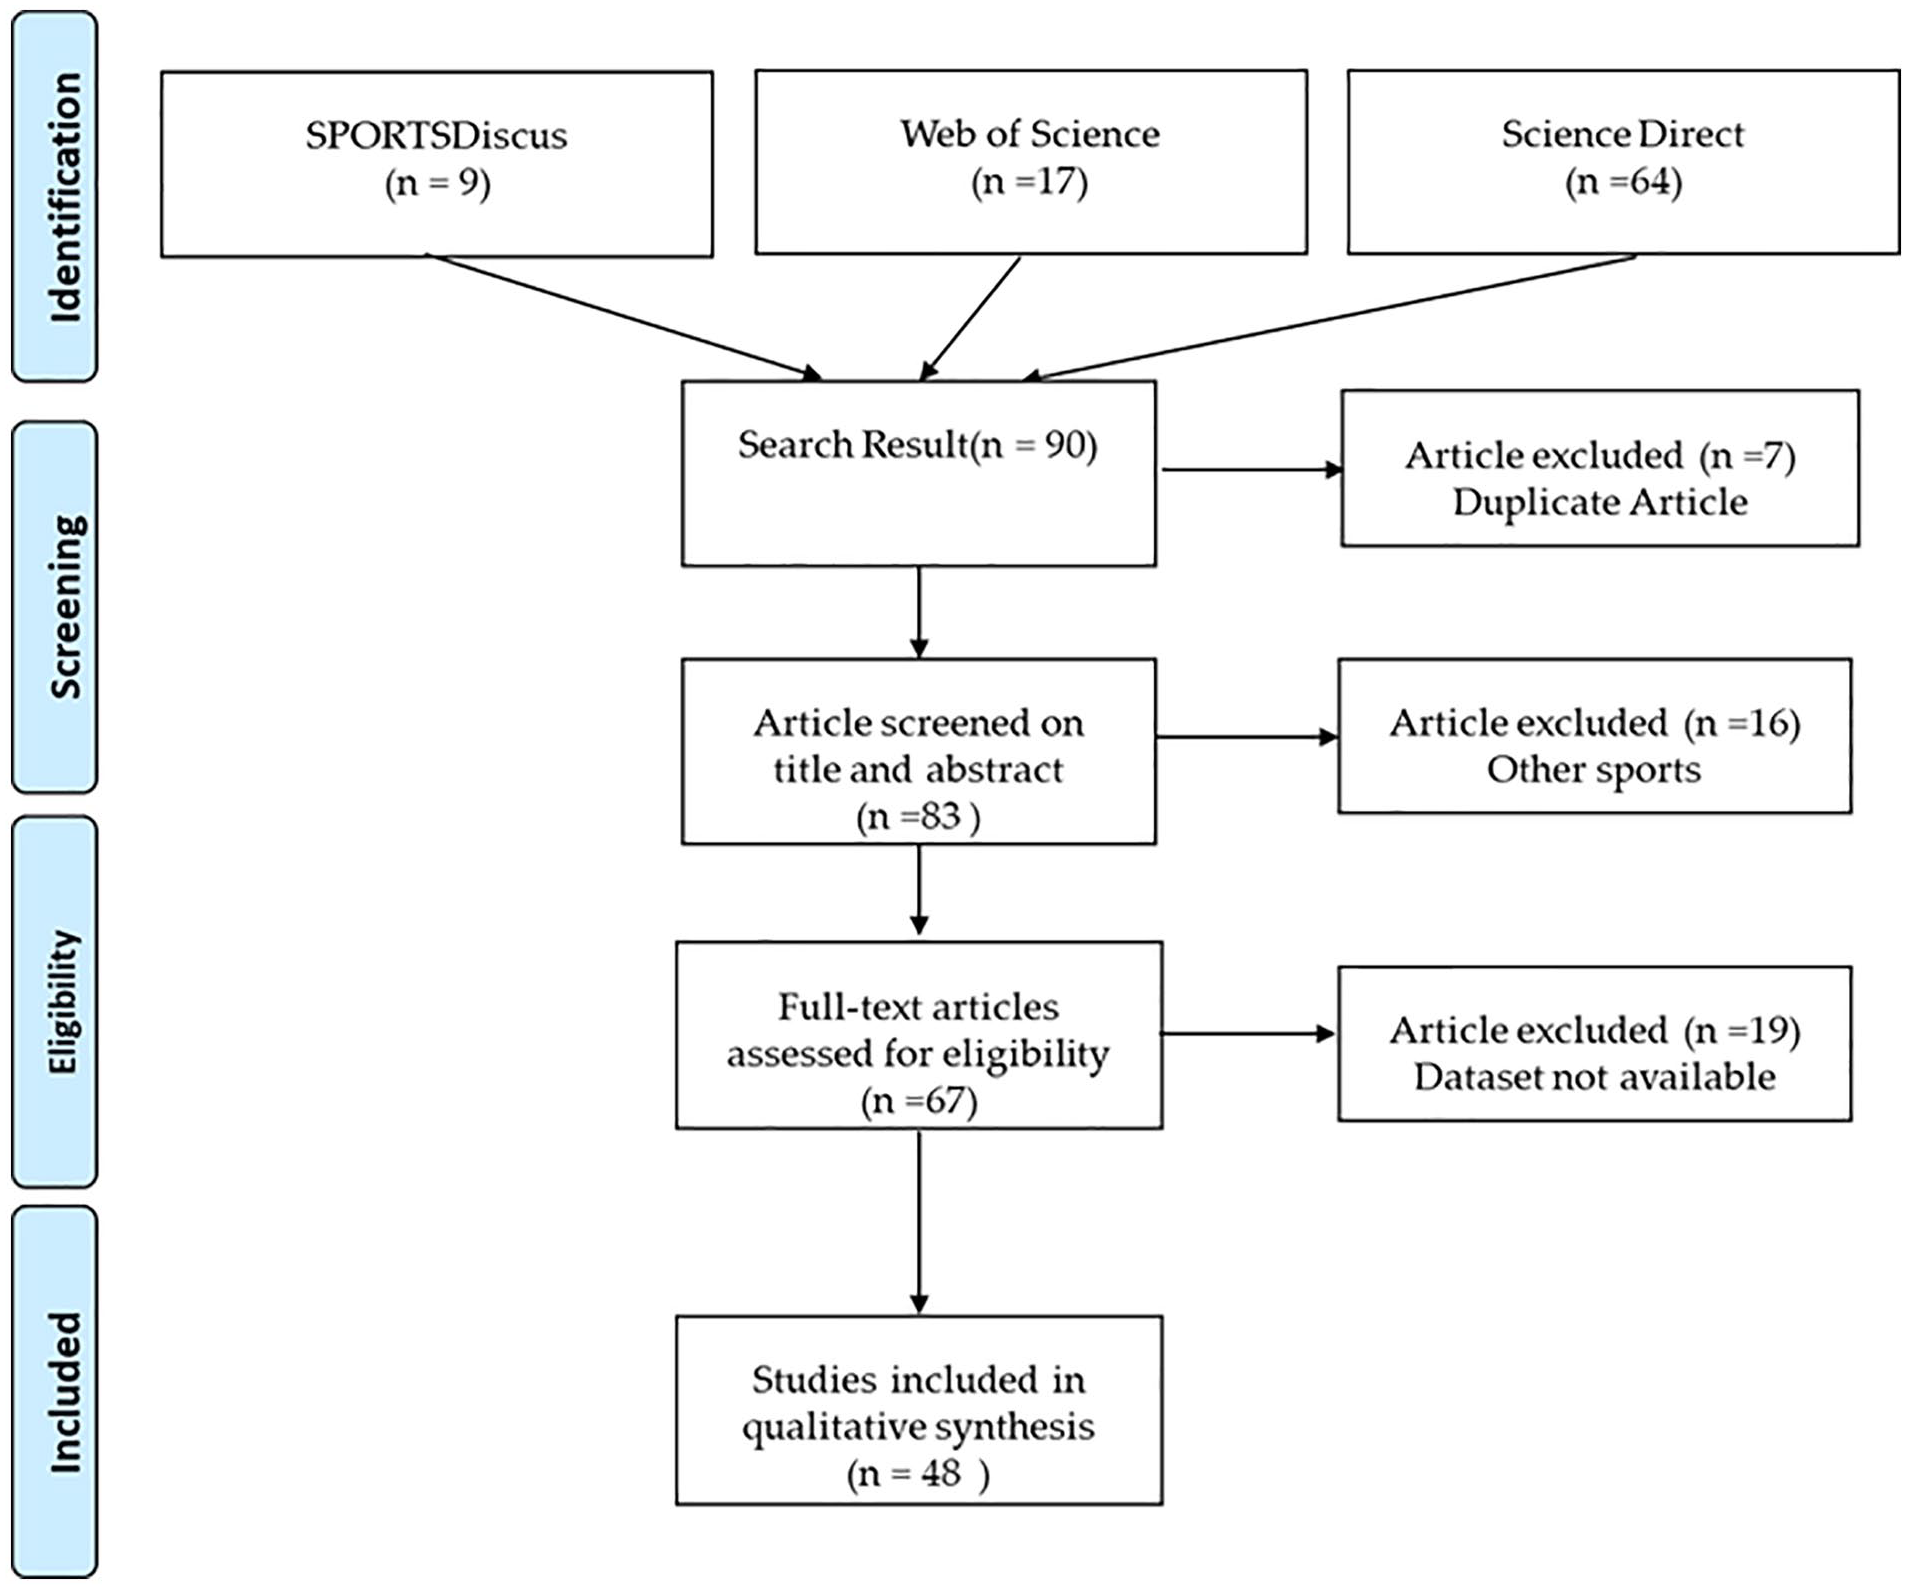
PRISMA flowchart. Flowchart for search and article screening process.
Data Extraction and Analysis
Each study was reviewed and examined, and the basic information such as the authors, title, journal name, year, research subject, issue, methodology was extracted and organized into a review sheet. We attempted to classify each study into the discipline to which it belongs. We attempted to find out the valuable information about data source, amount of data, data interval, types of data, and field of dataset used in each study. Finally, a qualitative synthesis was conducted based on this information to answer the research questions.
Results
Characteristics of the Studies
The 48 articles obtained after the eligibility assessment were analyzed according to the time distribution of publication, as shown in Figure 2. The figure also shows that most of the conducted studies were published in the most recent 5 years, demonstrating increasing research interest based on baseball data. This finding may be interpreted as a result of the recent rapid emergence of a wide variety of big data and data science analyses in many fields, which has made data and analytical tools more readily available to support the growth of relevant research. Another potential cause is the PITCHf/x data, which has only been available since 2007 and has grown exponentially with the addition of more detailed data in 2014 as measurement equipment upgraded. The accumulation of sufficient data to be used as research data may have led to the publication of studies using baseball data, in the order 2017, 2018, and 2016.

Temporal distribution of publications.
We further count the number of articles published in each journal. Next, these journals were classified by discipline with reference to Web of Science and JournalSeek (journalseek.net). For journals that could not be found in existing classifications, or for journals with multiple discipline classifications, a discipline is determined by this study. The distribution of these articles by discipline is shown in Figure 3a according to journal classification. In order to understand the diversity of data usage, we propose a taxonomy that is fine-grained by the sub discipline or specific data usage into nine categories: sports injury, performance evaluation, economics and finance, sports phycology, sports marketing, sports history, survey data, practical examples, and education and promotion. The distribution by usage is also shown in Figure 3b.

Distribution of studies by: (a) classification of journal disciplines and (b) taxonomy of data usage.
The most relevant journals were Journal of Shoulder and Elbow Surgery with six articles, and Labour Economics with five articles surveyed. In terms of the discipline of the journal, sports injury-related medicine is the most common, followed by economics. Both disciplines include empirical research that has been developed over time, such as the use of clinical data, or the use of large amounts of economic statistics and historical stock market data as research data, thereby providing the foundation and experience for processing and applying baseball data in a similar manner. This body of literature mainly contains journals with the title “sports,” such as the Journal of Quantitative Analysis in Sports and Sport Management Review with two articles each. The data usage covers sports psychology, sports history, and parts of performance evaluation. The big data in sports may have become increasingly comprehensive in recent years and has gradually attracted researchers’ engagement. Figure 3 shows that the literature using baseball databases is very broad in terms of the distribution of journal disciplines and data usage. Both have some overlap but not all are the same, indicating that sport is widely studied across disciplines. In the case of sports marketing, only one article was found in the International Journal of Research in Marketing, a management journal. By contrast, the International Journal of Sports Marketing and Sponsorship, a sports marketing journal, was not queried for articles using baseball databases, and the trend of big data marketing is not reflected. Research on psychology and the history of sports using baseball databases can only be found in sports journals, but only one of each is available.
Sports Injury
Of the 48 articles, 11 were related to sports injuries, as summarized in Table 1. The most commonly injured player position was pitchers, with six articles (55%). The most common type of injury was ulnar collateral ligament (UCL) reconstruction, with four articles (37%). The commonly used publicly available MLB data contain basic player information, performance measures, injury lists, and salary, mostly on an annual basis. The number of players surveyed ranged from 10 to 194, and the period of coverage ranged from 6 to 32 years.
Comparison of Sports Injuries Studies.

Studies of sports injuries using publicly available MLB data can be found in our collection of literature, starting in 2016 with the Tommy John surgery study conducted by Liu et al. (2016). The player information, including profiles, surgery dates, return dates, and performance metrics, were cross-referenced through MLB team Web sites and publicly available Internet-based reports (fangraphs.com, baseball-prospectus.com). Liu also mentioned that this method of data collection has already been used in the referenced literature in 2007 (Gibson et al., 2007). However, PITCHf/x was first mentioned by Liu as that the standardization of certain metrics (percentage pitches thrown in the strike zone, percentage fastballs thrown, and fastball velocity) changed after 2007 with the introduction of PITCHf/x by Sportvision. Before 2007, those metrics were collected by Baseball Info Solutions and not standardized across all stadiums. To identify the earliest adoption of PITCHf/x data in the academic literature, we used a citation pearl growing strategy with Google Scholar search and tracked down a 2014 paper by Jiang and Leland (2014) on pitching velocity before and after ulnar collateral ligament reconstruction. Given that data provides highly accurate measurements of factors such as velocity, movement, break, spin, release point, pitch location, flight trajectory, and outcome of each pitch, it can be seen in a number of studies using post-2007 pitchers.
The 11 studies selected here show that the sites that provided the data were, in order of frequency, MLB.com (MiLB.com), fangraphs.com, baseball-reference.com, brooksbaseball.net, prosportstransactions.com, baseballheatmaps.com, and usatoday.com. Most studies are based on more than one data source, most commonly MLB.com, fangraphs.com, and baseball-reference.com (Portney et al., 2017; Saltzman et al., 2018). For example, in Begly et al. (2018) and Guss et al. (2018), two of the authors are the same. They conducted separate studies on 18 players with hook of hamate fractures and on 35 positional players who underwent medial UCL reconstruction, using the same sources: MLB.com, baseball-reference.com, and prosportstransactions.com. Although prosportstransactions.com mainly provides information on player transactions, it also provides information on disabled/injured list and missed games for research reference. In the study of the economic loss following UCL reconstruction in pitchers (Meldau et al., 2020), baseballheatmaps.com was used to screen surgical lists and usatoday.com was used to obtain the total number of MLB pitchers and salary earned per year, which was used in fewer studies.
The studies about baseball players’ injuries helped coaches learn the best way to train and protect players. Thus, action was taken, pitching guidelines and pitch count upper limit suggestions are given clearly in https://www.mlb.com/pitch-smart. Owing to these studies, most tournaments have established pitch count rules to prevent coaches from abusing their players for one or two important games.
Performance Evaluation
Since Sabermetrics research began in the middle of the 20th century, various indicators based on statistics have been developed to measure the performance of a player or team (Costa et al., 2019). In recent years, these performance indicators have increasingly been used to find out the effects and correlations between relevant variables and to build more accurate prediction models.
A significant amount of precision measurement data such as PITCHf/x has been recorded and made available in all 30 major league stadiums at the start of the 2008 season (Fast, 2010). After several years of data accumulation, performance evaluation studies based on large amounts of pitch-by-pitch data analysis emerged. Unlike many sports injury studies, which analyze player performance on an annual basis, the biggest difference between the pitch-by-pitch analysis and past sports injury studies is the amount of data. In addition, when PITCHf/x is used as research data, the data are not limited to the pitcher but can also be used to study the batter’s pitch selection and the umpire’s effectiveness in judging the strike zone.
In this study, a total of 10 papers were categorized as performance evaluations (Table 2), with eight of them using PITCHf/x data and three using massive pitch data over 1 million. The study with the largest amount of data is Zimmerman et al. (2019), which uses more than 3 million called pitches from the 2008 to 2016 seasons to analysis the called strike zone (CSZ), to examine the performance of umpire. The second one is Mills (2017), which also studied the CSZ with 2.47 million pitch-level observations in the 2008 to 2014 regular seasons. The third one is Swartz et al. (2017), which takes approximately 2.2 million pitches from the 2013 to 2015 MLB seasons to estimate a model for evaluating the quality of pitches.
Comparison of Performance Evaluation Studies.

Given that the amount of ball-by-ball data is growing exponentially, some studies have been conducted to reduce the amount of data by selecting players or trimming down the data interval. For example, Vock and Vock (2018) only selected the data of two batters during the 2012 to 2014 seasons, resulting in approximately 11,000 pitches in the study. Soto-Valero et al. (2017) used the data by only choosing 20 starting pitchers that played in the 2009 season with a total of 649 games.
We also observed that a research team with the same authors, well-versed in manipulating massive baseball data like PITCHf/x, published two studies in the same year. One applied a forward stepwise multiple regression model to investigate the pitching success, which is measured by fielding independent pitching (FIP), considering the relevance to pitch selection, ball speed, ball movement, release location, variation in pitch speed, variation in ball movement, and variation in release location (Zimmerman et al., 2019). The other examined the changes in pitching-performance characteristics across nine innings of MLB games using pitch type, speed, ball movement, release location, and strike-zone data to compare with the pitcher’s FIP (Guss et al., 2018).
In contrast to studies that use massive amounts of pitch-by-pitch data, some studies use annual data at larger statistical intervals or overall team data to evaluate performance with a smaller amount of data. Hardy et al. (2017) simply used 12 variables with a reasonable amount of data to analyze and examine the pitchers’ career length. The variables assessed were average innings pitched (AIP) per year before and after age 25 years, earned run average (ERA), walks and hits divided by innings pitched (WHIP), strikeout to walk ratio (SWR), pitching position, time on the disabled list, length of career, and starting and retirement age. Elitzur (2020) used a team’s level data, such as win percentage, overall WAR, and team payroll, to compare the performance between MLB teams.
At present, a large amount of data is generated in each MLB, Japanese (Umemura et al., 2021), Korean, and Taiwanese (Huang & Hsu, 2020) professional baseball game with the usage of Trackman. With pitch location, ball movement, hitting exit velocity and launch angle, real-time monitoring and long term trends are calculated. Through the findings of these research articles, statistics and probabilities are used to help the team build their strategies and plans.
Economics and Finance
In academic development, economics and finance are inextricably linked to human behavior, and a number of phenomena are generally apparent. Economists and financiers have been vigorously pursuing general rules for these phenomena since the 18th century, proposing hypotheses, theories, and models as interpretations. They also experiment with real-world data for verification. This practice is also known as empirical economics and empirical finance. Given that the publicly available MLB data are sufficiently detailed to cover the entire baseball labor market and has long been recorded, the baseball data is akin to like a small economic and financial laboratory suitable for empirical research (Kahn, 2000).
As for the 48 studies derived from the baseball data application, a total of 13 were related to economic and financial empirical studies, which addressed various issues including salary, productivity, and organizational behavior, as shown in Table 3. Of the 13 baseball data for empirical studies, the most common research issue was salary, totaling six (Baron, 2013; Bodvarsson et al., 2014; Bradbury, 2017; Depken, 2000; Holmes, 2011; Tao et al., 2016).
Comparison of Economics and Finance Studies.

The theme of the salary and productivity studies were relevant to the sports performance evaluation studies in Section 3.3. Disparities is the study of economics and finance examines overall social phenomena such as salary dispersion and discrimination in the labor market, heterogeneity in work productivity, and the effect of peer-to-peer learning in the workplace, rather than specifically in baseball or sports domain. The baseball data were merely used as evidence.
The data used in the study of economics and finance, different from the continuously short intervals of game-by-game or pitch-by-pitch data used for performance evaluation, are longitudinal statistics over long periods, such as annual data. The longest period of data used was approximately 90 years (Papps et al., 2011). Among the earliest data used were from Bradbury (2017), who used 40 years of historical data from 1880 to 1919 to study the effect of limiting salary competition between rival leagues in the early professional baseball era a century ago. In addition, the data sampled from non-consecutive periods over 3 (Garcia et al., 2020) and 4 years (Bodvarsson et al., 2014) were also used. Although the period of data is long, the amount of data is not large, no more than a million.
Some exceptions are empirical studies on the efficiency of financial markets, which used approximately 4.96 million raw data observations (Mills & Salaga, 2018). Given that the efficiency of the market will be related to arbitrage opportunities, any irrational price will be quickly recovered by the market mechanism. Mills and Salaga (2018) proposed that the effectiveness of the umpire may affect the efficiency of the sports gambling market. They gathered information on umpire strike zones from pitch-by-pitch locational data to measure umpire behavior, and examined the efficient of markets. The study was conducted similarly to the financial markets, which generally use high-frequency intraday trading data for financial market efficiency and arbitrage, whereas the pitch-by-pitch data used for evaluating umpire also resembles high-frequency data, with the common feature that the amount of data is very large.
In addition to baseball-themed websites being used as data sources, news and media websites, as well as personal websites that are less frequently used as data sources, are also shown in economic and financial studies. For example, the Sports Illustrated magazine (si.com) and the USA Today (usatoday.com) website were used to gather the panel describing data of MLB teams (Depken, 2000). Holmes (2011) collected salary data of players from Doug Pappas’s website (roadsidephotos.sabr.org/baseball/) and the revenue data of MLB teams from annual reports by Forbes (forbes.com) for a salary discrimination study. Data used in the study of human capital developmental programs and financial performance (Bendickson & Chandler, 2019) were collected from Baseball Almanac, Forbes, and USA Today. ESPN.com publicity offers the data of free agents’ movement and player transaction information, which have been used in the study of free agent behavior (Garcia et al., 2020; Terry et al., 2018). The team payroll information can be retrieved from StevetheUmp.Com (Garcia et al., 2020), and ballparks’ websites also provide supplemental history data of MLB teams.
The use of these different sources of data on team information, salaries, and player transactions in these studies is not consistent, and each researcher has their preferences. However, statistics on player’s and team’s performance were obtained from more consistent sources, with the Lahman Baseball Database (seanlahman.com) being the most commonly adopted, used in seven of the 13 studies.
Other Sports Domain
In other sports domains, not as many studies have been conducted using publicly available MLB data. A few are found in studies of sports psychology, sports marketing, and sports history, which were listed in Table 4.
Comparison of Studies in Other Sports Domain.

In sports psychology research, the performance of athletes under pressure is an important and popular research topic. The study is generally conducted using an experimental psychology methodology, in which participants are asked to perform certain tasks in an experimental setting, and psychological scales and physiological performance parameters are measured. Otten and Barrett (2013) adopted an alternative approach to verify the proposed hypotheses that baseball hitters would be more susceptible to pressure-induced performance changes than pitchers, whose skills are less based on hand-eye coordination. A total of 109 years of historical baseball data, at both the team and individual level from 1903 to 2011, was used to verify the proposed hypothesis.
Publicly available MLB data, in addition to information such as players, teams, umpires, box scores, injured lists, player transactions, and salaries, also record the number of attendees at each game. Such data are of interest to sports marketing researchers and are used in marketing strategy studies. Kappe et al. (2018) proposed a new random coefficient mixture hidden Markov model to model the time-varying effects of marketing mix variables, and applied it to an empirical application. They used data of attendance for all 2,430 games played during the 2013 MLB regular season to examine the effectiveness of in-game promotions in increasing the short-term demand for MLB attendance.
Given that records of baseball data have been kept for more than a century, they have been used as a source of reference material in historical baseball literature. The National Pastime, published by the Society for American Baseball Research, is a peer-reviewed journal on the history of baseball that is published annually and features a review of the history of baseball, as well as an introduction to prominent figures in baseball history. In this study, The National Pastime Number 27 published in 2007 was retrieved through SPORTDiscus, indexed in academic journals, with 20 authors and containing 29 articles (Charlton et al., 2007). The content introduces several baseball players, including George Kromer, Roberto Clemente, and Albert Johnson, and many of the statistical data lists are from Retrosheet (retrosheet.org).
Survey Data
Publicly available MLB data, which accumulate data on many athletes, are often used as a sampling source for epidemiologic and individual characteristics surveys with the advantages of being recorded over a long time to include a large number of populations and being easily accessible. Table 5 lists the studies that used baseball data as survey data.
Comparison of Studies for Adopting Baseball Data in Survey.

For their epidemiological survey, Allahabadi et al. (2020) investigated ACL graft re-tear rates in National Basketball Association, MLB, and National Hockey League athletes using publicly available databases and compared these to general populations, National Football League athletes, and the pediatric population. For population-based individual characteristics surveys, the Lahman Baseball Database was adopted. Abel and Kruger (2004) examined the relationship between left-handedness and season of birth with 8,016 MLB players between 1900 and 2001. Conroy et al. (2016) examined overweight and obesity among MLB players with age, height, and weight from 17,918 observations between 1871 and 2015. Both studies used data accumulated for more than one century, which are sufficient to conduct a survey with a large population.
Practical Examples
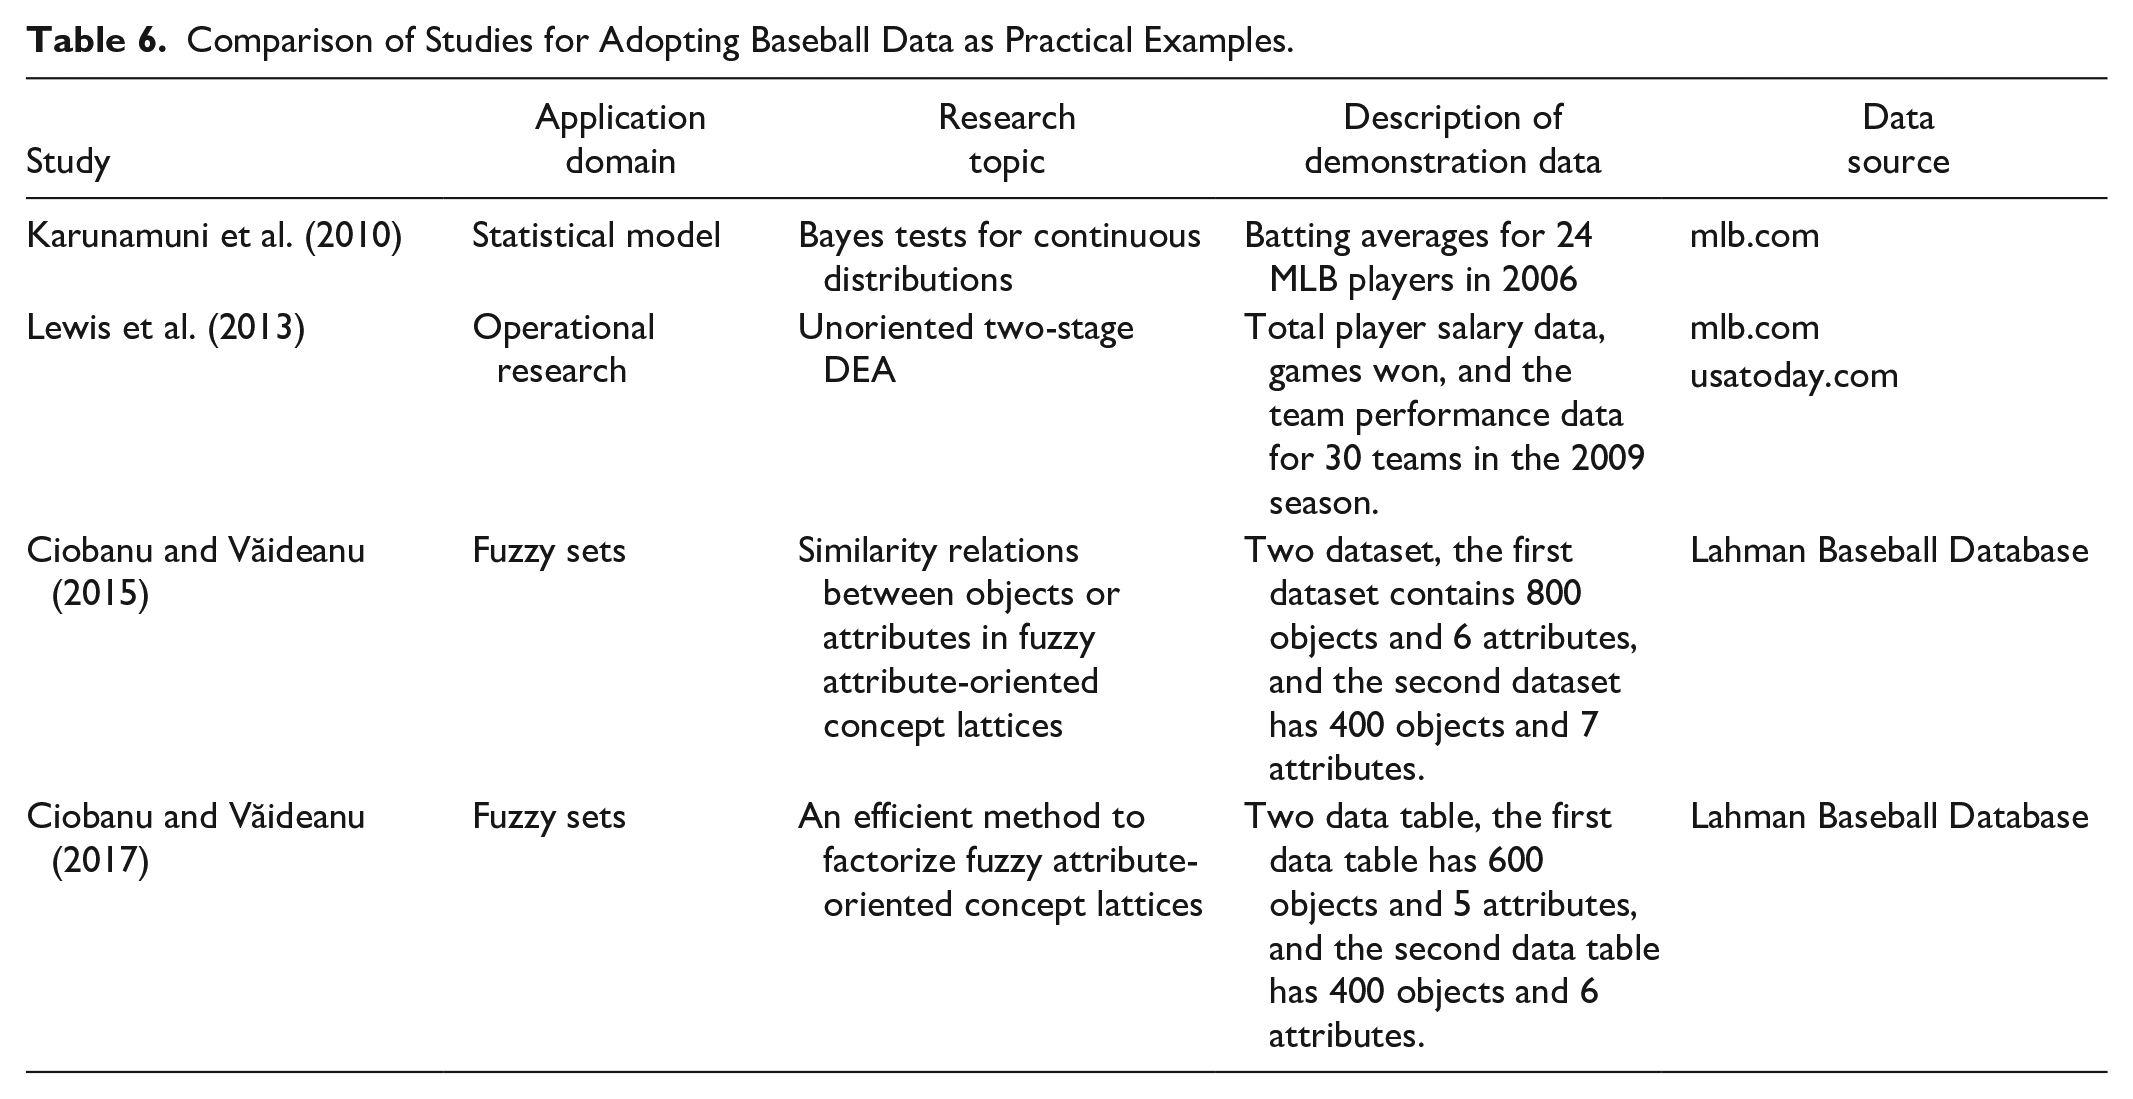
Baseball is a popular sport, and many people know basic baseball data. Given that baseball data is comprehensive, open, and easily obtained, many studies beyond the sports domain tend to use baseball data as a trial run to illustrate the proposed numerical model or algorithm, as shown in Table 6. The data of batting averages from 24 MLB players during the month of April and the full season of 2006 were adopted in the study of empirical Bayes two-action problem under a linear loss function (Karunamuni et al., 2010). The data of total player salary, games won, and team performance for 30 teams in 2009 season were used in the study of the unoriented two-stage data envelopment analysis (Lewis et al., 2013). Two data tables extracted from the Lahman Baseball Database were used in an example of the study of fuzzy attribute-oriented concept lattices (Ciobanu & Văideanu, 2015, 2017).
Comparison of Studies for Adopting Baseball Data as Practical Examples.
Education and Promotion
In this study, three research journal articles, listed in Table 7, were related to publicly available MLB data, but the data were not used as research material for advanced study. The purpose of these articles is to educate and promote the tools associated with the application of these databases and demonstrate using certain data as examples that will facilitate sustainable development of these baseball databases in the future.
Comparison of Application in Education and Promotion.

With the explosive accumulation of data on PITCHf/x in recent years, these large amounts of data have not been easy to use, and so some supplementary tools have been developed. The introductions of these tools have been published in journals and were retrieved and selected in this study.
R is a free software environment for statistical computing and graphics, which have been widely used among statisticians and researchers in various fields for data analysis. Moreover, R has features to support the acquisition, manipulation, and visualization of PITCHf/x data, such as the pitchRx package and XML2R framework developed by Sievert (2014), making it easier to obtain and store such data locally.
Since the 2017 season, the PITCHf/x system for official measurements of pitch speed was replaced by Statcast. Statcast is a spatiotemporal data-tracking system, with high-speed, high-accuracy, ad automation, developed to analyze player movements and athletic abilities in MLB, which was introduced to all 30 MLB stadiums in 2015 (Healey, 2017). Lage et al. (2016) introduced how to use the Statcast Dashboard to query, filter, and analyze the spatiotemporal tracking data.
For education purposes, the Statcast dataset and a powerful spreadsheet to calculator the baseball trajectory for education purposes, such as looking at some Statcast data and understanding the forces on a homer in flight, were introduced by physics teachers (Kagan & Nathan, 2017). For educational purposes, publicly accessible website documents and baseball data are frequently cited in lectures on sports management case studies. One example is the salary terms of a player’s contract were quoted from mymlbdraft.com in a teaching note of a case study that explores how MLB is using the Dominican Republic as a market for cheap labor, and the social issues in this situation (Bouchet et al., 2013).
Bibliometric Analysis and Discussion
Knowledge Map of the Research
For these studies spread in various disciplines, we used co- occurrence analysis in bibliometrics to identify the most frequently occurring keywords, and examine the similarity and density among studies to explore the clusters of hot research topics. The resulting network map is composed of nodes and links. A link means a co-occurrence connection between two keywords, and we use total link strength to indicate the number of publications in which two keywords occur together. The size of the nodes is determined by calculating the weight of the total link strength, presenting more frequently recurring keywords with larger nodes. The powerful Lin/log modularity normalization was chosen for determining distance based similarity while clustering the network units. The shorter the distance between the different nodes, the stronger the relationship between the keywords (Van Eck & Waltman, 2013).
Figure 4 shows the co-occurrence network of keywords. Among the 48 studies, a total of 94 keywords were identified, with only nine of them appearing more than three times. “Baseball” and “major league baseball” are naturally the most recurring keywords, which means that they are at the center of the network. The other frequently used keywords are as follows: pitches, ulnar collateral ligament, salary discrimination, pitcher, tommy john surgery, return to play, and player. In order to avoid too many scattered clusters that are not easy to observe the convergence of studies, we set the minimum size of the clusters to 10 to merge into 7 clusters. Research in various disciplines can be converged by three main clusters according to similarity. The red cluster corresponds largely to the publication on pitcher’s injury and return to play. This cluster also covers a small number of social science topics linked through the most recurring keyword “major league baseball.” The green cluster tends to focus on social issues such as salary discrimination and monopsony, and often uses regression and algorithm. The blue cluster appears to be related to decision making and Bayesian models, and focus on catcher, umpire, and free agent.

Co-occurrence network of keywords.
To get a sharper view of future research trends, we used density visualization to delineate important regions in the map, as shown in Figure 5. In Figure 5, the red area reflects high density terms, while the blue area reflects low density. The results show that ulnar collateral ligaments and pitches turn out to be more conspicuous, which are major emerging areas of research using publicly available baseball data.

Density visualization of co-occurrence network of keywords.
Using a visualized knowledge map, we can see that the red, green, and blue clusters in Figure 4 are more intensively linked to one another, showing a circular ring that represents the focus of the current study. However, no direct linkage is found between the clusters at the edge of the ring. In particular, financial performance and human capital resources, which are located on the left side of the ring, are not linked to other clusters. These less relevant research topics that yield surprising and novel results may have a potential for future cross-disciplinary collaborations.
Framework of Baseball Data Usage
After an in-depth analysis of the selected studies, a framework covering the range of publicly available baseball data applying in academic research was proposed to organize these studies in the best possible manner. We map these studies to the four application domains in the big data maturity model. In addition, we propose the comprehensive baseball data research domain framework to visualize the ecosystem of publicly available sports data applications, as shown in Figure 6. This framework provides further insight into the amount of data used, the ease of data processing, and others, to examine the maturity of baseball data across disciplines in future studies. The studies were first categorized according to the discipline or specific data usage. Nine categories, sports injury, performance evaluation, economics and finance, sports phycology, sports marketing, sports history, survey data, practical examples, and education and promotion, were proposed as the first level of classification. Next, the second level of classification is based on the subject, topic, or purpose of the study content. As we observed from these studies, baseball data are not only about measurements, scores, and records but also about the profiles of the players that comprise each team over the years, and its usage extends beyond sports research.

The comprehensive baseball data research domain framework of data usage in baseball research ecosystem.
These studies are distributed throughout the lifecycle of professional baseball game operations, generating varying fineness data along with the workflow in each phase, and playing different roles in the study. From the beginning, before the start of each season, strategic alignment in the league and the team has led to research topic such as draft, free agent, salary, and discrimination. Following into the season, on-court records were generated and research topic such as performance, efficiency, and injuries were derived. Finally, after the games, the archived longitudinal data can be used in empirical studies to examine social and behavioral sciences, applied in case studies, as well as to yield educational and promotional impact.
Among the four big data maturity model domains, that is, strategy alignment, organization, data, and information technology, the data domain is the most mature domain for the use of baseball data. The reason is that this domain mostly focuses on the various performances in the field. This result is in line with the purpose of establishing publicly available baseball data, which was initially intended to record the game. For the information technology domain, the maturity of big data is lower probably because the data generated by the popular applications, such as wearable devices and the Internet of Things in the sports domain, are not publicly available and are less relevant to baseball. Borrowing from the maturity models of big data applications in other industries, we have some insights into the development of the sports industry. In the strategy alignment domain, applications of process management are not found, despite the significant impact of big data on business process innovation and marketing strategic planning. There are potential opportunities for applying baseball data in process management. Referring to the financial markets in the strategic alignment domain, baseball data can also be used to create value in the sports gaming and entertainment markets. In the information technology domain, baseball data may have the potential to be used in the curriculum to achieve educational innovation.
Conclusion
On the basis of a scoping review on publicly available MLB data, we can conclude that baseball data serves a variety of functions in different areas of research. The applications in the sports field include injuries, performance evaluation, economics and finance, psychology, marketing, history, and population-based surveys as the research data. These applications are extended to other fields as practical examples or for educational and promotional purposes. This situation indicates the importance of the essential existence of baseball data with long-term archived, comprehensive, and complete data, and open access in academic research. These baseball data accumulated over the years along with history have proven to be valuable (Phillips, 2019; Schwarz, 2004) and have attracted even those who did not enjoy baseball to use the history of baseball data as a way to understand some key themes in the history of data science (Baumer & Zimbalist, 2014; Cramer, 2019).
A large number of studies have focused on their analysis on pitchers, whether on sports injuries, performance evaluations, or salary. Notably, the methods used in these studies are generally based on statistical approaches. More recently, novel approaches to big data analysis have emerged (Horvat & Job, 2020; Morgulev et al., 2018; Patel et al., 2020), but no one has adopted them.
The most popular data source of information is PITCHf/x, the Lahman Baseball Database, and baseball-reference.com. PITCHf/x, and the subsequent Statcast and Trackman, provide a considerable amount of pitch-by-pitch information not only relating to the pitcher but also the effectiveness of the umpire, the selecting ability of the batter, and the influence of the catcher. By contrast, the Lahman Baseball Database and baseball-reference.com provide more than a century of data including individual and team levels of performance and salary to meet the needs of long-term data research. However, the same data can be retrieved from different sources, and no definitive conclusion exists as to the type of data that should be selected from which data source. Despite each website having its own specialized data, scraping together the data from different sources and rarely only using a single source to assemble all the data. We suggest considering multiple sources of information and use cross-validation and, if possible, obtained from the official MLB website to ensure credibility and accuracy.
Through the co-occurrence analysis in bibliometrics, we have identified several hotspots of research and found a gap between academic themes and practical applications in the baseball field. Research with publicly accessible baseball data continues to be centered on pitchers and their injuries, because pitcher’s performance is a key factor for winning or losing baseball games (Soto-Valero et al., 2017), and sports injuries are currently one of the most flourishing aspects of sports science. The sabermetric research conducted by the front office and the fan community is relatively less academically available. The reason may be that these studies, although closer to practice, are internal studies that are not published or are not conducted in an academically rigorous manner. The other more active academic research focuses on the social sciences, using baseball data for empirical evidence. Although these results can explain social phenomena and behavioral patterns, they are of less practical reference value to players and coaches in the game.
In this study, we integrate the existing academic baseball data application scope into a single coherent research ecosystem to propose the comprehensive baseball data research domain framework. This framework answers the call for multidisciplinary research on publicly available sports data to abstract from a single discipline and focuses on the sports industry impact of big data initiatives. Enterprises in sports can align this framework with the maturity of big data applications in other industries to find their niche and identify opportunities for development and growth from the gaps.
The main limitations of this review are related to the difficulties in the retrieval of relevant studies. Data sources are mostly mentioned in the text of the article and are rarely included in the title, abstract, and keywords. Thus, many eligible studies may be missing and cannot be retrieved by searching all fields in the database. In addition, the search keywords are made up of the names of baseball databases (or website), but only well-known or frequently visited websites are listed as far as possible, not all baseball databases. Social trend keywords indirectly related to baseball data were excluded from the scope of this study. Examples include the popularity of fantasy sports, changes in legal restrictions and the growth of the sports gambling industry, and innovative applications of motion sensors and the Internet of Things. Another limitation is that categories in previous literature are not standardized. A study was classified into only one category of discipline, resulting in difficulties in categorizing studies that were interdisciplinary and prone to conflict.
Future research suggests that the knowledge map of research hotspots presented in this study can be used as a reference in bibliometric research to identify the migration of research focus across different decades in a longitudinal analysis. Researchers could be guided by the results of this scoping review to select more specific topics for systematic literature review in the future. For big data applications in the sports industry, the gaps revealed by the comprehensive baseball data research domain framework in this study could be referred to facilitate the innovation and change in process management. Furthermore, the findings could be used to provide insights toward value-added sports data to the gambling, entertainment, and education industries.
Baseball data have evolved over the years, together with the development of data science. With the advent of the big data era, diversity of baseball open data has broadened and distribution channels have widened, making baseball data more easily accessible. Thus, the acquisition of baseball data is no longer exclusive to sports sites but is available everywhere on the Internet, such as kaggle.com, data.world, and Google Dataset Search, which specialize in providing data. Although these public baseball data have evolved with the era from paper-based records, standalone databases, and web-based databases. The challenge in the future of academic research would be how to rapidly respond to the era of big data and adopt emerging data science analysis techniques for sustainable development.
Footnotes
Author Contributions
All authors conceived the paper research questions and aim and contributed substantially and equally to it. Y.-C. Hsu concentrated more on the methodology, data collection, literature review, results, and discussion. J.-H. Huang concentrated more on writing the introduction of the paper and interpreting the results. All authors have read and agreed to the published version of the manuscript.
Declaration of Conflicting Interests
The author(s) declared no potential conflicts of interest with respect to the research, authorship, and/or publication of this article.
Funding
The author(s) disclosed receipt of the following financial support for the research, authorship, and/or publication of this article: This research was funded by Ministry of Science and Technology, Taiwan, R.O.C., grant number 108-2627-H-028-002.