
Abstract
There is growing global concern about the unpredictable nature of climate change and rapid ecological degradation, which has emanated from quest to enhance economic growth in many parts of the world. In spite of the potential offered by green energy, developing economies such as Nigeria are lagging behind in the application of renewable energy. The synergic impact of climate change, ecological degradation and some key macroeconomic variables remains partially unexplored. Considering this gap in the literature, the objective of the study is to examine the impact of climatic change, ecological degradation, population growth and energy consumption on economic growth in Nigeria. The dynamic impacts of these key variables were analyzed using the Autoregressive Distributed Lag model. While the bounds test results indicated that the variables are co-integrated, bidirectional causal flows were identified between economic growth, energy consumption, population growth, and climatic change. However, unidirectional relations exist running from ecological degradation to economic growth, as well as from population to economic growth. The study further found that climate change and ecological degradation are mutually reinforcing one another as a bidirectional causal relation was detected among the two variables. In this sense, it can be concluded that population growth, energy consumption, and ecological degradation are key contributors to sustainable growth that will reduce the threat of climate change. As such, there is a strong need for Nigeria to strengthen its environmental regulatory institutions to initiate a paradigm shift from conventional to renewable energy. This will reduce ecological degradation and enhance environmentally-friendly economic growth.
Introduction
The research community has shown significant interest in studying the impact of climate change, energy consumption, and ecological degradation on economic growth. Climate change is a global phenomenon that does not allow economies to function in an environment free from challenges (Udemba et al., 2021). Unfortunately, changes in the climate are solely induced by human actions which subsequently lead to ecological degradation resulting from global warming (McCright & Dunlap, 2000). The ecological and environmental changes have become pressing issues around the world for both the public and the research community under the global climate change scenario (Siegert et al., 2001), which is attracting an increasing level of attention as a new integrated topic all over the world (Hoffmann & Sgrò, 2011; Vaughan & Lenton, 2011). Ecological footprints, which comprise carbon emissions, fishing grounds, built-up land, forestry products, cropland, and grazing land (Global footprints Network, 2021) are consequences of economic activities that are part of emissions. Nigeria is one of the developing economies that is expected to experience an increase in CO2 emissions through its economic activities and with a population of above 211 million (Global Footprints Network, 2021), is likely to be adversely impacted by climate change due to its vulnerability and low coping capability (Ebele & Emodi, 2016).
According to the Global Footprints Network, Nigeria is one of the countries that has an ecological deficit (Fadeyibi et al., 2021; Global Footprints Network, 2021), as a result of the habits of dumping waste, haphazard industrial planning, urbanization, poverty, and incompetent municipal governance (Wikipedia, 2018). This implies that the natural resources demands by the country’s population are greater than those available (supply), which has resulted in high emission and depletion of CO2 into the atmosphere. Nigeria is highly dependent on its petroleum and agricultural sectors, which means that it excessively consumes non-renewable sources of energy for growth to proceed. One of the indicators that has been found to trigger the harmful consequences of emission is economic growth, whereby various economic activities that are adopted toward and revolve around economic growth contribute to polluting emissions (Abid, 2015). As indicated by many scholars, sustainable economic growth or development as a major objective of every economy of the world can only be achieved when a country is able to enhance its energy accessibility (Ali et al., 2020) by reducing CO2 emissions and promoting sound ecological sustainability. In addition, the country is confronted by environmental challenges that are essentially related to massive land clearing and bulk deforestation (Odihi, 2003; Sudhakar Reddy et al., 2015), oil spillages (Madu et al., 2018; Osuji & Onojake, 2006), excessive application of agrochemical and inorganic fertilizers, poor and unorganized livestock rearing, and illegal and inappropriate mining (Ibrahim et al., 2020). Furthermore, the country has rivers, lakes, and wetlands covering a territory of 13 million hectors, which have been persistently degraded via waste disposal at a rate of 63 million tons per annum, predominantly in urban areas (National Policy on the Environment, 2014).
All of this, along with the significant reliance of 80% of households on traditional energy in Nigeria, contribute immensely in climate change degradation. This is connected with emissions produced through the tourism, transportation and manufacturing sectors, which in totality affect the country’s economic growth and GDP per capita (Ebele & Emodi, 2016). According to a National Environment, Economic and Development study (NEEDS, 2010), the country will lose between 6% to 30% or $100 billion and $460 billion due to the impacts of climate change. This indicates the importance of examining the growth-associated emissions of the country
Although the energy-environment question for Nigeria has been investigated by a number of scholars (Ali et al., 2019; Chindo et al., 2015; Nathaniel, 2020), the impact of some of these key variables on economic growth remains partially unexplored. To address this gap in the literature, this study aims to examine the dynamic relationship between climate change, energy consumption and economic growth and ecological degradation with a different approach by adopting a multivariate structure. This research will therefore allow the researchers to address the failures of previous studies in addressing omitted-variable bias. To resolve this problem, we incorporate carbon emissions and temperature change to explain climate change, and ecological footprints to explain ecological degradation and population growth rate. This will enable the mutual relationship between climate change, energy consumption and ecological degradation and the economic growth of Nigeria to be explained. The paper also promotes and strengthens the quest to solve Nigeria’s ecological challenges. With regard to the methodology used, the ARDL bounds and causality tests were employed and the recently developed Bayer and Hanck test was run as a robustness exercise.
The remainder of this study is organized as follows. Section 2 presents a review of the literature. Section 3 gives a detailed description of the methodology. The results of the empirical investigation are explained in Section 4 and the last section (Section 5) concludes the study.
Empirical Review of Related Literature
Introduction
This section provides a theoretical, conceptual and empirical review of the literature as well the research gap.
Theoretical and Conceptual Review
The theoretical underpinning for the growth-environmental degradation nexus lends itself to the classic Environmental Kuznets Curve (EKC) hypothesis of Kuznets (1955). It is hypothesized in the EKC that there is a non-linear relationship between economic growth and environmental degradation. The intensive and extensive use of natural resources, particularly at the early stage of economic development, results in environmental pressure, which will eventually decrease (inverted U-shaped) as the economy reaches an advanced stage of development that permits the use of environmentally-friendly production technologies (Maneejuk et al., 2020). Due to some weaknesses of the traditional EKC caused by its failure to predict observable social factors (e.g., population growth), scholars have increasingly employed the Stochastic Impacts by Regression on Population, Affluence and Technology framework (STIRPAT) as their analytical framework (Ibrahim et al., 2017; York et al., 2003). Interestingly, the dynamics of STIRPAT can facilitate the estimation of the impact of climatic change, ecological degradation, population growth, and energy consumption on economic growth as ecological degradation is treated as an endogenous variable and the impact of population on the environment is considered as unitary elastic.
The basic attribute of STIRPAT was asymptotically planned to examine the influence of social and economic changes on the environment. Later, well understood that environmental problems are primarily caused by human activities. In this way, the Intergovernmental Panel on Climate Change (IPCC, 2007) defined climate change as changes in the variability of its components that has continued for a longer period, commonly decades.
Empirical Literature
Recent studies have attempted to connect the relationship between growth and energy (see Dogan, 2016; Ozcan & Ozturk, 2019; Saboori et al., 2017; Willie, 2014; Zafar et al., 2019). Saboori et al. (2017) combined three oil importing economies (South Korea, China, and Japan) and examined the causal relationship among emissions, growth and oil consumption by testing empirical data for the period from 1980 to 2013; their findings indicated a feedback relationship between oil consumption and growth. Similarly, they proved that energy caused growth for both Japan and China. These findings agreed with the results of Zafar et al. (2019), in their study on 16 countries in the Asia Pacific region and the findings of Marques et al. (2017), showing a bidirectional relation between energy and growth in both the short and long run. Similarly, Ajmi and Inglesi-Lotz (2020) studied 26 OECD countries for the period 1980 to 2013, and Ghazouani et al. (2020) for Indonesia, Malaysia, and Thailand and they all found bidirectional relations however, unidirectional relation only for Japan and Australia, and neutral relation for South Korea were detected. Arminen and Menegaki (2019) identified a bidirectional causality relation among the variables, while Amri (2017), Nasreen et al. (2018), Tiba and Frikha (2018), and Baloch et al. (2021) found similar results showing a bidirectional relationship between growth and energy.
In terms of neutrality relations, Musah et al. (2020) used panel data for the timespan from 1990 to 2018 to examine the relationship between CO2 emissions, renewable energy consumption, and economic growth with the cross-sectional dependence and heterogeneity test for the West African Nations (WA), and the findings showed that CO2 emissions and renewable energy had no influence on economic growth. Also, Dogan (2016) examined Turkey’s energy and growth relations using ARDL, Johansen, VECM, and Granger causality by analyzing data from 1988 to 2012. The findings showed that energy has no influence on economic growth, which corroborates the results of Ozcan and Ozturk (2019), who studied 17 emerging economies using the bootstrap panel causality test.
Hanif (2018) examined the influence of GDP (economic growth), urbanization, energy consumption, and non-renewable and renewable energy on ecological degradation in SSA using SGMM (system generalized method of moments) for the period from 1995 to 2015. The findings showed that the consumption of solid and fossil fuels as well as urbanization contributed significantly to the growth of CO2 emissions and reported the existence of the EKC in the lower and middle-income regions. Chindo et al. (2015) examined the correlations amongst the consumption of energy, carbon emissions, and economic growth in Nigeria. They applied ARDL to establish co-integration from 1970 to 2010, and the results showed the existence of a positive and significant correlation to economic growth and a negative relationship between energy used (consumption) and economic growth. The researchers further recommended that Nigeria explore and consider renewable energy as a means of reducing emissions and an alternative energy source. Riti and Shu (2016) employed time series data for variables including carbon emissions (CO2), fossil fuels, economic growth, renewable energy and population from 1981 to 2013 to determine how energy efficiency from renewable energy can replace traditional fossil fuel energy consumption. The researchers employed ARDL and VECM to determine co-integration and Granger causality, respectively. The findings showed that renewable energy consumption is influential in determining environmental quality, which corroborates with the findings of Adedoyin et al. (2021) as well as Pata (2018) in Turkey and Bilgili et al. (2016) in 17 OECD countries. Contrary to the above findings, Rahman (2020) identified unidirectional flows from growth to energy. Similar findings were reported by Odhiambo (2011) and Shahbaz et al. (2013) in South Africa, Park and Hong (2013) in South Korea and Dinda (2009) in non-OECD and OECD countries.
According to recent studies, economic growth increases CO2 emissions Adebayo et al. (2021) in South Africa, Kirikkaleli (2020) in China, and Kalmaz and Kirikkaleli (2019) in Turkey. Other studies have reported opposite findings, including (Udemba et al., 2021) who found that fossil fuel leads growth in India, and Rahman (2020) who studied 10 economies that are the highest consumers of energy and found a bidirectional relationship between the variables. Shoaib et al. (2020) used panel data for developed and developing economies to examine the causal relation between carbon emissions and growth. The findings showed unidirectional and bidirectional relationships for developing and developed economies for the timespan between 1999 and 2013. Lahiani (2018) using quarterly data for the period 1960 to 2014, investigated the association between CO2 emissions and growth. The results showed a unidirectional causal relationship from growth to CO2 in both the short and long run. Mardani et al. (2019) examined the connection between growth and climate (emissions of CO2) using the PRISMA analysis approach that covered 175 articles by 55 authors published between 1995 and 2017. Their findings showed that, as a result of the unidirectional relationship that prevails between CO2 and growth, policy makers should make an attempt to reduce emissions by changing their economic growth strategies. Boamah et al. (2017) identified a long-run connection between economic growth and CO2. Bildirici and Ersin (2018) used long-range American data to examine the correlation between growth and CO2 emissions in both the long and short run using the STARDL model and established an asymmetric relationship in the series in both periods. Marques et al. (2018) conducted an empirical analysis to establish whether a correlation exists between economic development and carbon emissions for the period from 1965 to 2016 using EKC and DI. They discovered a causal relation from growth to CO2 emissions.
Acheampong (2018) studied the nexus between economic growth, CO2 emissions and energy consumption for more than 115 global economies, where the MVAR (multivariate autoregressive model), and System-GMM (system generalized method of moments) were employed for the study. The findings revealed that economic growth had no causal impact on carbon emissions in all the regions studied except the Caribbean-Latin America and Global, which showed a negative influence from economic growth to carbon emissions. However, in SSA (including Nigeria), it was found that carbon emissions positively cause economic growth. Some similar findings show that emissions are only caused by oil in South Korea and growth has a direct impact on oil in South Korea and China, but an inverse impact in Japan (Saboori et al., 2017).
Mohsin et al. (2019) investigated another economic subdivision (transport), which is estimated to account for 23% of CO2 and consumes 25% of energy globally, and examined the associated consequences on the growth of the economy, energy, increases in population, and carbon emissions (emission on transportation) using econometric methods. The results showed that there is a direct relationship between energy and CO2 as well as economic growth and the consumption of energy. Alagidede et al. (2016) used panel data for developing economies to determine the influence of changes in the climate on economic progress, specifically in Africa (Sub-Sahara), and concluded that per capita income (GDP) and temperature have a fundamentally nonlinear relationship. Additionally, Chindo et al. (2015) focused on energy-climate volatility, which has a direct impact on the reduction in rainfall. According to their findings, a higher negative relationship with economic progress leads to a reduction in household earnings (specifically on farmers’ output as well as the growth of the economy). In a similar manner, Lanzafame (2014) used data for more than 35 economies for the period between 1962 and 2000 and examined the influence of rainfall and weather on economic growth using the ARDL approach. He identified a short and long-run connection linking climate and growth and similarly recognized the marginal impact of rainfall on growth. Awais et al.’s (2018) findings indicated that drastic changes in the climate have affected the output of resources in Pakistan, particularly agricultural land, through degradation changes, sublimation growth, carbon dioxide emission increases and excess irrigation of plants. Similarly, they found that the increased frequency of climate activities such as flooding, heat waves, droughts, tropical storms and other events are increasingly having an effect on the output of crops
Dell et al. (2012) studied the influence of temperature (climate) on the economic output of selected countries between 1950 and 2003. The results showed the excessive inverse impact of temperature on growth. Equally, Burke et al. (2015) showed that temperature has an indirect influence on output. Sequeira et al. (2018) evaluated the global influence of climate and growth using mathematical evaluations and found that an increase in temperature does not affect individual nations’ output per population globally; however, the findings revealed the influence of high rainfall and excessive temperatures in poor economies. Other studies have examined the nexus between climate change, energy, and growth (for instance, see Ayuba et al., 2007; Gungah et al., 2019; Riti & Shu, 2016). While these studies reported interesting results, there is no consensus regarding the direction of the causality. The differences in the reported findings can be explained by variations in the selection of sample size, methodologies used and sample area. For example, Debone et al. (2021) conducted a systematic review and found that in high income economies, there is a one-way causal relationship in the short-run only, whereas upper-medium income economies have a bidirectional flow in the long run and one-way flows in the short-run, lower-middle-income countries have feedback flows in both the long and short runs and lower-income economies have a unidirectional relationship (in the short-run) and a bidirectional relationship (in the long run).
Ecological degradation is seen as a complicated issue for developed (industrialized) and developing (less industrialized) economies around the world (Khan et al., 2019). In different studies, carbon emissions, deforestation, and urban population have been used as proxies of environmental degradation. For instance, carbon emissions were used by Kahuthu (2006), Khan et al. (2019), Mohsin et al. (2019), Gulistan et al. (2020), Majeed and Ozturk (2020), Moutinho et al. (2020), and Munir and Riaz (2020), deforestation was used by Kahuthu (2006), and ecological footprint by Bello et al. (2018) and Hassan, Xia, et al. (2019). Considering the fact that social and economic structures as well as environmental degradation must undergo dramatic changes, such as population shift from rural to urban areas and changes in economic patterns from agriculture to industrial sectors (Kahuthu, 2006), this has led to the conversion of more land to business activities leading to deforestation, which has an environmental impact and leads to climate change. The major factor leading environmental degradation in Nigeria is CO2 emissions caused by human activities (Ali et al., 2019). As the urban population and consumption of energy are the major drivers of CO2 emissions (Nathaniel, 2020; Nathaniel et al., 2021), emissions therefore lead to degradation of the environment. In similar research, Murshed, Alam, et al. (2021), Murshed, Ali, et al., (2021), Nathaniel, Anyanwu, et al. (2020), and Nathaniel, Nwodo, et al. (2020) found that human influence is the driver of ecological degradation. Riti and Shu (2016) found that economic growth has a long-run impact on ecological degradation, which invalidates the EKC in Nigeria. Udemba (2020) studied economic growth and the ecological footprint in Nigeria, and the result showed that a one-way causality exists from GDP (Economic growth), energy use and population growth to ecological footprint. Also, similar flows exist from economic growth to energy use and from population growth to economic growth.
Ali et al. (2019) examined the impact of financial development, energy consumption, economic growth and trade openness on environmental degradation in Nigeria. The data covered the period from 1971 to 2010 and the results of the ARDL bounds test indicated that there were long-run relations among the variables. Other studies that have examined the climate change, economic growth, and energy consumptions nexus have indicated that these factors significantly influence ecological degradation.
In view of the above studies, this paper contributes to the previous and current studies in different ways: (i) to the best of the author’s understanding, this research on Nigeria is the first of its kind to use energy consumption (combination of renewable and non-renewable sources), climate change and ecological degradation to examine their impacts on economic growth; (ii) The study also uses population growth as an additional variable to explain the influence of human activities on climate and growth; (iii) Combined CO2 emission and temperature as proxies for climate change; (iv) No study in the literature has combined the variables in question in the context of Nigeria in order to comprehensively identify the link between the variables and ecological degradation.
Methodology and Data
This part explains the econometric processes applied, the data used and the procedures for estimation.
Variables Compositions
Following Lian et al. (2020), the data used for this study include climate change (proxied by carbon emissions, which is measured as cumulative greenhouse emissions in kt of CO2 equivalent and temperature change (meteorological year)), GDP (% change annually), energy consumption (Kg of oil equivalent per capita), population growth rate (% increase in the total population), which are all sourced from the World Development Index (WDI), except temperature change, which is obtained from the Food and Agricultural Organization (FAO), and ecological degradation (proxied by Ecological Footprint (EF) (Bello et al., 2018; Hassan, Baloch, et al., 2019; Hassan, Xia, et al., 2019), which is measured as per capita change in built-up land, carbon, cropland, fishing ground and grazing land, and is also sourced from the FAO for the period from 1971 to 2014. EF is used as a proxy of ecological degradation, GDP growth rate (G) is considered as the dependent variable, while Carbon Emissions in CO2 kt (CO2), Energy Used (E), Temperature Changes (TC), and Population Growth Rate (PGR) are used as the independent variables. These series of variables constitute the multivariate framework for the study.
Considering the literature reviewed in the preceding section that established the empirical and theoretical relationship among the variables, the following mathematical equations are specified:

and for the econometric estimation, the model is transformed as:
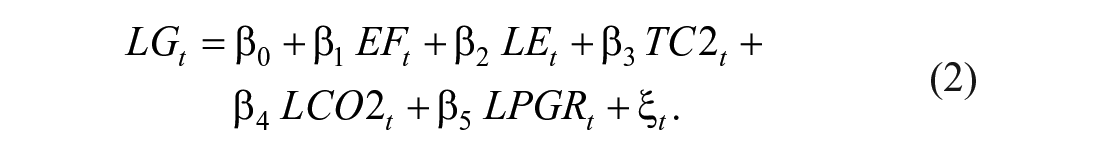
Thus,
Procedure for Estimation
The empirical studies of the following were used in the study: (i) The Dickey and Fuller (D-F, 1979) Augmented Dickey and Fuller (A-D-F, 1981), Phillips-Perron (P-P, 1988) and Ng Perron tests were applied to test the stationarity of the variables and Zivot and Andrews unit root test with structural break was applied to establish the break points; (ii) To establish the equilibrium correlation and short and long run relations among the variables, the ARDL (Autoregressive Distributed Lags), Bayer-Hanck combined co-integration test (Etokakpan et al., 2020; Pesaran et al., 2001) and Vector Error Corrections Model (VECM) were employed to examine the robustness in the relationship in the long run; (iii) To identify the directions of the relationships, the VAR-Granger causality test was conducted for the concerned variables.
Autoregressive Distributed Lag (ARDL) Model of Cointegration
Following Pesaran et al. (2001), the Autoregressive Distributed Lag (ARDL) approach for co-integration was employed by the researchers considering the numerous advantages associated with the model compared to other methods. For example, ARDL is the only model that can accommodate series with different orders of integration, such as I(0), I(1) or combinations of the two, but it does not allow a series with an integration order of I(2). It also has an advantage over Engle and Granger (1987) due to its unbiased outcome in small sample sizes (Pesaran et al., 1999). Laurenceson and Chai (2003) stated that the ARDL method can be used to obtain and ECM (Error Correction Model) and equilibrium of long and short run dynamics.
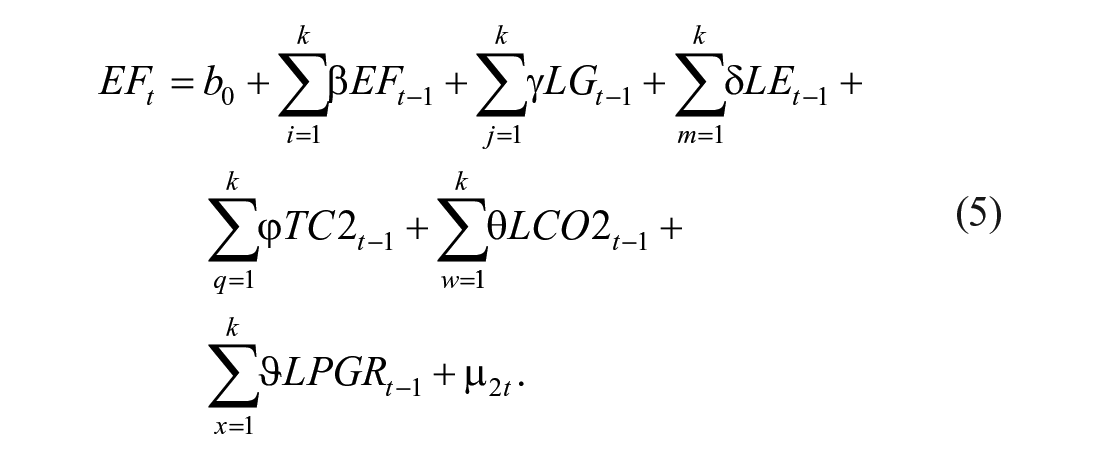
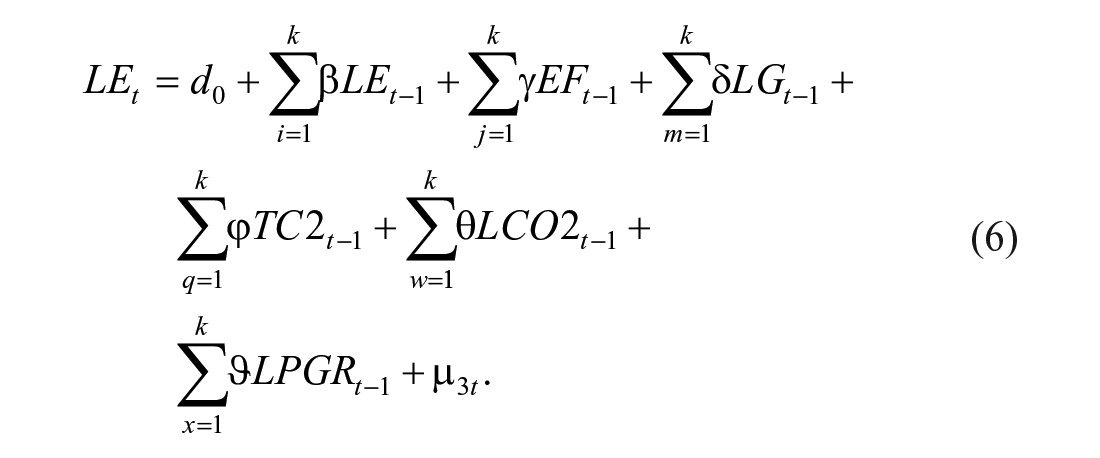
In this study, the issue of endogeneity was handled via the selection of appropriate lag lengths before applying ARDL using the Schwarz Information Criterion (SIC). Unrestricted error correction was applied to the ARDL regression such that each variable was estimated independently in different equations in order to obtain the coefficient using OLS (ordinary least squares), similar to Ahmad et al. (2019). This is given as:

With reference to equation (3), ∆ is changes in the operator, t is time bias,
Short-Run Model Specifications


Granger Causality Using VECM
By establishing the short and long run positions, the direction of the causal relationship among the variables can be identified through the vector error correction model (VECM) (Engle & Granger, 1987) and policy implications can be easily inferred. VECM can be easily run through simple regression, which enables the error correction model (ECM) to be established using residuals. The statistical significance and negative coefficient of the defined ECM indicate the relationship among the variables under study, while for the short-run relationship among the variables, the Wald test statistic can be applied.
Where


Empirical Results Analysis
Descriptive statistics are displayed in Table 1. The outcomes of the Jarque-Bera show that the variables are normally distributed, where the probability values are all above 5% level of significance.
Descriptive statistics.

Source. Author’s calculation using EViews 11.
As a pre-estimation test required for checking the stationarity of the series, we need to apply unit root test to identify the integration order of the variables. To achieve this, this study applies multiple unit root tests to be sure about the correct order of integration of the variables under consideration. The Augmented Dickey-Fuller, Dickey-Fuller, Phillips-Perron, and Ng-Perron tests were used as unit root tests for Ecological Footprint, Temperature Change, CO2 emissions, Economic Growth, Energy Consumption, and Population growth rate. The results are presented in Table 2 and show that all the variables are I(1).
Unit Root Tests (ADF, PP, DF-GLS, MZa MZt).
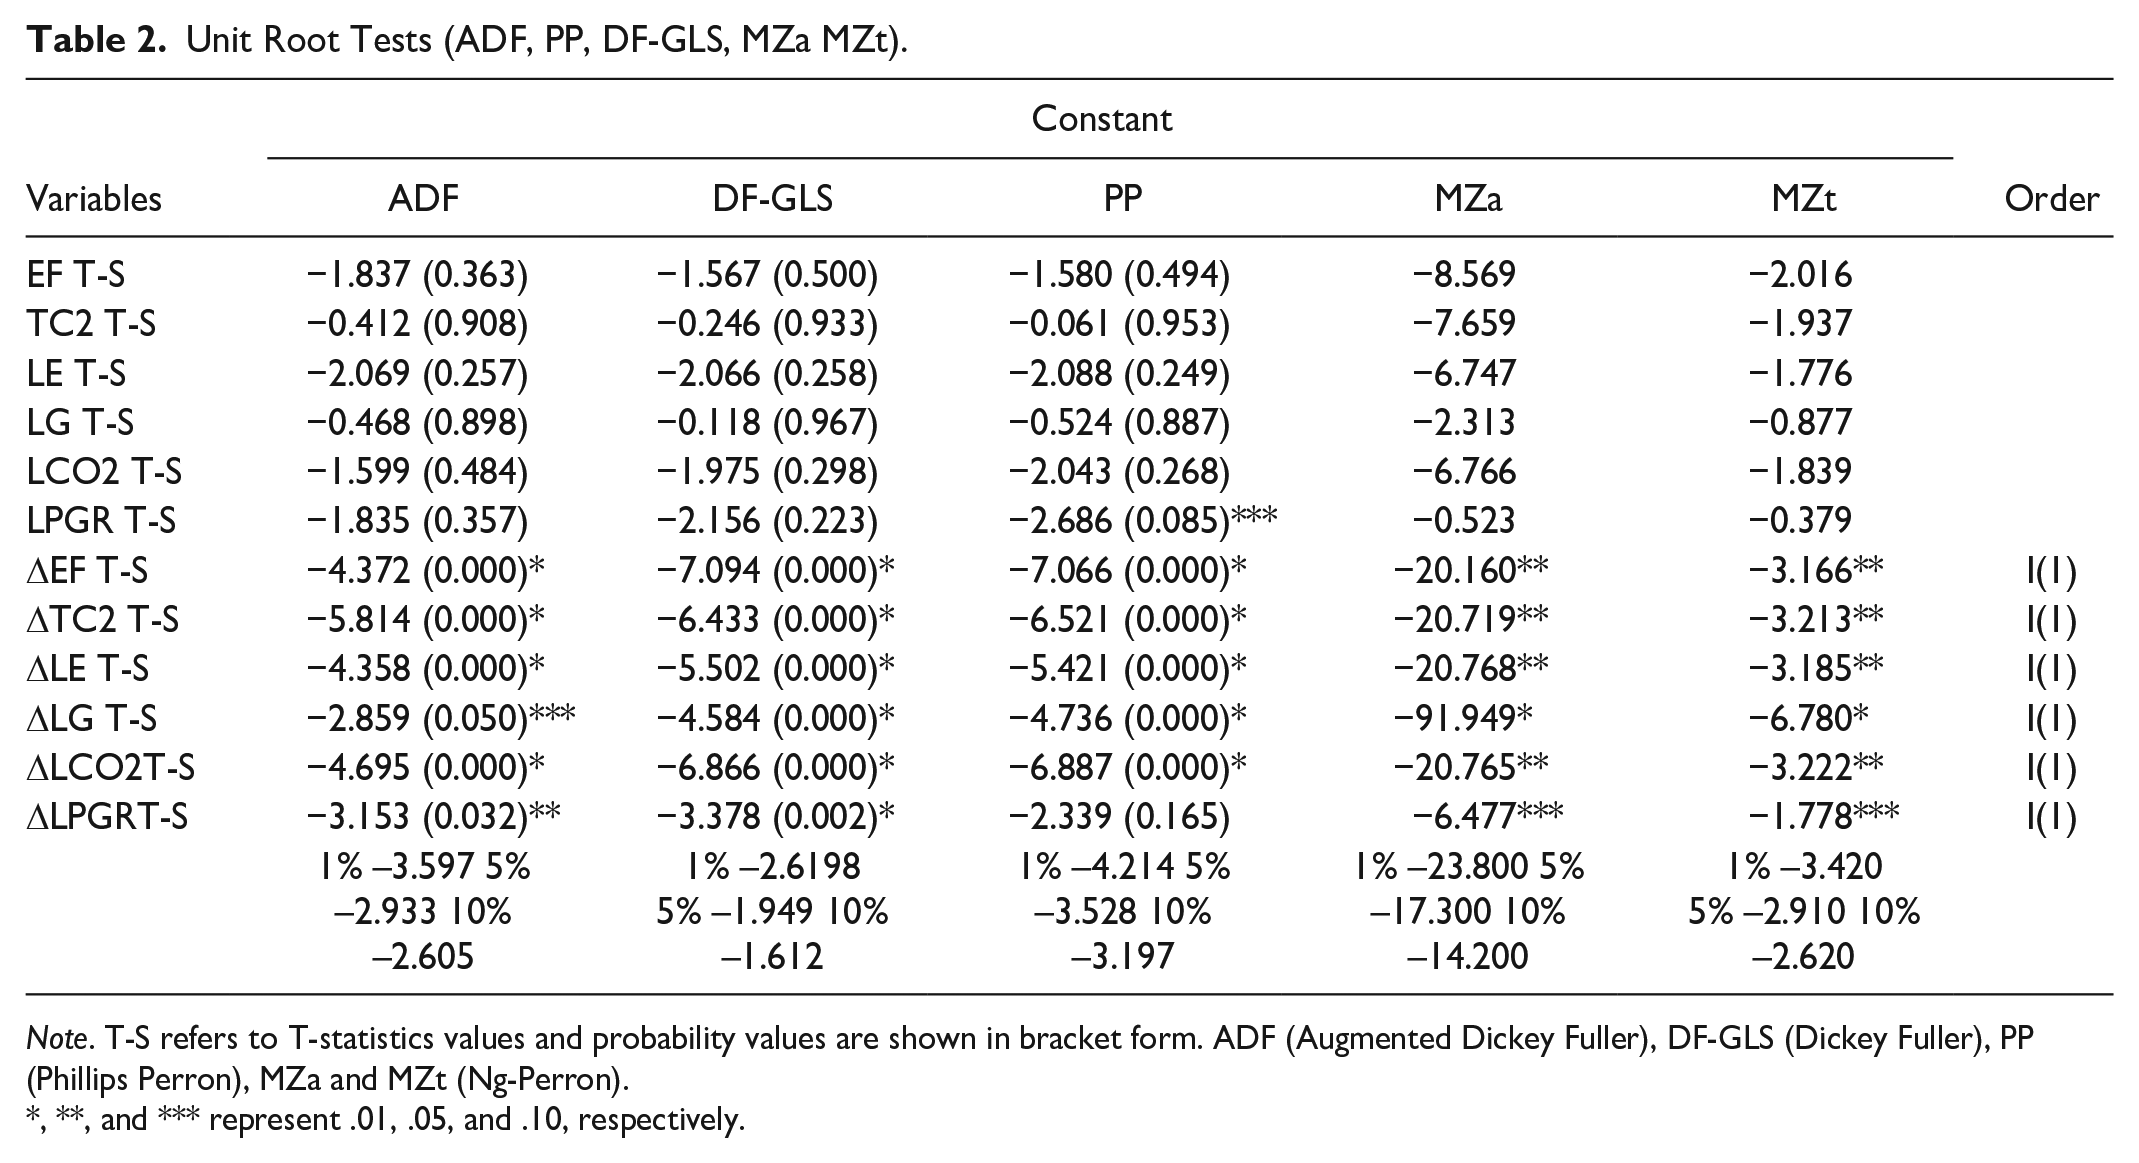
Note. T-S refers to T-statistics values and probability values are shown in bracket form. ADF (Augmented Dickey Fuller), DF-GLS (Dickey Fuller), PP (Phillips Perron), MZa and MZt (Ng-Perron).
, **, and *** represent .01, .05, and .10, respectively.
According to Elliott et al. (1992) the power of the Phillips and Perron (1988), Augmented Dickey-Fuller, Dickey-Fuller, and Ng-Perron tests is limited by their inability to display structural breaks, which are found in in most time series data, because of multiple random shocks in the time series such as economic, energy related, global financial, and other relevant external policies. This implies that the results of other traditional tests contain bias. Consequently, we used the Zivot and Andrews (1992) unit root test with structural break to overcome the shortcomings of the traditional methods, without which it may be difficult to display some relevant changes over time in the series. The null hypothesis if this test H0: θ > 0 is tested over the alternative hypothesis H1: θ < 0. The former indicates that the study variables contain a drift in the unit root which fails to show any structural break, whereas the alternative hypothesis shows that the variable is trend-stationary with a single break occurring at a particular time. The results in Table 3 above show the break dates and stationarity conditions of the variables at I(1).
Zivot-Andrews Unit Root Rest With One Structural Break.

Source. Sourced using EViews 10.
represent .01 level of significance.
The Bayer and Hanck method is known to estimate with efficient parameters and guarantees conclusive outcomes, which are not found when using other traditional co-integration approaches available in the field of econometrics. However, the failure to reveal the structural changes in the series mandates the use of the ARDL approach, the results of which are presented in Table 4. In this method, the rule is that the null hypothesis can be rejected when the calculated Fisher statistic is above the Bayer and Hanck critical values (Etokakpan et al., 2020). Based on the outcomes, the alternative hypothesis of co-integration is accepted at 1% level of significance for the combined co-integration; as such, the results indicate the existence of co-integration among the examined variables, and all dependent variables exhibit a long-run relationship.
Bayer and Hanck (2009) Co-integration Results.
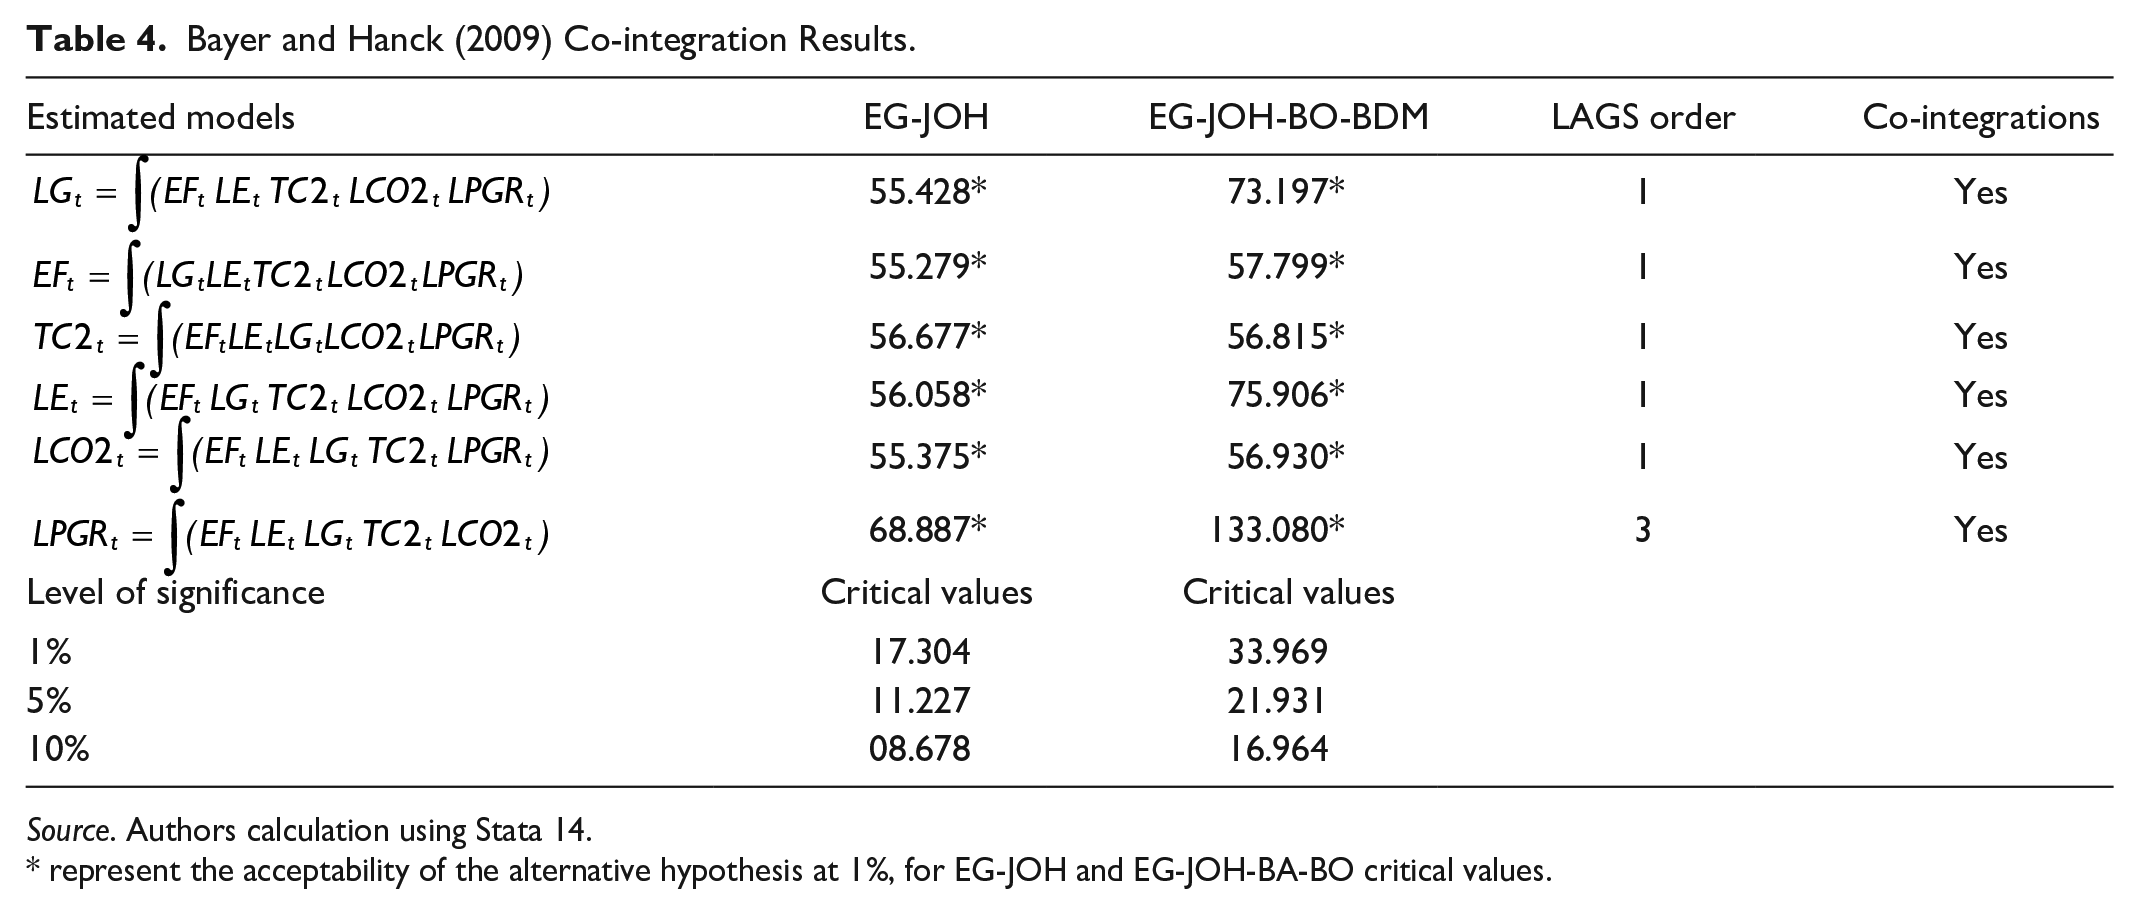
Source. Authors calculation using Stata 14.
represent the acceptability of the alternative hypothesis at 1%, for EG-JOH and EG-JOH-BA-BO critical values.
Table 5 presents the bounds test results, which show that three variables have evidence of co-integration relationships when each variable is tested as a dependent variable (namely LG, LE, and LPGR). The variables that only have a short-run relationship include EF, LCO2, and TC2, which means there is no evidence of long-run relations for these variables.
Co-integrations Test Results for the ARDL Method.

Source. Sourced: calculated using EViews 10. F-St = F-Statistics; BP = Breaks period; DWats = Durbin-Watson.
and ** represent the level of cointegration at 1% and 5%, respectively, numbers in () stand for diagnostic order, (bg) refers to Breusch-Pegan Godfrey Heteroscedasticity.
Once the long-run relationship is established, the VECM (vector error correction model) estimation will be the next step in the analysis. The general form of the ECM model for affected variables will be applied in the form of new equations. Those variables that do not show a long-run relationship can be considered for VAR estimations only. The results for stability diagnostic and serial correlations, which explain the validity of the model, can be adequately used for proper guidance and policy directions. This implies that the model is free from serial correlation, misspecification bias, has no heteroscedasticity and is homoscedastic.
Short and Long-Run Results
Parameter estimations of the short and long run relations were conducted after the requirements of the VECM method were met and the Schwarz Information Criterion (SIC) was applied in in selecting the lag of the series (Abbas et al., 2020; Adam & Abd Allah, 2020; Ahmad et al., 2019). Four lags were selected considering the criteria with the lowest value as recommended by the method (Pesaran & Pesaran, 1997). The results are presented in Tables 6 and 7, which indicate positive and significant long-run relations from ecological degradation, climatic change and population growth and that energy consumption has a negative influence on the economic growth of Nigeria.
Short-Run Test Results.

, **, and *** represent 1%, 5% and 10% respectively.
Long-Run Result.

Source. Authors calculation using Stata 11.
denotes to .001 ∆ mean change in the variable.
A feedback relationship exists between energy consumption and economic growth in the long run, which concurs with the findings of Bekun, Alola, et al. (2019) from their 16 EU countries using panel data, but conflicts with the results of Ali et al. (2020), who conducted research on Nigeria using the Toda-Yamamoto Granger causality test to determine the relationship between the two variables. According to our findings, growth and energy consumption have a significant and negative influence on each other. However, in the short run, energy consumption is insignificant for growth, while growth has a strong influence on energy consumption, thus indicating that there is a unidirectional relationship from economic growth to energy use. A 1% change in economic growth will cause energy use to change between 0.356% and 0.441%, which concurs with Yoo and Kwak (2010) but contradicts the findings of Shahbaz et al. (2016), Bekun and Agboola (2019), and Ali et al. (2020) who found that the direction of the causality was from energy to growth in Nigeria. Also, a bidirectional relation exists in Nigeria between the two variables, whereby a 1% change in economic growth or energy use will negatively influence the other by 10.144 and 0.272, respectively. This implies that in the long run, the effect of non-renewable energy on economic growth is a clear indication that non-renewable energy is a challenge to the productivity in the country. The policy implication here is that the government should implement proper strategies that will reduce the high consumption of traditional sources of energy in the country and encourage renewable energy methods where by the effects of carbon emissions will be reduced. See also, Saidi and Hammami (2015), Waqih et al. (2019), and Adedoyin et al. (2021) who found that most economic production in SSA is fueled by CO2-emitting related sources of energy; therefore, growth drives emissions in the region. These findings concur with the reports of some scholars on Nigeria, which suggest that 80% of Nigerian households are heavily reliant on traditional sources of energy for residential and commercial usage, such as Oseni (2012) and Ugwoke et al. (2020), who reasoned that poverty is the reason for not using renewable energy. However, others claimed that it is due to the lack of awareness on the importance of renewable energy in terms of the costs and benefits (Adelaja, 2020), as well as the poor terrain and policy inconsistencies (Gungah et al., 2019; Oseni, 2012; Petinrin & Shaaban, 2012) in Nigeria. Consequently, environmentally-friendly and modernized sources of energy are particularly encouraged due to the global concern for cleaner energy sources (Etokakpan et al., 2020). This necessitates that Nigeria should not only provide sources of renewable energy but also fight against poverty and create awareness campaign on the beneficial impacts of renewable and adverse consequences of non-renewable energy to the individuals and national economy.
In terms of the relationship between climate change and economic growth, a unidirectional relationship exists from climate to growth in both the short and long run. However, in the long run one unit increase in climate results in a positive and significant change (196%) in growth. These results support the findings of Bekun, Emir, et al. (2019) but disagree with those of Ayinde et al. (2011). This indicates the serious effect of climate change on economic growth in Nigeria. In return, the major source of livelihood will be affected, which is the agricultural sector, as most climatic factors are caused by human activities. This finding contradicts the results of Liverpool-Tasie et al. (2020), who revealed that in Nigeria, economic activities influence climate change. Hence, measures are required (technological mechanism and policy strategies) to overcome or reduce carbon emissions in the country.
The relationship between economic growth and ecological degradation is bidirectional. The empirical outcomes revealed that in the short run, growth has a positive influence on ecological degradation, while on the other hand; ecological degradation inversely affects economic growth. However, in the long run, degradation influences economic growth negatively. This implies that environmental factors have a serious effect on the Nigerian economy. Our results show that in the short run, ecological degradation has a negative influence on the economic growth of Nigeria. This implies that a 5% change in ecological factors will lead to a 50.1% change in the economic condition of the country. However, in the long run, ecological degradation positively influences economic growth. A 1% increase in good or bad ecological factors will lead to a respective change of 98.9% in economic growth. This finding does not support the results of Hassan, Baloch, et al. (2019), who found no causal relation between ecological degradation and economic growth in Pakistan. And Nathaniel, Anyanwu, et al. (2020) who found that, the influence flows from economic growth to ecological footprints in Middle East and North African countries.
Population growth and economic growth in Nigeria have a bidirectional relation in both the short and long run, which shows that both influence each other. This is caused by the growing factor of population in the country.
The Cumulative sum square (CUSUMsq) and Cumulative sum (CUSUM) tests were considered and applied as diagnostic tests for the stability and fitness of the models. The diagrams are presented in Figure 1 and show that the threshold is observed (i.e., 95%) within the statistical significance of 5%. This implies that the model’s functions are consistent and efficient for the parameters used in the short and long run validation.

CUSUM and CUSUM squares of the variables.
The researchers applied the Granger causality test to ascertain the directions of the causal relationships of the examined variables. This will help to identify appropriate policy strategies and directions toward economic growth, renewable energy, ecological quality, and environmental sustainability. Table 8 presents the VAR Granger causality results, which explain the nature of the causal influence among the variables under study. The patterns of correlations and usefulness for forecasting can easily be detected through Granger causality for the examined variables: Economic growth, ecological degradation, climate change, population growth, and energy consumption. Bidirectional flows are identified between economic growth, energy consumption, population growth, and climatic change. The results show that each of the above variables causes each other. However, a unidirectional relationship exists from ecological degradation to economic growth, which is opposite to the result of Ahmad et al. (2019), who detected a unidirectional flow from economic growth to ecological degradation in China. A similar bidirectional causality is detected flowing from climate change to ecological degradation and vice visa. Additionally, unidirectional causalities flow from ecological degradation to economic growth, population growth, and energy consumption in Nigeria.
VAR Granger Causality Wald Tests.
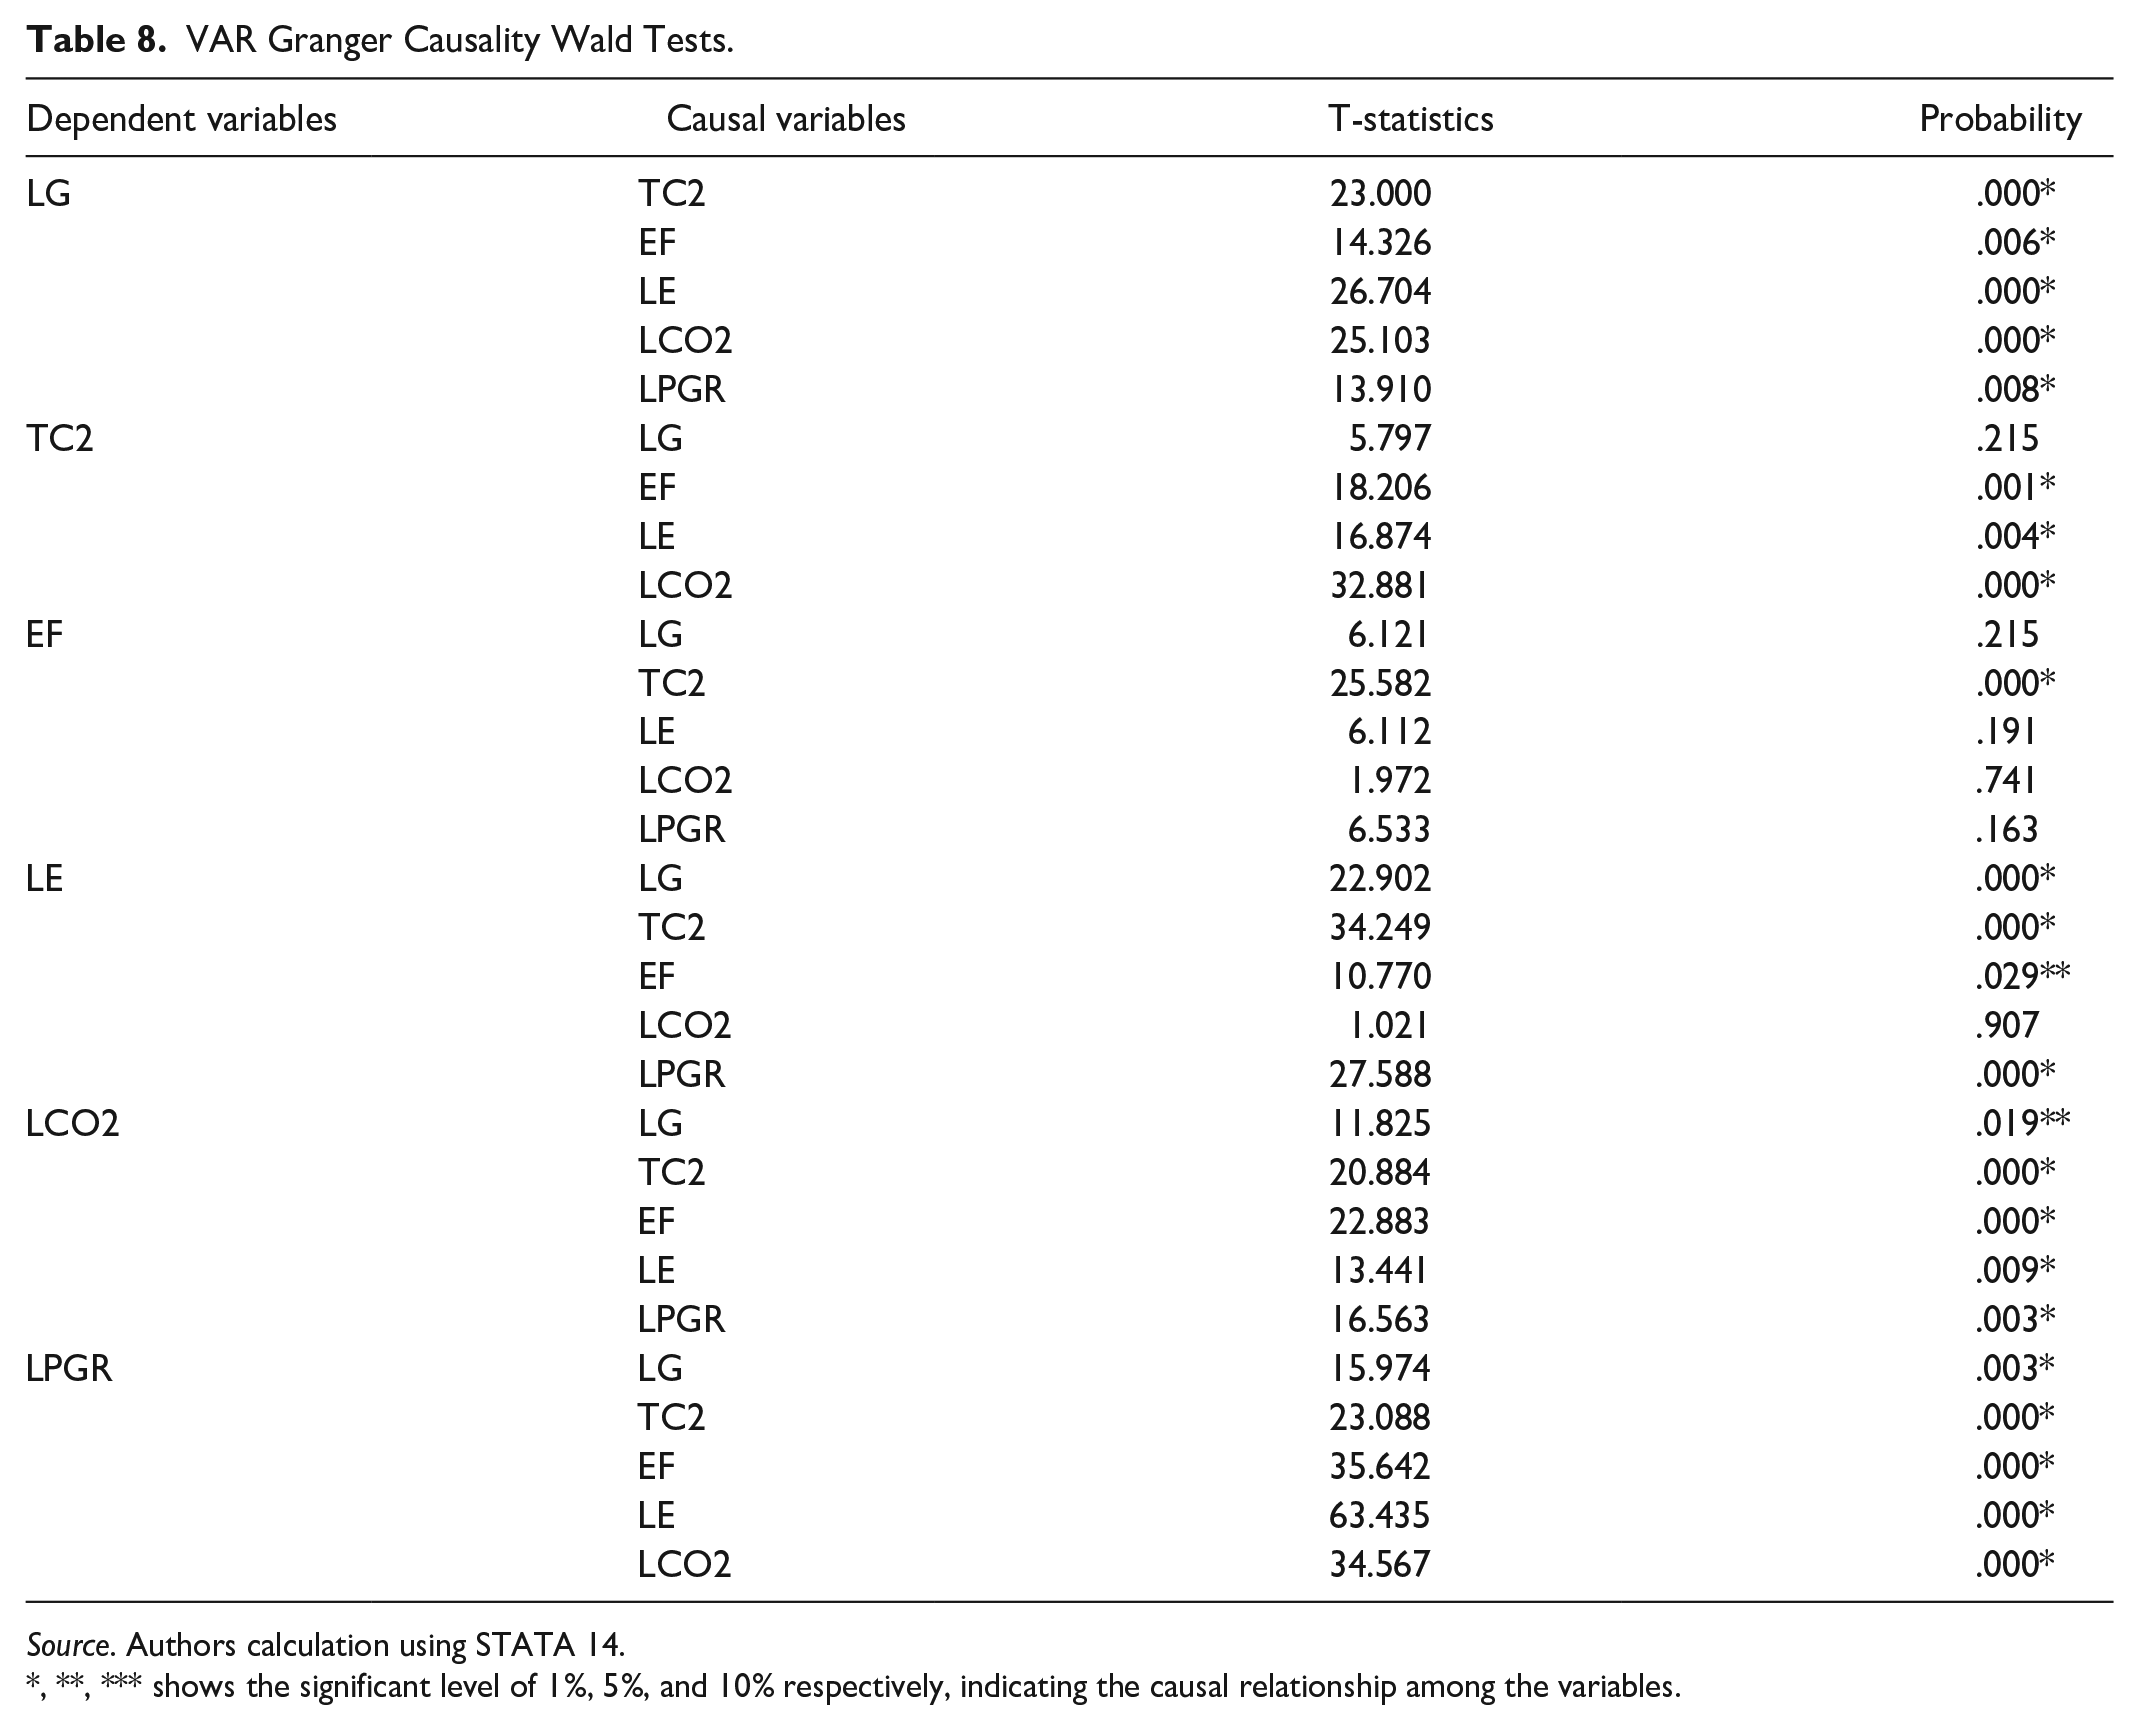
Source. Authors calculation using STATA 14.
, **, *** shows the significant level of 1%, 5%, and 10% respectively, indicating the causal relationship among the variables.
Conclusion and Policy Implications
This study examined the dynamic impacts of climate change, energy consumption, population growth rate and ecological degradation on economic growth for Nigeria from 1971 to 2014. The impacts of these key variables were analyzed via Autoregressive Distributed Lag, Bayer-Hanck combined co-integration, and VECM causality models. The results indicated there is co-integration among the variables. When economic growth is considered as the dependent variable, the findings show that climate change and population growth rate do have a strong negative impact in the long run. However, the findings show that non-renewable energy consumption has a significant positive influence on economic growth in Nigeria. Moreover, the Granger causality results indicate bidirectional causal relations between economic growth, energy consumption, population growth, and climatic change. However, unidirectional relations exist running from ecological degradation to economic growth, population and economic growth and feedback relationship exists between ecological degradation and climate change. With regard to population growth in Nigeria, a feedback relationship exists between population and energy consumption, temperature change, and CO2 emissions while there is unidirectional relationship flowing from ecological degradation to population growth. In this sense, it can be concluded that population growth, energy consumption, and ecological degradation are key to sustainable growth that will pose less of a threat in terms of climate change. The implication of this highlights a need for the country to strengthen its environmental regulatory institutions to promote a paradigm shift from conventional to renewable energy sources. This will reduce ecological degradation and enhance environmentally-friendly economic growth. While this study explored the dynamic effect of climate change, energy consumption and ecological degradation on economic growth, future research is encouraged to incorporate other key drivers of ecological degradation such as demographic, socio-political, religion, and cultural issues that impact sustainable development in developing countries.
Footnotes
Declaration of Conflicting Interests
The author(s) declared no potential conflicts of interest with respect to the research, authorship, and/or publication of this article.
Funding
The author(s) received no financial support for the research, authorship, and/or publication of this article.