
Abstract
Development of renewable energy is important to modern society because climate change induced from fossil use has resulted in severe and possibly irreversible environmental impacts such as sea level rise, desertification, diminished land productivity, and increased possibility of extreme events. Therefore, the utilization of renewable and clean energy not only increases regional energy security but also alleviate the environmental risk. In this study, we employ the lifecycle assessment to examine the electricity generation from the use of municipal solid waste in China, and then investigate the emission reduction from this application. Different supply patterns of the wastes are also compared to make the results more robust. The results show that if recycled wastes are fully utilized, approximately 11,107 GWh can be generated, along with a profit of $1.2 billion from energy sales. In this case, the CO2 emission will reduce by 9.7 million metric tons. If the food waste is used in compositing and animal feed, the net power generation and emission reduction are about 8,216 GWh and 7.32 million metric tons, respectively. If additional 30% of recycled wastes are assumed to be utilized in their past use, the power generation, profit, and emission reduction will further decrease to 5,750 GWh, $697 million, and 5.12 metric tons, respectively. The results point out that the utilization of recycled wastes can effectively reduce the reliance on fossil fuels, improve energy security, and increase social welfare. Insights of the results and policy implications are also discussed in detail.
Introduction
Municipal solid wastes (MSW) have been greatly produced due to rapid growth of the economy and residents’ living standard. As indicated by Elsen and Vierin (2006), the daily generation of MSW is more than 10 billion tons worldwide and is likely to increase by 40% in 2020. However, inappropriate disposal of the wastes has also caused the deterioration of air, soil, and underground water quality, along with the negative influences on the environment and health of the habitants (Babayemi & Dauda, 2009). Therefore, looking for an effective approach to recycle and utilize MSW is an urgent task in the modern society.
Carbon emission related to the energy consumption in China was about 8,547 million metric tons in 2012, the largest carbon emission country in the world. Because the rapid increase in carbon dioxide emissions will not result in sustainable development, it has got national and international attention (Lin et al., 2016). For this reason, there is a need to change the energy policy and strategy of the country to mitigate the effects of global warming and reduce the level of CO2 emission (Guo et al., 2014; Kung & McCarl, 2020). Because municipal solid waste is constantly supplied on a daily basis, it can be considered as a reliable renewable energy source to improve energy security, and thus the analysis of the power potential from MSW have been widely examined in many regions and countries.
China is the most populated country in the world and the greater the urbanization it is, the more MSW will be generated. In recent years the huge amount of MSW has attracted great concerns by the government because unregulated disposal of the wastes has resulted in severe environmental problems. Moreover, since the MSW is potentially applicable for power generation, how to appropriately deal with the wastes and to what extent the wastes can benefit have been highly focused.
Waste to energy technology is a mature process that has a positive perspective in China. While waste to energy plants faces some difficulties such as the emissions of toxins and public opposition, as well as the high development and financing costs, the reduction of greenhouse gas emission by its application may also bring substantial benefits to the producers and local governments. Therefore, the MSW application could be considered an effective approach to improve resource recycling, renewable energy production, and environmental protection, and the local governments have promoted such utilization in recent years (Xin-gang et al., 2016).
Many studies have analyzed the economic and environmental effects of MSW application in developed countries, but the analysis focusing on China’s populated zone is rarely found. Jiangxi, the southeastern province of China, has been experiencing rapid urbanization for the past two decades. In 1995, approximately 2.32 million tons of MSW was produced, which has been rapidly increased to 8.58 million tons in 2018 and such a huge amount of MSW has resulted in severe environmental problems. Therefore, the local government aims to explore how the use of wastes may alleviate environmental problems and increase the supply of renewable energy.
Based on these motivations, this study aims to investigate the following issues. First, we analyze the net economic and environmental benefit from MSW application in Jiangxi province. The lifecycle assessment will be employed to access the costs associated with input collection, transportation, pre-processing, and utilization, as well as the benefits from energy sales and emission offset. Second, this study investigates the potential electrical generation under different MSW utilization modes to examine whether the use of MSW would alter its efficiency.
By completing these tasks, this study draws a general picture with consideration of alternative uses of recycled MSW, the sufficiency of incinerator capacity, and level of energy security improvement. The implementation of cost and benefit analysis explores the feasibility and profitability of such an application. Specifically, this study makes the following contributions. First, the results provide the energy potential of MSW in major cities of Jiangxi province. This information is useful to local governments to understand whether this technology is applicable in a specific region. The results can prevent some cities from investing too much capital in a technology not feasible at the regional level. Second, this study improves the understanding of the environmental and economic consequences through the utilization of MSW. Third, this study incorporates a more general framework that can easily adjust regional characteristics for other China’s provinces.
Literature Review
The expansion of population and growth of economy result in substantial production of municipal solid waste in many regions including developing countries like China and India and developed countries like the United States and European Union (Couto et al., 2015). If the wastes are not dealt properly, it generally causes environmental problems. For example, from 1960 to 2013, in the United States the production of MSW is doubled to 250 million tons and this has results in numerous adverse effects on the environment and human health (Malinauskaite et al., 2017).
Municipal solid waste is normally processed in three ways such as thermal treatment, biological treatment, and landfilling. Landfilling is currently a dominant technology in China. It handles over 80% of MSW, but this approach is harmful to the surface water and groundwater (Asnani, 2006). In 2019, the portion of landfilling is reduced to 60.3% and the percentage of incineration application increases to 33.9% (Yao et al., 2019). Another reason for the decrease of landfilling is because the Chinese government released several policies to encourage MSW recycling (Chen, 2019; Lv et al., 2020).
Unlike landfilling, thermal treatment directly decreases the volume of municipal solid waste because it converts wastes into heat energy and biofuel (Chua et al., 2011). Another alternative to use municipal solid waste is the application of the pyrolysis process. Pyrolysis of wastes is considered a relatively cleaner method to incineration because of it emits less emission (Song et al., 2017). Therefore, Waste-to-Energy (WtE) technology is an attractive alternative to help improve energy security, reduce the volume of the wastes, and bring environmental benefits (Patumsawad & Cliffe, 2002).
In general, converting wastes into energy is profitable and proper management practices will help to reduce GHG and make this technology economically feasible. As shown by Tan et al. (2014), approximately $2,511 million and $61.30 million can be generated by energy sales and carbon credit, respectively. However, the efficiency of the plant operation is also a key factor to improve the environmental and economic benefits (Menikpura et al., 2016; Niskanen et al., 2013).
Life cycle analysis (LCA) is widely used to analyze the cost and benefit of the projects. In terms of WtE technology, the framework of life cycle analysis is built under the guidance of IPCC to assess the GHG emission during the whole process of collection, transportation, incineration, landfilling, incineration, and power generation (Maalouf & El-Fadel, 2019). Many researchers have utilized this approach to evaluate the economic and environmental benefits in waste management projects (Potdar et al., 2016). For example, Cheng and Hu (2010) show a net profit of $3.31 million, about 12.7% of total investment in 2006. Udomsri et al. (2010) also show such projects are economically viable because of desirable payback period, NPV and IRR estimates.
To encourage WtE application, China provides the national unified feed-in tariff for the waste to energy projects was $0.11/kWh in 2010 (China Solid Waste Network, 2010) and is providing up to 80% of subsidy on the interests engaged in WtE investment (Finance, 2016; Liu et al., 2019). The United States (Michaels, 2014), Canada (Shareefdeen et al., 2015), Japan (Finance, 2016), Germany (Finance, 2016), and Turkey (Marktscan, 2013) also have various forms of supports and policies to promote WtE application. Since 2013, the installed WtE capacity in the United States has been expanded to 2,800 MW and approximately 12.9% of electricity supply is provided by merely 80 processing plants (Michaels, 2014; Rezaei et al., 2018).
However, it is noticed that the compositions of MSW in China have some distinct features to developed countries. For example, food waste is 50% in China but only 20% to 30% in the US and Europe (Cheng et al., 2007; Li et al., 2001; Zhang et al., 2008), and thus the net power generation from MSW should be revisited if in the future the compositions of MSW in China are changed.
Examination of MSW-Based Power Potential
Table 1 displays the general information of the study region. Because a greater portion of the recycled MSW is landfilled, it implies that WtE technology, if well implemented, can potentially improve the domestic energy supply. Table 1 also indicates that the population is positively related to the supply of MSW. For example, Shangrao, Ganzhou, and Nanchang with more population have greater amounts of MSW that is more likely to have higher MSW power potential than smaller cities such as Jingdezhen, Xinyu, and Pingxiang.
Demographics and MSW Production of Major Cities in Jiangxi, China.

Compositions and Energy Content of MSW
Before we can investigate the power potential from MSW utilization, it is necessary to determine the compositions of components consisting of the MSW; otherwise, the power potential will be either under or overestimated. Table 2 displays the compositions and heat content of MSW in the 11 major cities.
General Information of MSW.
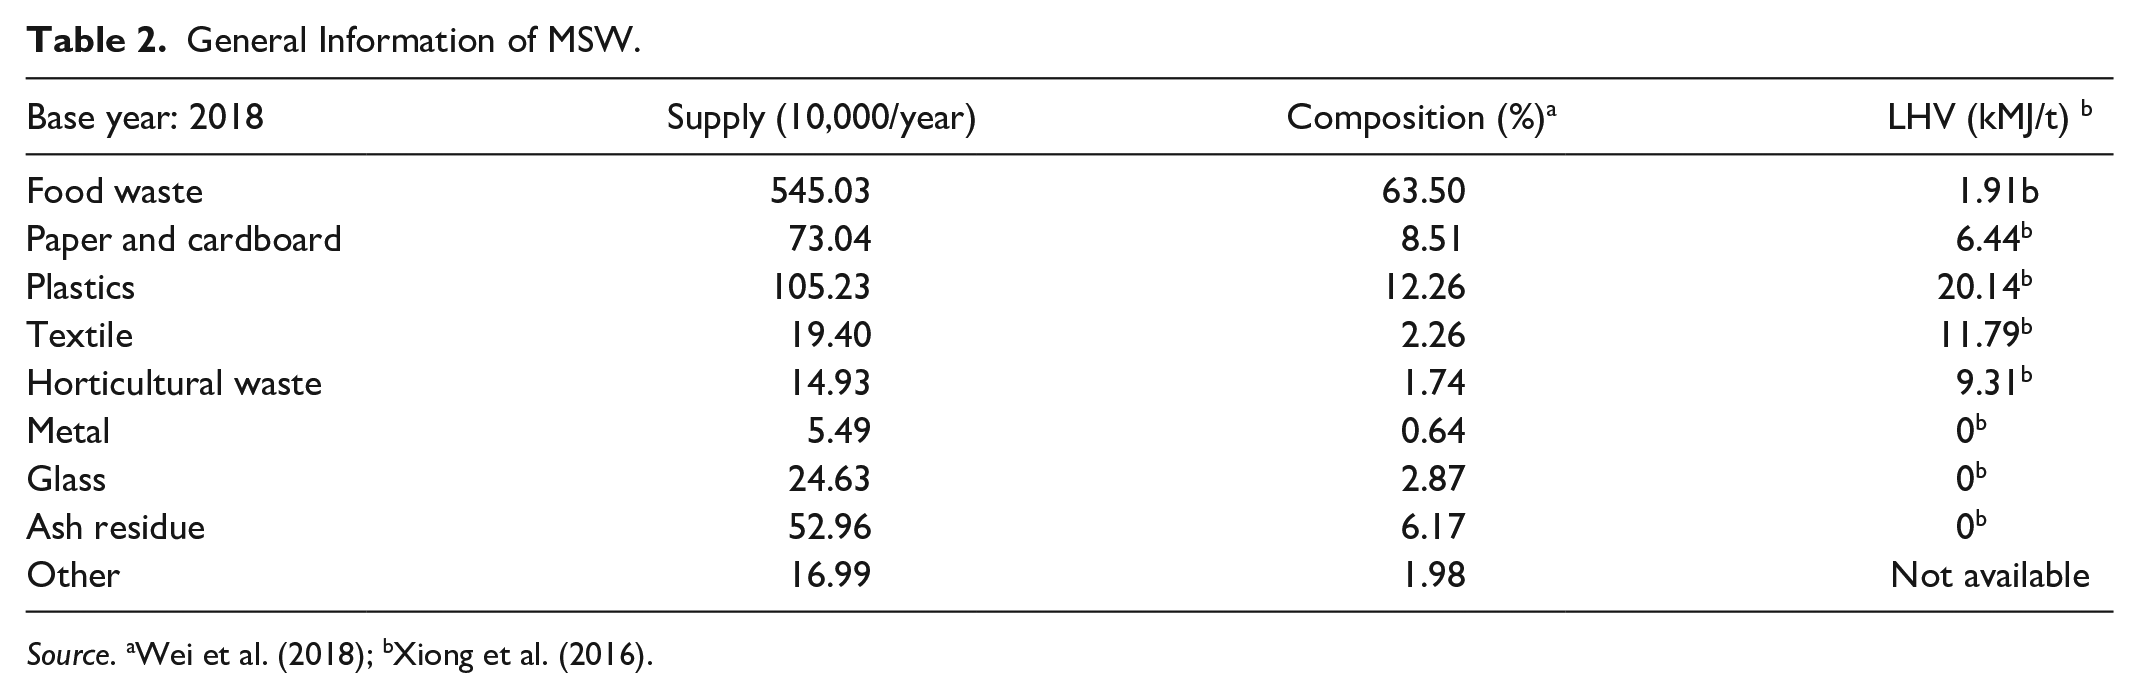
Source. aWei et al. (2018); bXiong et al. (2016).
Table 2 shows that about 63.5% of MSWs consist of food waste, but whether it provides a substantial amount of renewable energy depends on the heat content. The lower heating value (LHV) is generally used to indicate the energy to be provided by a source. So far it is unclear that whether the proper utilization of food waste may contribute substantial renewable power, for which has a much smaller LHV than others. Moreover, since we are not incinerating metal and glass, we remove these materials and unidentified components such as “others” and “ash residue” from this study by assuming that they are left for the original uses.
Characteristics of Regional MSWs
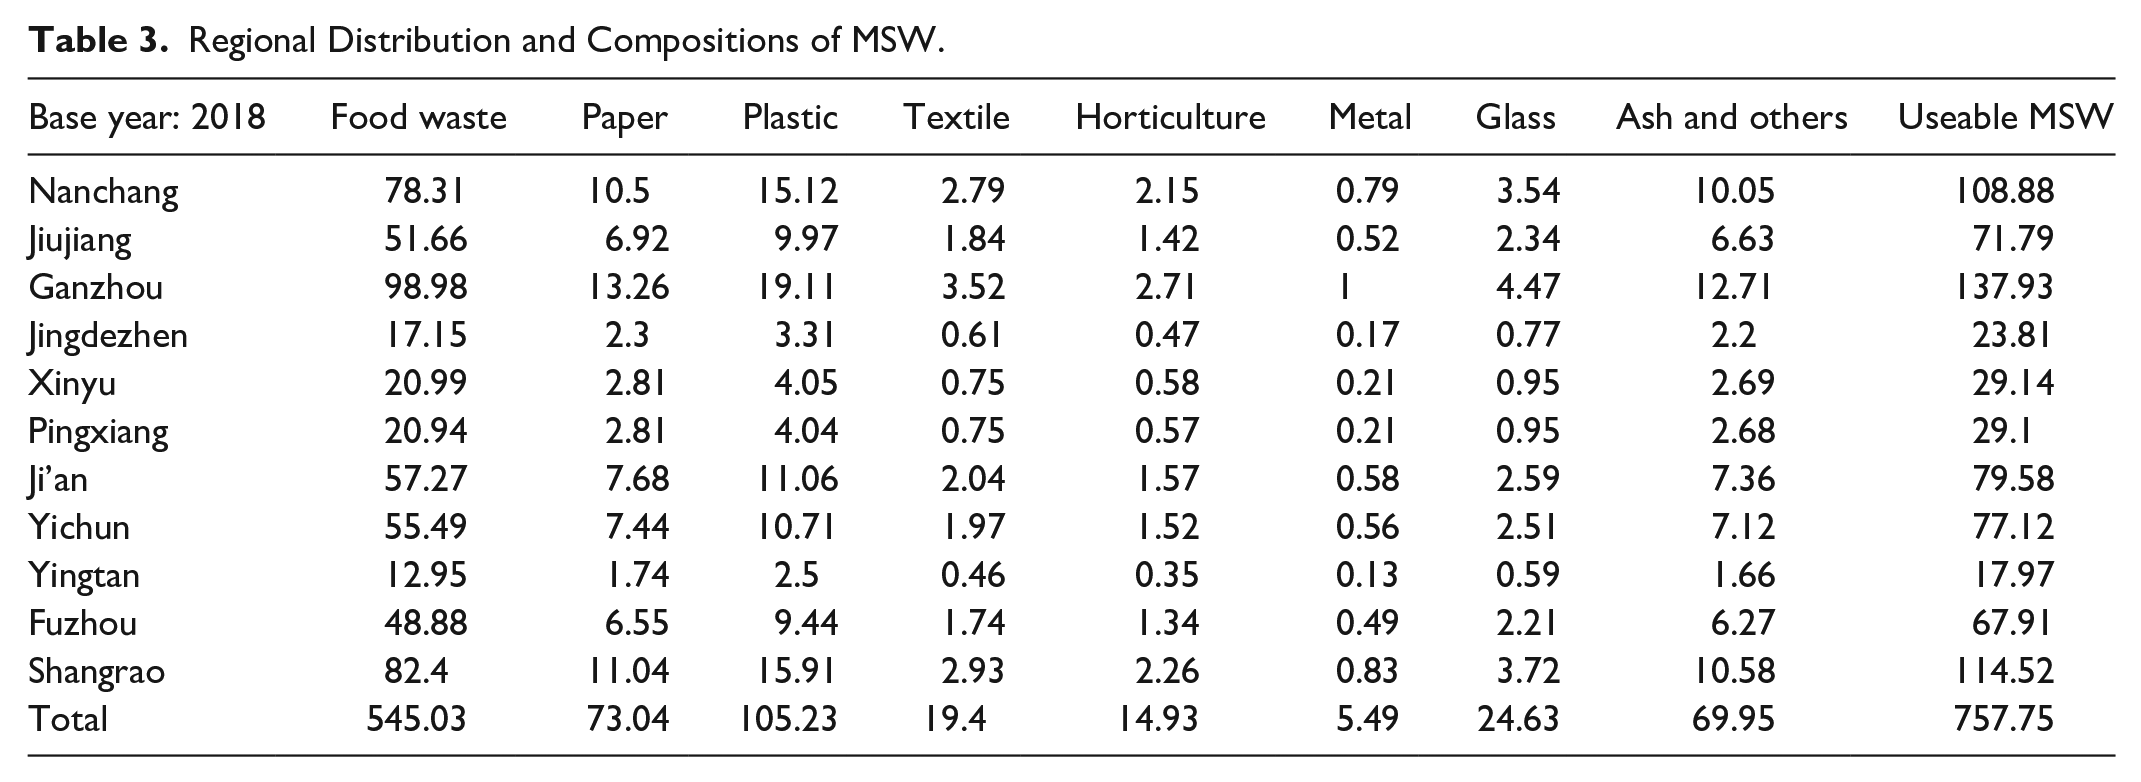
Based on Tables 1 and 2, we can decompose the total MSW in each city to explore the energy potential from various wastes. Conceptually, we can use the following formula to express this manipulation:

where Wasteij is an ith type of waste in city j, Total MSWj is the annual MSW generation in city j, and Compositioni is the percentage of ith type of waste. By using this equation, we estimate the amount of various MSWs in each city. The results are presented in Table 3. The metal, glass, ash, and others have been removed from the total useable MSW.
Regional Distribution and Compositions of MSW.
Regional Power Potential From MSW
With the total useable amount of MSW, the percentage of the compositions of each waste category, and the lower heating value of each component, we can calculate the MSW-based power generation of each city, and the power potential from each useable source. The result is displayed in Table 4. The net power generation from MSW utilization is 11,107 GWh, of which 53% comes from plastic and 26% from food waste. In addition, 18.2%, 15.1%, and 14.4% of power generation are provided by Ganzhou, Shangrao, and Nanchang city because they have the greatest population. The results imply that the investment on WtE technology in these cities might be more efficient.
Power Generation in Different Cities (GWh per year).

Economic and Environmental Analysis from WtE Application
We have estimated the power generation in major cities of Jiangxi province, but whether the application is economically feasible is still uncertain. In this section we provide the economic analysis to demonstrate whether this application is profitable, and under what circumstances the investment should not be made.
Economic Analysis of WtE Application
Cost of installation and operation
Installation and operation costs, as well as the contract price of renewable energy generally differ from country to country. Table 5 shows the investment requirement, cost for plant operation, and power purchase price of different WtE facilities. The contract price in China is between $0.05 and $0.14, depending on the grid location. Here we use the average purchase price of renewable electricity to calculate the revenues from energy sales.
Cost and Purchase Agreement in Different Countries (US$ per kWh).

Source. Finance (2016) and Mendona (2010).
Revenues from energy sales
While revenue from energy sales is probably the most attractive indicator to producers, it can be received only after the wastes are transported to the incinerators and converted into electricity. Therefore, if the cost associated with the transportation is expected to be very high, then it is likely that the producers will not employ this technology. For this reason, it is necessary to explore the potential transportation costs in advance. Here we assume that the incinerator with 75,000 capacity is located in the center of a square surrounded by a square grid layout of roads, and thus the average hauling distance (


where S is the amount of regional wastes that will be hauled to the plant, Y is the average annual production in tones of municipal solid waste multiplied by an assumed waste density of 20% based on urbanization level. 640 is a conversion factor for the number of acres per square mile, Ld is the truckload size with an assumption of 23 tons per load, b0 is a fixed loading charge of $90 per truckload, and b1 is the hauling cost of $2 per km. We will double the hauling distance for the roundtrip. However, the loading charge b0 will be zero for the returning trip.
Assuming there is no acquisition cost of MSW, the primary cost associated with the WtE application might be transportation. Table 6 indicates the revenue from energy sales and cost from waste transportation. The result is desired because the revenue is about 1.34 billion dollars and the cost only increased by 72 million dollars. As the supply of the waste is generally linearly increased with population, the larger cities such as Ganzhou, Shangrao, and Nanchang would have a higher potential in MSW-based renewable power generation. However, before we wholeheartedly embrace this result, the purchase price is much higher than the ongoing electricity price, implying that without such a subsidy the benefit from energy sale will decline. The detailed information of MSW transportation is provided in Supplemental Materials (Appendix A).
Transportation and Energy Sale.

Environmental Analysis of WtE Application
In this section, we further investigate the environmental consequences of WtE application. Specifically, we will use a lifecycle assessment to explore the emissions from transportation, operation and maintenance of incinerators, and fossil replacement from renewable energy. Transportation involves not only hauling cost but also emission from diesel use. We use the industrial average of 100 km on the 23-ton truck to estimate the net fuel use and subsequent emissions. The study also converts the fuel requirement for daily operation and maintenance into CO2 equivalent measures. We use the standard energy content of thermal coal to calculate coal replacement. The results provide a basis to examine the environmental gain from emission trades and are presented in Table 7,
Emission and Offset From WtE Application (1,000 tons).

Totality of Value
The WtE application brings economic and environmental benefits. While the economic measures have been provided, the environmental benefit such as emission reduction has not been estimated. In China, there are no prevailing emission prices and thus we take the emission price of $4 per ton to calculate the potential environmental gain, based on the recommendation of National Emissions Trading Scheme of China (2021). Table 8 shows all converted economic and environmental values of WtE application in China.
Profitability of WtE Application (in million US$).

The results show that if WtE is properly implemented, the preprocessing cost of $151 million and the fuel and hauling cost of $72 million and a profit of approximately $1.2 billion can be expected. Compared to the revenues of energy sale, the environmental benefit is relatively smaller due to the low emission trade price of $4 per ton of CO2. However, after the Paris Agreement, almost all parties agree to impose a more strict environmental regulation, which implies an increase in emission trade price, as well as the environmental benefit from emission reduction in the future.
Sensitivity Analysis
So far the study examines the “NET” power potential, economic feasibility, and emission reduction of WtE application in the study area. However, the above calculation is based on the situation that 100% of recycled wastes are incinerated, and this may not be true for two reasons. First, while the food waste is generally properly recycled, it is usually used for animal feed and compositing. This means that power generation is likely to be overestimated when we remove food waste. Second, the paper boxes, textiles, and other wastes usually have their original uses that cannot easily be replaced. Incorporation of these wastes with an assumption of perfect utilization of the wastes will also overestimate the power generation, profitability, and environmental benefits. Therefore, this study further investigates the biopower generation under different uses of wastes. Specifically, we examine (1) removal of food waste from power generation and (2) removal of 30% of other wastes, to investigate the influences of waste uses.
Case I: Removal of Food Waste
Table 9 shows that with the removal of the food waste, the net power generation has decreased from 10,167 to 8,215 GWh. In other words, when the food waste remains in the conventional uses such as feeds and compositing, the renewable power from incineration would reduce by about 26%. Here another question arises: is it possible to replace the animal feed and compositing with another source and keep incinerating food waste to enjoy higher energy output? The answer to this question is ambiguous because it makes the situation more complicated. For example, if the farmers can apply more fertilizer on cropland, then the requirement of compositing coming from food waste could be reduced, and this portion of food waste can still be utilized for power generation. But if the land is relatively bare and compositing can substantially improve the land quality and improve crop yield, the use of food waste in incineration implies that some economic incentives must be provided to farmers so that they are willing to purchase more expensive fertilizers; otherwise, no farmers will take this option. Additionally, the analysis of the uses of food wastes could be complicated because numerous regional characteristics will involve, and here we avoid this complexity by simply assuming the food waste will stay in its original use.
Power Generation Without Food Waste (in GWh).

Case II: Removal of 30% of Other Wastes
Another scenario goes one step further to explore the lower bound of power generation. Now we take another 30% of wastes away to examine the power potential from useable recycled wastes. Not surprisingly, that the power generation would further decline to 5,750 GWh because fewer wastes can be used for power generation. We find that the power potential of the three largest cities decreases most significantly because they suffer the most from waste removal. Table 10 shows the result.
Lower Bound of MSW Power Generation (in GWh).

Profitability of New Scenarios
In this section, we estimate the revenues from energy sales and emission trades, and the costs of waste transportation and plant operation to investigate to what extend the profitability will be affected under different scenarios. Table 11 shows the result of revenues from energy sales. When the amount of useable wastes decrease, the revenues sharply decline by 26% and 48.2%.
Revenue from Energy Sales (million US$).

Note. The Base is the energy sale when 100% of MSW is utilized in power generation, Removal 1 indicates the removal of food wastes, and Removal 2 indicates the removal of 30% of other wastes.
The next step is to analyze the emission consequences under various scenarios. Since the usable waste is reduced in the assumed scenarios, it is obvious that the transportation efforts will decline; thereby reducing fuel used in transportation and associated CO2 emissions. We also assume the plant operation cost and fuel used to incinerate wastes will reduce proportionally to the waste received. With such a formulation, we again use equations (2) and (3) to estimate the emissions during the entire application cycle. The result is presented in Table 12.
Emission from Plant Operation, Transportation, and MSW Application.

By removing food waste from renewable energy production the emission released from MSW application is about 80,600 tons while that for removal of 30% waste is approximately 65,700 tons. Since the reduced input means less energy output, we also need to estimate the emission offset from fossil replacement to verify the amount of total emission reduction.
For the food removal scenario, the net emission reduction is 7.32 million metric tons and 5.12 million metric tons for the 30% removal case. While the result is desirable, we find that the net emission reduction decreased by 24.6% for the food removal scenario and 47.2% for the 30% removal scenario, implying that the stability of waste supply is important to total emission reduction. There is merit to make further discussion of this issue because in recent years, Jiangxi Province is losing its population due to slow economic development and low wage rates. If this trend cannot be reversed, power potential from MSW utilization will inevitably decrease further because less population is equivalent to less waste supply.
While the emission reduction seems substantial, it is estimated under the experimental coefficients that usually reflect optimal values, and it is likely to have substantial loss of heat during energy conversion process. Therefore, when we use this assumption for large-scale WtE application and if the energy conversion loss is not taken into account, the result is likely to be overestimated. Although in this study we merely focus on the net energy available from MSW and WtE application rather than the accurate estimate of end-point power use, it is necessary to understand that in reality there are many issues influencing the results (Table 13).
Profitability of MSW Application Under Waste Removal Scenarios.

Under the waste removal scenarios, the utilization of MSW in power generation can still make substantial profits, primarily from energy sales. It is also noticed that for the food removal scenario, the net economic benefit only decreases by 17% but 41.7% for the 30% of waste removal case. Additionally, because the costs associated with execution, monitoring, and management are not incorporated, it is also possible to observe an even lower net profits if these costs are substantial. Based on the results, several policy recommendations can be provided:
First, it is recommended that MSW application for energy generation is an economically and environmentally feasible solution even if a portion of MSW is reutilized for other purposes. Second, research and development are needed to improve the operating efficiency of incineration technology and reduce the per-unit cost of energy generation, both of which will eventually increase total emission reduction from MSW utilization. Third, if China is able to establish an Emission Trading System (ETS), the existence of the emission trading price would benefit the power producers and thus possibly further improve the large-scale development of MSW application. Fourth, the composition of the MSW may differ from region to region so that the development of the “waste to energy (WtE)” facility needs to incorporate the regional characteristics of MSW. Finally, the application of GIS or Real Road System would better reflect the estimates of the total transportation distance, fuel usages, and transportation costs that help the exploration of the economic and environmental consequences.
Conclusion Remarks
While municipal solid waste is generally considered to be useless and landfilled in China, it indeed is a valuable resource if it is properly utilized. In modern society, energy security is a major concern because fossil energy will inevitably be depleted and emissions from its use could hamper environmental sustainability. Therefore, converting the heat contained in MSW becomes an attractive and applicable approach for renewable power generation and environmental protection. This study employs the lifecycle analysis to examine how the alternative uses of MSW would benefit.
The results show under the fully utilized MSW, removal of food waste, and 30% removal of total MSW scenarios, the power potential would be 11,107, 8,216, and 5,750 GWh, respectively. The economic benefits of these scenarios would be $1.20 billion, $995.1 million, and $697.8 million, along with the emission reduction of 9.7, 7.3, and 5.1 million tons, respectively.
We show that the application of MSW is profitable, but it is also noticed that the heat loss during the conversion and transmission stage may vary under different incinerating modes, which is likely to alter the end-point electricity output and social benefits. The types of incinerating engines should be taken into account to not to be over-optimistic about the WtE application and regional power potential.
Some limitations of the study are also illustrated so that the future researches could conduct further investigations. First, it is noted that the production of MSW is rising continuously for years while the population of Jiangxi province is not growing proportionally. Therefore, the per capita supply of MSW may not be a good estimate in the future. Second, the cost associated with the pre-possessing and transportation may vary across cities and the uses of MSW are based on the historical patterns. Under this assumption, the real benefits from the MSW application may not be reflected. Third, in this study, we did not take the heat loss during the conversion and transmission stage into account, and thus the results only illustrate the net power potential rather than end-point electricity. For places where efficiency is relatively lower, this assumption may be released to not be over-optimistic about the WtE application and regional power potential.
Supplemental Material
sj-docx-1-sgo-10.1177_21582440211061316 – Supplemental material for Renewable Power Potential from Municipal Solid Waste: A Case Study in Jiangxi, China
Supplemental material, sj-docx-1-sgo-10.1177_21582440211061316 for Renewable Power Potential from Municipal Solid Waste: A Case Study in Jiangxi, China by Rafiq Muhammad Aftab, Liguo Zhang and Chih-Chun Kung in SAGE Open
Footnotes
Declaration of Conflicting Interests
The author(s) declared no potential conflicts of interest with respect to the research, authorship, and/or publication of this article.
Funding
The author(s) disclosed receipt of the following financial support for the research, authorship, and/or publication of this article: The author(s) thank for the financial support of the National Natural Science Fundation of China (41861042; 72173006) and the Natural Science F0undation of Jiangxi (20202BABL205024).
Supplemental Material
Supplemental material for this article is available online.
References
Supplementary Material
Please find the following supplemental material available below.
For Open Access articles published under a Creative Commons License, all supplemental material carries the same license as the article it is associated with.
For non-Open Access articles published, all supplemental material carries a non-exclusive license, and permission requests for re-use of supplemental material or any part of supplemental material shall be sent directly to the copyright owner as specified in the copyright notice associated with the article.