
Abstract
Trade between Mauritius and China has been increasing at a rapid pace. As there are only few studies about Sino-Mauritian trade, there is therefore a need to study the determinants affecting trade flows between the two countries. This paper uses the “Gravity Model” with a sample data of 23 years (1997–2019) to analyze the trade between Mauritius and China. The results show that GDP’s growth rate, exchange rate, and FDI both have significant effects on Mauritian trade; however the former has a positive effect while the latter two has a negative one. The economic mass of the two countries have promoted trade, while an appreciation in Chinese currency and large amounts of direct investment have on the other side hindered Mauritian trade. A concrete trade agreement between the two sides can help in reducing the costs of trade between the two countries and improve the situation.
Introduction
Trade has been playing an important role in every country in the world. It is not only an important factor contributing to the development of a country but also a vital interaction between countries around the world. China, being one of the world’s fastest growing economies, owed its current place mostly through trade after the economic reforms and opening up in 1978. China’s impressive performance in economic growth can be associated to its increasing involvement in global trade and active trade policy (Maia, 2017).
China has trade partners all around the globe even in Africa. China’s trade with Africa has increased significantly in the past years. China’s preferential trade toward Africa and China’s foreign direct investment have a positive impact on the economic growth of African countries (Miao et al., 2020). Visits from the Chinese President, Foreign Minister, and Commerce Minister have played a certain role in the relationship between China and African countries and have also in certain ways favored for trade between them (Hu & Marrewijk, 2013; Lin et al., 2017).
Many scholars have studied about the trade relations between China and Africa. Sawhney and Kiran (2019) found that the economic scale and market size between South Africa and China positively affect the trade flows between them, while the real exchange rate has a negative impact. Fu et al. (2019) suggested that Africa’s trade opening and economic scale have a positive impact on bilateral trade exports, but China’s foreign direct investment has a limited impact on bilateral trade. Simbarashe and Leward (2018) showed that due to the different trade structures between China and South Africa, there is trade complementarity, so the bilateral trade flows between the two countries are highly integrated. Aboulezz (2016) have studied the factors that determine bilateral trade flows between South Africa and BRICs (Brazil, Russia, India, China) using the gravity model. Guillaumont Jeanneney and Hua (2015) focus their studies on the role of exchange rate in the growth of Chinese trade with Africa. Khosla (2015) studied the effects of Chinese influence in Africa on the intra-regional trade in the African continent. Hu and Marrewijk (2013) analyzed the role of trade policies in trade flows between Africa and China, and have emphasized the role that China’s preferential trade policies plays in promoting trade flows. Johnston et al. (2015) explored in their study the potential dynamics for China’s African export promise.
China in the recent years is trying to open up the African market, which also involves Mauritius being part of Africa. Since the establishment of diplomatic relations in 1972 between Mauritius and China, the economy, trade relations and the economic and technological cooperation of the two countries have seen favorable development. Since, trade between the two countries has increased at a rapid pace. Mauritius has a strong GDP of $14.04 billion and $11,099 GDP per capita in 2019 (UNCTAD database), however the country has found it hard to open up the big market which is China. According to the Mauritius Statistics, exports to China are just a poor 1.71% of total exports. But, import has taken 16.69% of total Mauritius’ imports. The gap between exports and imports has led to a great trade deficit.
Only few scholars have studied the trade relationship between Mauritius and China. Ancharaz and Tandrayen-Ragoobur (2013) is the first one to have studied the trade relationship between Mauritius and China; his study mainly examined the possible impacts of China’s impressive rise on the Mauritian economy through trade. However, to our knowledge, so far, there are no studies on the trade between Mauritius and China using empirical analysis. The main purpose of this paper is to analyze the different factors affecting Mauritian trade with China, and propose some solutions to improve the problems. Compare with previous studies, this paper uses an extended gravity model to analyze the effect of each factor to trade. The next section introduces the status of the trade between Mauritius and China and the main commodities that are traded. Section 3 introduces the method and data used in this study. Section 4 presents the model estimation results and discussion. Section 5 summaries and concludes.
The Development of Sino-Mauritian Trade
Trade Between Mauritius and China
The Mauritian economy has witnessed remarkable progress since the implementation of an ambitious economic and trade reform program. It is undeniable that the growth of Mauritian economy owes mainly to its focus on international trade. Since the trade reform, the international trade of Mauritius has increased. The country’s exports have increased by >40% in a period of 10 years, while imports have nearly doubled. Trade deficit has increased exponentially reaching a volume totaled 9.03 billion USD.
The main supplier of Mauritius is the Asian continent which accounted for 54% in 2019 compared to 48% in 2009. China is ranked first in Mauritian imports with an import volume reaching 0.84 billion USD dollars in 2019 which represented 16.69% of total Mauritian imports in 2019, and one third of Mauritian imports from Asia. In a period of 20 years, imports from China have seen an increase of 13.7% (see Figure 1).

Mauritius imports from China.
Compared to the volume of imports from China, the volume of Mauritian exports to China are relatively low. Although the volume of export to China have shown a yearly increase which has reached almost 32 million dollars in 2019 (see Figure 2), the volume of exports remains insignificant.
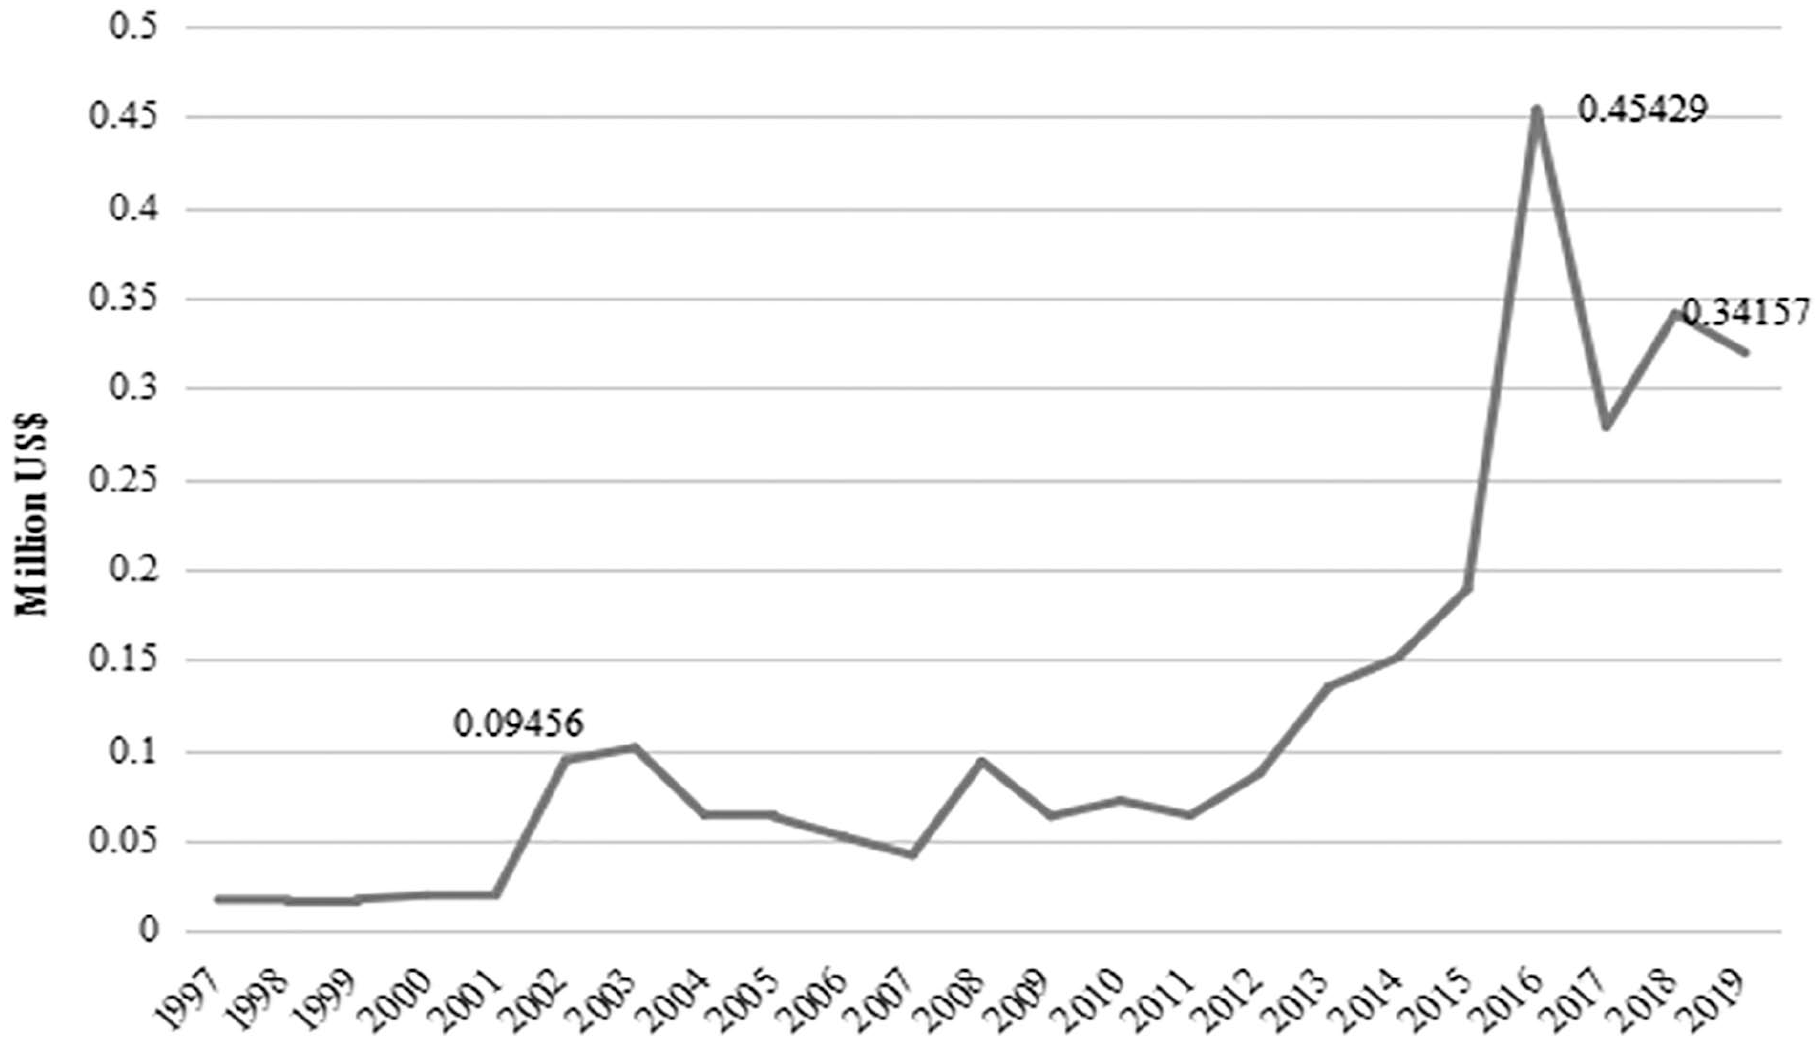
Mauritius exports to China.
It is undeniable that total exports of goods to China have largely increased the past two decades, but still the total export volume represented only about 16.17% of export to Asian countries in 2019 and small share of 2.0% of Mauritian total exports. Europe with its 47.76% in 2019 remained the main export market for Mauritian products.
Sino-Mauritian Trade by Commodities
China has evolved into one of Mauritius’ major import partners over the past two decades. Table 1 shows changes in the percentage of major commodities imported by Mauritius from China in the past 10 years. Based on the data obtained from UNcomtrade, Mauritius has mainly imported electrical machinery and equipment, nuclear reactors and mechanical appliances, and cotton from China. Electrical machinery and equipment (19.19%) owns a large share of the total goods imported from China, followed by nuclear reactors and mechanical appliances (14.47%) and cotton (7.98%). Altogether, China is currently considered as the largest supplier of manufactured products to Mauritius.
Main Commodities Imported From China.

Source. UNcomtrade.
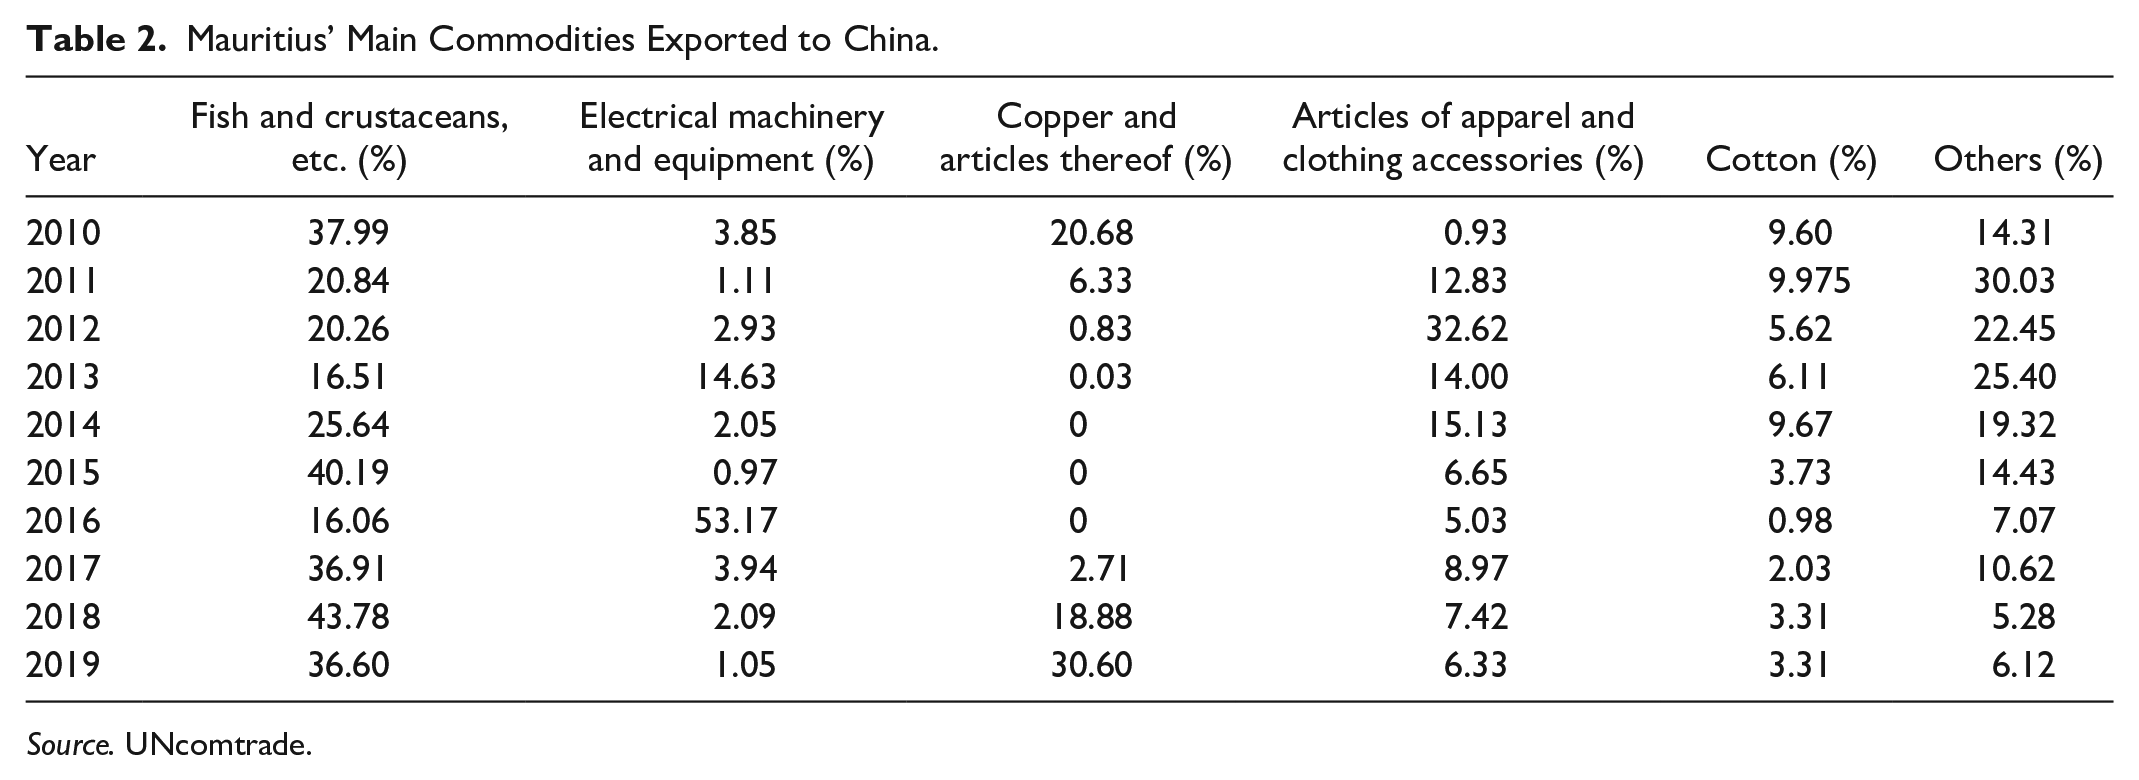
On the other side, the main goods exported to China are Mauritius abundant sea products. China’s imports from Mauritius consist mainly of fish and fish preparations which represent about 36.6% of total exports to China, and of manufactured products (see Table 2). Mauritius’ exports to China have therefore remained marginal for years. In addition, the data shows that the types of goods imported from China by Mauritius from 2010 to 2019 have not changed that much, however the proportion of copper products and copper-containing metal products, clothing supplies, clothing accessories and cotton in Mauritius’ exports to China has changed significantly.
Mauritius’ Main Commodities Exported to China.
Source. UNcomtrade.
Methodology and Data
Methodology
The gravity model used by many scholars has proved to be a reliable method to analyze trade patterns. The conception of the gravity model originates from Tinbergen (1962) who was inspired by the popular Newton’s law of universal gravitation. In Newton’s formula, the force of attraction between two objects is directly proportional to the product of their masses and inversely proportional to the squared distance between them. However, the gravity model used in international trade is slightly different. It estimates the economic attraction between two countries, as measured by the expected trade levels given their economic mass and the distance between them. GDP is the standard gage for economic mass, while the distance between country pairs is readily measurable. The basic model is as follows:

Where Fij represents the trade volume from i country to country j, Mi, and Mj represent the GDPs of country i and j respectively, Dij is the distance between the two countries, and η represents an error term with expectation equal to 1.
The traditional way to estimating this equation consists in putting logs at both sides, forming the following equation:
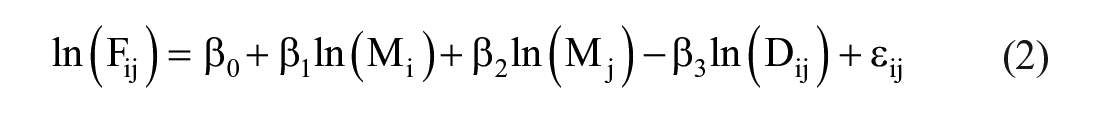
Equation (2) explains the relationship between trade, economic mass, and distance. The gravity equation in international trade has been considered as one of the most practical empirical finding in economics (Chaney, 2013). The trade between two countries is proportional to its economic size which is measured by GDP and inversely proportional to the distance between them (Wiese, 2014). However in real life, there are many other elements that affect trade such as tariff barriers, exchange rate, language, culture, trade agreements, transport costs, and so on. Therefore, there have been many different extended versions of the gravity equation which have been used to analyze the trade (Guan & Gong, 2015).
The gravity model has acquired a solid reputation of good fitting (Benedictis & Taglioni, 2011). Many scholars have acknowledged and used this model to identify factors of trade flows. Figueiredo and Lima (2020) used the model to prove that the economic integration agreement not only improves the level of trade, but also makes the relationship between the two countries more stable. Huang et al. (2020) selected GDP, geographic distance, national borders, railway freight volume, population growth rate and WTO to establish the gravity model of China’s export to five Central Asian countries. Umulisa (2020) used the gravity trade model to estimate the trade impact of the East African Community. Kinzius et al. (2019) investigated the impact of non-tariff barriers on imports based on structural gravity equations and global trade alert data. Santana-Gallego and Pérez-Rodríguez (2019) used the gravity model to study the impact of different exchange rate regimes on bilateral trade in a sample of 191 countries during 47 years (1970–2016). Borsky et al. (2018) added the variable “International Tropical Timber Agreement” to explore the impact of tropical timber trade on the basis of the traditional gravity equation. Hijazeen and Almuhaissen (2017) have incorporated the effects of exchange rate volatility to the gravity equation to analyze Jordan’s trade flows. Haggai (2016) used the traditional extended gravity model of international trade on a panel data covering 15 countries over a period of 15 years (2000–2014) to understand the Sino-Zambia trade relations. Doumbe and Belinga (2015) have used the gravity model to analyze the trade trend among Cameroon and 28 EU countries. Sejdini and Kraja (2014) have included the variables FTA and common border in their gravity model equation to analyze international trade in Albania.
With reference to previous researches made, this paper therefore includes variables relevant to the trade between Mauritius and China, to obtain the following extended gravity equation:

where i and j represent trading partners, country i is Mauritius and country j is China. Tradeijt represents total trade between country i and country j in year t; Yijt is the product of the GDP’s growth rate of country i and j in year. Popit and popjt represent the population of country i and country j in year t. Excijt is the relative currency exchange rate between country i and j in year t. FDIijt represents foreign direct investment from China to Mauritius in year t. α, β1, β2, β3, β4, β5 are constants and εijt is an error term.
Data
As mentioned in the previous part, there have been many variations of the trade gravity model. Basically, the gravity model for trade only takes into consideration the effect of economic mass and distance on trade. But many scholars have concluded that new variables can be incorporated in the original equation according to the situation. Therefore, we have chosen a list of variables that might have effects on the trade between Mauritius and China to design an econometric model. The variables chosen are:
Tradeij
Tradeij is the only dependent variable in this econometric model. Tradeij is the total trade value between Mauritius and China. It is calculated by adding the total import to total export between Mauritius and China. The data for both import and export were obtained from the UN Comtrade database. This paper uses the real value of trade, and was calculated by dividing the total trade value to the CPI of Mauritius (Xu & Deng, 2016). A larger amount means better trade relations between the two countries.
Yij
Yij is the product of GDP’s growth rates of Mauritius and China. In order to filter economic expansion, this paper uses GDP growth rate as a substitute variable for GDP. GDP is a typical variable used to represent economic mass. The larger the economy of a country, the more they trade (Wang et al., 2021). Therefore, it is estimated that GDP growth rate will have a positive effect on trade. The data for the GDP growth rate of Mauritius and China has been obtained from the database of the United Nations Conference on Trade and Development (UNCTAD statistic).
Popi, Popj
Popi represents the population of Mauritius, and Popj represents the population of China. This variable can be used to determine the size of the countries’ consumer market and also that of the labor market. The larger the consumer market the more trade occurs; therefore the size of the market has certain effects on trade (Ristanovic et al., 2017). It is estimated that population will have a positive effect on the trade. The data for population has been obtained through the World Bank database.
Excij
Excij represents the exchange rate between Mauritius and China. This paper uses the real exchange rate instead of the nominal one. Real exchange rate is calculated by the following formula:

where RER represents real exchange rate, NER is nominal exchange rate, CPIi and CPIj are CPI of Mauritius and China respectively. We determine the exchange rate by the Mauritius’ currency units per one unit of China’s currency (RMB). From Binh et al.’s (2011) study, we learn that an increase in the exchange rate means that country i’s currency is losing its value, more currency is needed to exchange to country j’s currency. In other words, an increase in exchange rate means that the Mauritian rupee is devaluating, more money should be used to exchange Chinese RMB, and imports will be more expensive. A depreciation of RMB promotes China’s export trade (Liu, 2020), which means that an appreciation of Chinese RMB will promote Chinese import and will hinder Mauritian import. Mauritius is a net importer, therefore exchange rate will have a negative impact on Mauritian trade. Nominal exchange rate and CPI of country i and j has been retrieved from UNCTAD database.
FDIi
FDIi is the direct investment from China to Mauritius. The real value of FDI is used. It is calculated by dividing FDI value obtained from the National Bureau of Statistics of China to that of CPI (Liu & Xie, 2018). From Haggai’s (2016) study, FDI has a positive influence on trade; it can act as a gateway for imports of products from China or export of products to China. Therefore a positive sign is expected.
Table 3 is a summarized version of the variables used in our model with expected signs.
Variables Used.

Regression Results and Discussion
Descriptive Statistics
From Table 4 it can be observed that the mean value of trade is 0.50 billion USD, the minimum value is 0.10 billion USD and maximum value is 0.94 billion USD. We can see that Mauritian trade with China has been developing at an outstanding pace. The product of both countries’ GDP growth rates is showing good figures with a mean of 10.37% and a maximum value of 38.40%, this means than the economic status of the countries are relatively good, and therefore countries with good economic status has positive effect on trade. The descriptive values of Mauritian population is smaller than that of Chinese one, fluctuation is relatively small, meaning that the size of both countries has not increase so much with time. The exchange rate’s minimum value is 2.54 and maximum value is 5.63, meaning that the Mauritian currency has decreased in value, more Mauritian rupees in needed to buy Chinese Yuan, and less Chinese Yuan is needed to buy Mauritian rupees. Mauritian export is therefore more competitive and import less competitive. This also have positive effect on Chinese import and negative effect on Chinese export. Foreign Direct Investment (FDI) have increased during the years with a maximum value of 1.49 and 0.07 as minimum value, the mean value is 0.65. FDI has increased and has reached a highest amount of 1.49 billion USD. This figure proves that there has been much Chinese investment in Mauritius. Investment has positive effects on trade as it can open up trade between the investing country and the host country.
Descriptive Statistics.

Stability Testing
Since the data used in the model is time series, and if direct regression is carried out, there is a possibility of “false regression,” in order to prevent “false regression,” a stability test is carried out on the variables, the ADF unit root test is used in this paper to examine the stability of each variables, the test results are shown in Table 5. Results show that the p-value of all variables is significant, therefore each variable is stable, further regression analysis can be proceeded.
ADF Test Results for Each Variable.

Correlation Analysis
A correlation analysis has been carried out (see Table 6). From the results, it is obvious that there might exist multicollinearity between the variables as some of the coefficients are greater than .5. In order to avoid multicollinearity the stepwise regression method analysis was conducted.
Correlation Analysis.

Significant at 1%. **Significant at 5%. ***Significant at 10%.
Regression Results and Discussion
Regression results
Regression tests were carried out using stata16. The gravity equation that has been designed with the variables in the previous section was run using the OLS (Ordinary Least Squares) method to examine the determinants of the trade between Mauritius and China. The stepwise regression method analysis was used to avoid multicollinearity. The data that were used are from 1997 to 2019. The regression results are shown in the Table 7.
Regression Results.

Significant at 1%.
From the model 1, it can be observed that all the variables were significant. GDP’s growth rate has a positive effect on trade. Mauritius’ population has a negative impact on trade. Chinese population on the other side has a positive impact but was not significant. Exchange rate has a negative impact on trade as it shown a negative sign. FDI on the other hand has shown a negative figure.
The VIF values for lnPopi and lnPopj were all higher than 10, meaning that there exist multicollinearity problems (Bager, 2018; Shimu & Islam, 2018). These variables were removed and another regression test was carried out using the remaining variables to obtain Model 2 (see Table 7). GDP, EXC, and FDI were both significant at 1%. The VIF values of the variable in Model 2 were all smaller than 5, meaning that there is no multicollinearity.
The DW test was also carried and the value 2.17 was obtained. The sample size is 23 with three explanatory variables. At significance level of 1%, critical values dL is 0.858 and dU is 1.407 respectively. The model does not exist autocorrelation as the DW result is between 0.858 and 2.59 (4–1.407). The model has therefore a good fit. According to the regression results, and to the regression coefficient, we get the following equation of our gravity model:

In the end, only GDP growth rate, exchange rate and FDI were left in our final equation. These variables were all significant, but affect trade differently. The coefficient of GDP growth rate is 1.04, which means that an increase of 1% in the product of Mauritian and Chinese GDP growth rate will increase trade by 1.04%. Therefore, the effect of GDP’s growth rate is consistent with our hypothesis. Exchange rate on the other side has a negative effect on trade; the result shows −0.03 as its coefficient, meaning that an increase of 1% in exchange rate will diminish trade by 0.03%. It is also in line with our estimation. FDI is not positively affecting Mauritius’ imports and exports which is not as expected. The result shows −0.15 as its coefficient, meaning that an increase of 1% in FDI will diminish trade by 0.15%.
Discussion
The analysis has revealed that the relations between the two countries have been growing at rapid pace. The amount of trade has been growing exponentially in 23 years’ time, investments from China has as well increased. The variables used for trade analysis such as GDP’s growth rate, FDI, and exchange rate really affect trade relations, the former in a positive way and the latter two in a negative way. Mauritius has been importing more and exporting less. The main reason for this phenomenon is that Mauritius being an island, has few resources other than sea products to offer to China, therefore exports to China are not that obvious. The empirical result that was obtained indicates that the product of GDP positively significantly determines Mauritius’ trade with China while exchange rate and FDI negatively significantly determines Mauritius trade. The results that have been obtained is in line with the basic hypothesis of the gravity model that the economic growth size of the respective countries (denoted as GDPi × GDPj) exerts a positive impact on the trade between Mauritius and China. The growth of GDP does not only reflect the production capacity of a country but also the consumption and export ability of countries. Since 2009 to 2019, Mauritius’ GDP has increased by 40%, while bilateral trade volume has nearly doubled. The impact of FDI is different from expected, indicating that Mauritius’s small energy supply, lack of skilled labor, and weak supporting infrastructure have reduced the efficiency of investment and increased the transaction costs of bilateral trade. The effect of exchange rate on trade is in line with our expectations. Chinese currency has gained value, therefore, Mauritius, as a net importer, will need more currency to import from China (Li et al., 2015). The appreciation in Chinese currency has affected Mauritian imports from China and its negative impacts explain the decrease in imports in 2015, which in turn affects the total trade value of Mauritius. In summary, the results indicate that goods produced in both Mauritius and China are able to sustain the level of consumption in both countries and also is exported to markets in the respective countries.
Limitation of Study
This paper uses the trade gravity model to explore the influencing factors between Mauritius and China’s economic and trade exchanges. The trade gravity model has strong explanatory power on the issue of the influencing factors of bilateral trade flows and has achieved great success in many aspects. Most studies show that, no matter from the perspective of trade as a whole or only from the industry level, the economic scale (GDP), population and institutional arrangements of trading partners are all significant influencing factors, and the role of economic aggregate is of particular significance (Dunford et al., 2020; Huang et al., 2019). However, the biggest shortcoming of the gravity model lies in its empirical nature. It makes empirical judgments based on existing data. When applying its conclusions to predict trade development in a certain region, the conclusions are not convincing, but the gravity model provides a perspective and ideas for analyzing trade issues (Wang & Zhou, 2019; Yang et al., 2019). In addition, when selecting influencing factors as variables, we have not considered the impact of the China-Mauritius bilateral trade agreement in the gravity model as its effective date is not within the study time limit. In reality, the China-Mauritius trade agreement will have a profound impact on bilateral trade, which requires future in-depth analysis.
Conclusion
In trying to understand the trade relationship between China and Mauritius, this paper uses the gravity model of international trade over a period of 23 years from 1997 to 2019 using time series. The results show that GDP growth rate, exchange rate, and FDI have significant effects on Mauritian trade; however they have different effects on Mauritian trade. The former has a positive effect while the latter two has a negative effect. The economic mass of the two countries promoted trade, while an appreciation in Chinese currency and large amounts of direct investment during the years has on the other side hindered Mauritian trade.
Trade between Mauritius and China has improved a lot and will achieve greater development. China and Mauritius signed a free trade agreement in October 2019, and the agreement will take effect in January 2021 (Chang et al., 2020). The content of the agreement includes trade in goods and services, investment and economic cooperation. Mauritius is expected to received duty-free access to various Chinese products, allow Mauritius nationals to start business in China, and both will benefit of zero tariffs on >90% of goods traded. China has also agreed to export sugar from Mauritius. This trade agreement will help reduce trade costs and further deepen the economic cooperation between the two countries in various fields. The government of the two countries can set up more policies such as removing restrictions on some other sectors that will attract more mutual investment, restrictions on some other traded items, and supplements to the current effective FTA that can further boost the trade relations. Mauritius with a relatively stable economy can help China in further opening up the African market, therefore acting as a bridge between China and Africa.
Footnotes
Author’s Note
Zhijie Guan is now affiliated with Changzhou University Huaide College, P. R. China.
Author Contributions
This paper is a joint work of the three authors.
Declaration of Conflicting Interests
The author(s) declared no potential conflicts of interest with respect to the research, authorship, and/or publication of this article.
Funding
The author(s) received no financial support for the research, authorship, and/or publication of this article.