
Abstract
Recent investigations into China–U.S. trade relations have revealed that intellectual property plays an increasingly important role. A vector auto-regression model (VAR model) was established in this study to depict the relation among intellectual property protection, intellectual property trade barriers, and China–U.S. trade. Furthermore, Granger causality was utilized to formulate how intellectual property affects China–U.S. trade relations. As demonstrated by the relevant results, on one hand, intellectual property protection influences China–U.S. trade relations through the China–U.S. trade structure. On the other hand, China–U.S. trade relations may act on the intellectual property trade barrier for the same reason.
Introduction
Intellectual property has always been an issue that has troubled China–U.S. relations. In January 1979, the China–U.S. High-Energy Physics Cooperation was established. For the first time, the United States put forward intellectual property rights with the Chinese during the negotiations and defined copyright protection obligations as a principal clause between both sides. Since then, a large number of fundamental intellectual property agreements were concluded, facilitating the preliminary establishment of an intellectual property cooperative exchange mechanism between China and America.
However, the rapid economic growth in China has created a major conflict of national interests between China and America, and their intellectual property relations have become increasingly tense. On one hand, technological innovation accompanied by the steady strengthening of intellectual property protection (IPR) is being carried out in China to improve its comprehensive national power. From 1995 to 2017, the number of patents in China for inventions increased nearly 60-fold, from more than 20,000 to more than 1.3 million China. In contrast, American national interests are expected to be safeguarded by building an intellectual property trade barrier through Section 337 and Section 301 Investigations. As indicated by a 2004 survey of members of AmCham China, not only do 90% of the companies believe that the intellectual property protection measures taken by the Chinese government are invalid, but more than 75% of its members consider that their intellectual property rights are being infringed (Buckley, 2004). In addition, according to statistics by the Chinese Ministry of Commerce, since 2005, the influence of the intellectual property trade barrier on China has gone beyond that of anti-dumping, involving 100 major categories of goods and causing an economic loss of more than US$200 billion. From 2002, annually, more than 30% of the Section 337 Investigations by America related to enterprises in Mainland China. This proportion reached 58.33%, 50%, and 57.14%, respectively, during 2007, 2009, and 2010. For 13 consecutive years, China acted as a country that suffered the most from American intellectual property trade barrier implemented through Section 337 Investigations. Concerning the 215 related cases, a number of involved Chinese companies are identified as the existence of infringement and, thus, subject to tough sanctions such as a general exclusion order, a limited exclusion order, and a cease and desist order. 1 The research of Chiang (2004) found that anti-infringement investigations targeted at China are more frequently carried out in industries facing intense import competition in America. Clearly, the Section 337 Investigation is a common mechanism utilized by American enterprises to hamper foreign companies having the most direct competition relationship.
Since 2017, China–U.S. trade relations have been even more strained as the new American government assumed power. Zhengrui (2017) opined that the interdependence between America and China is asymmetric; in line with the current situation, China has more dependence on America, enabling America to gain greater “power” in China–U.S. trade and act as the party that applies pressure when dealing passively with China. On March 22, 2018, the Trump administration declared that US$50 billion in customs duties should be placed on Chinese commodities for intellectual property infringement, together with the implementation of restrictions on investments. Although China robustly opposed, a China–U.S. trade war still occurred. In detail, in 2018, additional tariffs on imported goods were collected for three rounds between both countries.
From these truths, we summarize that the current American government has originated a series of investigations on the grounds of intellectual property protection to build a trade barrier with China. Shen Guo-Bing (2010) has proven that these investigations may diminish as the China–U.S. agreement on intellectual property generates more positive effects. However, regarding the interplay among the intellectual property trade barrier of America, China–U.S. trade, and intellectual property protection in China, no complete framework has been presented in the existing literature. Therefore, this study focuses on the relationship formed by Chinese intellectual property protection, the intellectual property trade barrier established by America, and China–U.S. trade.
Literature Review
Intellectual property is the right generated from both creative achievements and marks made by industry and commerce according to the law. Protecting intellectual property indicates a critical link between development and innovation. Since the 1990s, the research on intellectual property protection has made some preliminary achievements. All relevant studies have attached importance to two major aspects. One is how to make intellectual property protection indexes complete and practical. The other is related to how the degree of intellectual property protection influences technological innovation and economic growth. Regarding the relationship among intellectual property protection, the intellectual property trade barrier, and China–U.S. trade, a relevant literature review can be completed from three aspects: the status situation of intellectual property protection in China, the influence of the intellectual property trade barrier established by America, and the relationship between intellectual property protection and foreign trade.
For the status of intellectual property protection in China, various studies have been conducted that focused on Chinese intellectual property indexes. Using quantitative evaluations by Ginarte and Park (1997) on patent protection levels in 110 countries from 1960 to 1990, W. Li and Yu (2014) set the intensity of Chinese intellectual property protection based on legislative protection and law enforcement for intellectual protection and took advantage of the measured data from 1985 to 2010 for the relevant calculations. As indicated by the results, the index of the intensity of Chinese intellectual property protection increased from 1.156 to 2.980 during the 25 years. Zhan Ying (2013) acquired the actual intellectual property protection levels for 122 countries and regions by performing quantitative measurements specific to the legislative intellectual property protection levels and constructed an intellectual property law enforcement index. In conformity with his findings, the legislative protection of Chinese intellectual property has been significantly improved in the recent 20 years. However, Chinese intellectual property law enforcement efforts are dramatically lower than those of developed countries and even fail to reach the world’s average level. Consequently, the practical Chinese intellectual property protection level is also far lower than that of developed countries and slightly lower than the world average. China: Intellectual Property Infringement, Indigenous Innovation Policies, and Frameworks for Measuring the Effects on the U.S. Economy, issued by the United States International Trade Commission (ITC) in 2010, pointed out that “enforcement of IPR laws remains a serious problem in China; and ineffective enforcement contributes to widespread IPR infringement in China.” Clearly, although Chinese intellectual property protection is being unceasingly enhanced, it still has a considerably long way to catch up with that in developed countries.
Regarding research on the current situation of intellectual property trade barriers built by America, the details of trade investigations carried out in the country are discussed in most cases. He Xingqiang (2008) analyzed the reasons why America has built an intellectual property trade barrier since 2004 and then proposed the viewpoint that China–U.S. trade disputes occur as driven by intellectual property business groups in America under the background in which the American government intensifies intellectual property protection. Liao Li (2015) deemed that law enforcement efforts in intellectual property continue to increase unilaterally, bi-literally, and regionally in America. For example, law enforcement criteria for intellectual property stipulated in the Trans-Pacific Partnership Agreement (TPP) are enormously more rigorous than the standards provided in the Agreement on Trade-Related Aspects of Intellectual Property Rights (TRIPS). In addition, Cui Riming (2007) systematically summarized the causes of China–U.S. trade friction in moving toward intellectual property protection. He considered that America turn to novel means, such as the Section 337 Investigation, in the circumstance that conventional trade remedy measures such as anti-dumping no longer satisfy the need to suppress products “Made in China.” By virtue of such new means with certain required characteristics, America is able to more effectively suppress Chinese products and enterprises. Moreover, studies by Xu Yuan (2011) found that the intellectual property barrier, with the feature of fierce market aggressiveness, mostly takes form with enterprises as its subjects in new and high-tech fields. Despite non-uniform judging standards, unbalanced settings among various countries and the absence of institutional constraints create a rather solid legal foundation and a higher level of concealment.
Numerous related studies exist on the relationship between intellectual property protection and foreign trade. In the field of exports, Liang Hongying and Yu Jinsong (2010) explored the influence of intellectual property protection on China’s exports. Relevant findings indicate that intensifying intellectual property protection exerts a significantly positive effect on the gross volume and structure of exports. Guo and Wu (2014) theoretically analyzed the influence of intellectual property protection on exports of creative products and empirically analyzed using 2006–2010 panel data on creative product exports of America. Intellectual property protection enhancement in an importing country was proven to be conducive to creative product exports, and such a positive effect is still rather significant in the context of imitating threatening situations. Regarding Yu Daoxian and Liu Haiyun (2008), statistical data from 1993–2006 are utilized to empirically verify that the number of domestic and foreign patents granted can affect China’s export trade in different ways. This result also indicates that the technological innovation of a foreign country strongly promotes the export trade progress of China. In the field of imports, Awokuse and Yin (2010) probed how stricter intellectual property laws in China affect bilateral trade flows. According to their findings, enhancing intellectual property protection drives China’s imports, especially the import of knowledge-intensive products. Based on the overall and the subdivided Chinese import data from 1991 to 2005, Yu Changlin (2011) deemed that, on one hand, intensifying intellectual property protection can affect import trade in a country depending on two reverse effects of market expansion and market power. On the other hand, the net effect of intellectual property protection enhancement depends on the tradeoff between market expansion and market power. The investigations previously discussed indicate that intellectual property protection enhancement is capable of facilitating a country’s import and export trade growth through diverse mechanisms. As described by Brander (2007), intellectual property protection can be regarded as a “strategic trade policy”; that is, intellectual property may affect international trade flows once protected commodities cross national borders. Increasingly greater importance has been attached to intellectual property, given that the proportion occupied by knowledge-intensive or high-tech products in international trade has doubled (increasing from 12% in 1980 to 24% in 1994). Gould and Gruben (1996) proposed through their studies on transnational data associated with patent protection, trade system, and national characteristics that intellectual property protection functions as a decisive factor for economic growth. According to a similar conclusion drawn through empirical research by Thompson and Rushing (1999), if a country’s per capita GDP reaches US$3,400 (in 1980) and higher, intensive intellectual property protection plays a role in accelerating its economic growth.
Concerning all existing research, the study on the relationship among intellectual property protection, intellectual property trade barriers, and China–U.S. trade has massive theoretical foundations. However, their synthetic relation has yet to be exhibited through a holistic view, leaving us a research gap. For this reason, this article intends to explore their internal visual connections and vest some traditional statistics with new economic importance.
Modeling and Data Sources
The vector auto-regression model (VAR model) is a commonly used econometric model raised by Christopher Sims in 1980. Each endogenous variable in this model serves as a function of the lagged values of all endogenous variables in this system. The most obvious feature of this model is that it has the capability to estimate a dynamic relation of joint endogenous variables on the premise of no prior constraints. Moreover, it can reflect the influence of a change in a variable on other variables by virtue of an impulse response function. In this article, the VAR model was selected for the following reasons. First, intellectual property protection has a hysteretic nature to a certain extent. After China’s entry into the World Trade Organization in 2002, as put forward by Shen Guo-Bing (2006), China made stronger efforts to protect American intellectual property. However, American copyright business losses suffered were not alleviated until 2004, which can be explained as a delay in intellectual property protection. Second, separating intellectual property protection, intellectual property trade barriers, and China–U.S. trade were less likely to be separated from one another because no definite constraints are present, and the VAR model emphasizes analyzing the effect of a single variable on the overall model, instead of analyzing an individual variable. Therefore, the VAR model is more aligned with the argument demands of this study.
The VAR(p) Model 1 containing k variables is expressed as follows:

where Yt is a vector of k-dimensional endogenous variables, p represents the lag intervals for endogenous, T represents the number of samples, A1, . . ., Ap form a k×k dimensional coefficient matrix, εt~N(0, ∑) refers to k-dimensional perturbation vectors that are contemporaneously correlated while independent of their own lagged values, and ∑ is a covariance matrix of εt, which is also a k×k dimensional orthogonal matrix.
Building such a VAR model based on rigorous economic theories is not needed. Only two variables should be defined during modeling. One is the number of variables associated, denoted by k, indicating the total quantity of mutually related variables, and these variables should be incorporated into the VAR model. The other variable is p, which represents the maximum lag intervals for endogenous auto-regression; a proper value of p can be determined such that the model can reveal the mutual effects of variables and make its random error term to be white noise. Regarding the VAR model, if the p of an explanatory variable is excessively low, residual errors may be autocorrelated, resulting in parameter estimation inconsistencies. In contrast, an overly large value of p leads to a large number of parameters to be estimated and a dramatic decline in the degrees of freedom, which directly affects the validity of the model parameter estimation.
The dependent variables incorporated into the VAR model should be correlated. Granger causality tests should determine whether or not the variables are correlated with each other. According to the principle of the Granger causality test, two given time series, X and Y, and all of their historical data that conform to a stationary random process are utilized to predict Y. If the predictive result is superior to that obtained for Y merely based on its historical data, that is, if X is beneficial for a prediction accuracy improvement in Y, Granger causality is determined to exist between X and Y.
From the existing literature, we select China’s intellectual property protection strength (IPPS) from 1995 to 2016, as acquired by W. Li and Yu (2014) as a representative value of intellectual property protection. The following formula is used to compute this value:

where P(t) represents the IPPS of China in year t, L(t) represents its intellectual property legislative protection strength in the same year, and E(t) represents its intellectual property law enforcement protection strength in the same year, which ranges between 0 and 1. More specifically, 0 indicates that no applicable clauses to intellectual property stipulated have been executed, and 1 signifies that all of these clauses have been fully enforced.
For the representative value of the intellectual property trade barrier, we choose the number of Section 337 Investigations involving Chinese intellectual property (IV), which was selected from the Section 337 Investigation Database of the China Trade Remedies Information Online. Considering that recent studies are extremely sensitive to the Section 337 Investigation, the Section 337 Investigation can be said to play a representative part in China–U.S. trade relations and intellectual property trade barrier-building by America. Data on China–U.S. trade and the China–U.S. balance of trade (BT) recorded in the China Statistical Yearbook over the years were adopted as the main observed values.
To reduce the heteroskedasticity of the data and data fluctuations to the greatest extent, logarithms were taken for IPPS and BT, respectively, denoted as LNIPPS and LNBT. On one hand, no logarithms are taken for the data obtained from the Section 337 Investigation because the size of the data set is rather small and the data are independent of wild fluctuations. On the other hand, a value of zero is generated if the logarithm is taken, which prejudices subsequent regressive analyses.
Empirical Test
Before the empirical test, based on the data estimation, the lag intervals for the endogeneity of this model was assumed to be two. The preliminary model structure is shown as follows; for details, please refer to Model 2:
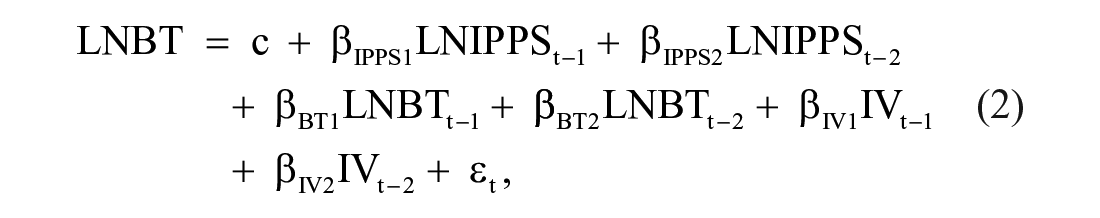
where t is a subscript representing time (t =1, 2, …, 22); the representative sample period ranges from 1995 to 2016; εt is a random disturbance; and β stands for the dynamic relations of joint endogenous variables.
To ensure a stationary VAR model regression, the Augmented Dickey-Fuller (ADF) unit root test was first carried out, during which the lag intervals for endogeneity was automatically selected using the Schwarz Information Criterion (SIC). Considering that all of the data selected for this study are dynamic numerical values, building a model directly based on such three variables is unreasonable. For this reason, first-order differences of LNIPPS, LNBT, and IV were further calculated here and denoted by DLNIPPS, DLNBT, and DIV, respectively. Please see Table 1 for the relevant outcomes.
The Augmented Dickey-Fuller (ADF) Unit Root Test Result.
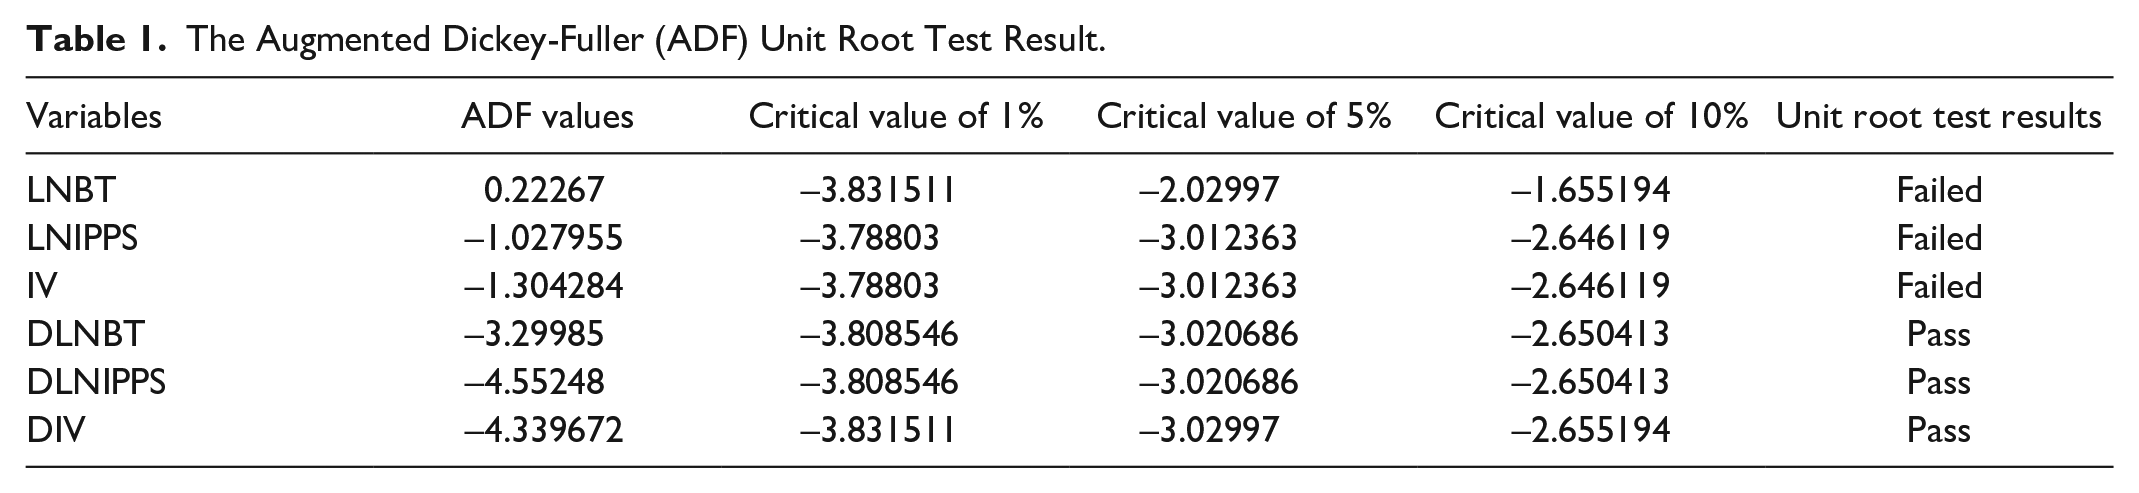
The ADF test has demonstrated that, after the data go through first difference and second difference processing, DLNBT is significant at the 5% level (the critical value), whereas the remaining variables are significant at the 1% level (the critical value). These findings explain that the data subjected to difference processing are a stationary series, and based on this reasoning, Model 3 is constructed.

Subsequently, a co-integration test was conducted. Given the co-integration relationship among the three variables to be tested, the Johansen and Juselius (JJ) maximum likelihood principle was selected. To perform the JJ co-integration tests for LNIV, LNIPPS, and LNBT, the lag intervals for endogeneity was selected as two. Table 2 presents the relevant results.
The Co-Integration Test Result.

The test results in Table 2 reject the null hypothesis that two of LNIV, LNIPPS, and LNBT form a co-integration relation at the maximum. In this case, co-integration tests for LNIV, LNIPPS, and LNBT are tenable, and Model 3, which adopts LNIV, LNIPPS, and LNBT as raw data, is also established effectively. Moreover, considering that the stability of the VAR model may affect the resulting judgment, the AR characteristic root approach is used to test it. As indicated in Figure 1, all characteristic roots fall into the range of a unit circle. Therefore, the model is deemed to be stationary.

The AR Characteristic Root Test Result.
After the stationarity of the VAR model has been tested, the assumption that p is a second-order value is tested to be tenable or not. Here, the Akaike information criterion (AIC) and the Schwarz (SC) criterion were utilized to define the value of p. The method and principle for determining the p value is to minimize AIC and SC at the same time during the process of increasing the p value. Generally, it is tested from Order 1 to Order 4. Moreover, the eviews8.0 software package was also employed to construct a VAR model with the lag intervals for endogeneity ranging between 1 and 4 based on DLNBT, DLNIPPS, and DIV, respectively. In this manner, the AIC and SC values were explored under the circumstance that DLNBT serves as an explained variable. Table 3 presents the relevant results.
The Determination of the Value of p.

Note. AIC = Akaike information criterion; SC = Schwarz criterion.
The Final VAR Model.
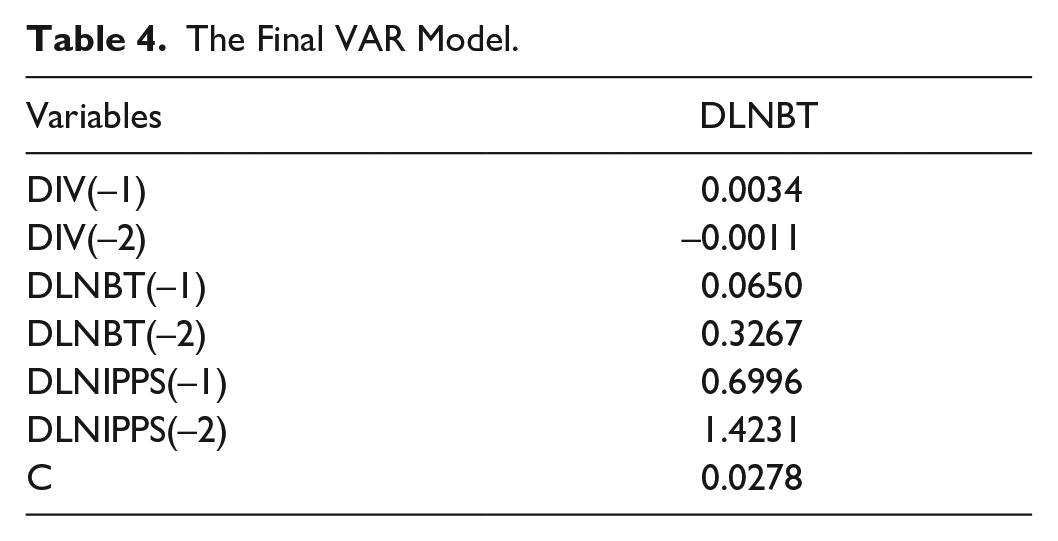
In conformity with the results, the values of AIC and SC are minimized when the lag intervals for endogeneity are two. Hence, the assumption that two lag intervals for endogeneity exist in this article is tenable and, based on which, the VAR model can be expressed as follows.
In Figure 2, an increase-decrease-increase fluctuation appears from Orders 1 to 4 when DLNBT responds to DLNIPPS and, subsequent to which, it remains stationary. The reason is that because the strength of Chinese intellectual property protection increases in the short term, China may exert certain technological restrictions over imports from America or possess certain technological superiorities in exports to America, such that America inevitably takes measures to safeguard imports and exports in the long run to prevent the occurrence of dumping, among others. The response of DLNBT to DIV slightly declines in Orders 1 to 2 and then tends to be stationary. Such a phenomenon illustrates that the intellectual property trade barrier established by America has a direct influence on China–U.S. trade. In view of the American economic strength, it has the ability to control the level of China–U.S. trade to a certain degree through trade investigations and additional tariffs. Furthermore, such a conclusion conforms to the process of the 2018 China–U.S. trade war.
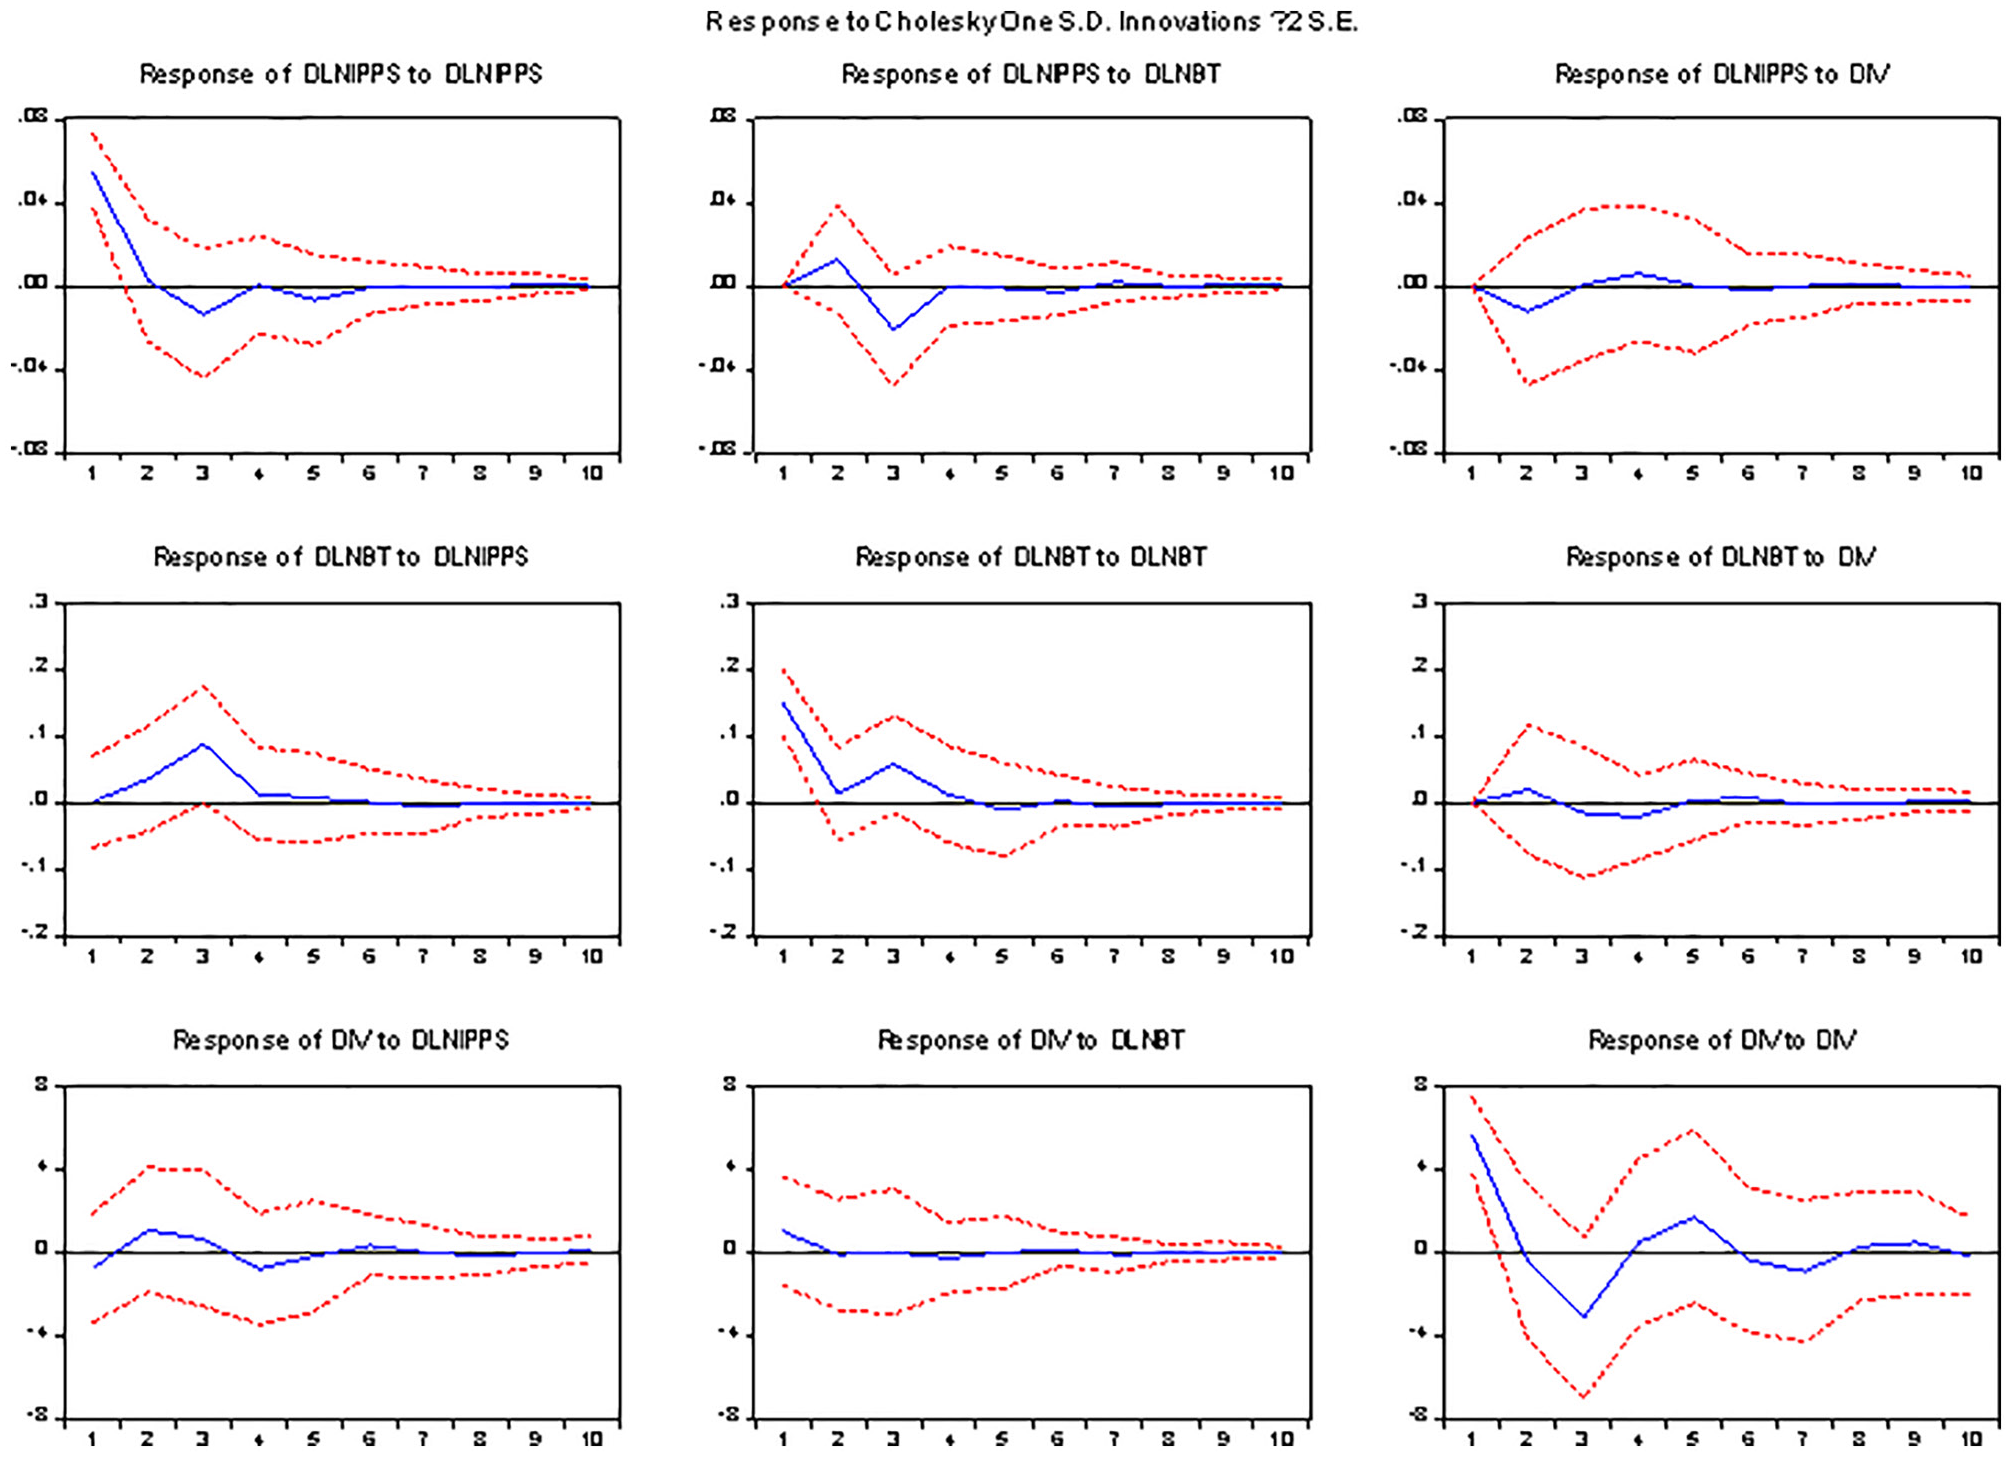
Impulse Response Analysis.
Nine types of interplay listed in Figure 2 were also observed to eventually be inclined to be stationary, indicating that impulse response functions based on the VAR model have their own significance. In addition, when one variable changes, the other variable should be adjusted through a mechanism during a certain period to again ensure their coordination.
Finally, Granger causality tests were performed for lag intervals of 1 to 3 years using eviews8.0. The test results are presented in Table 5.
Granger Causality Tests Results.
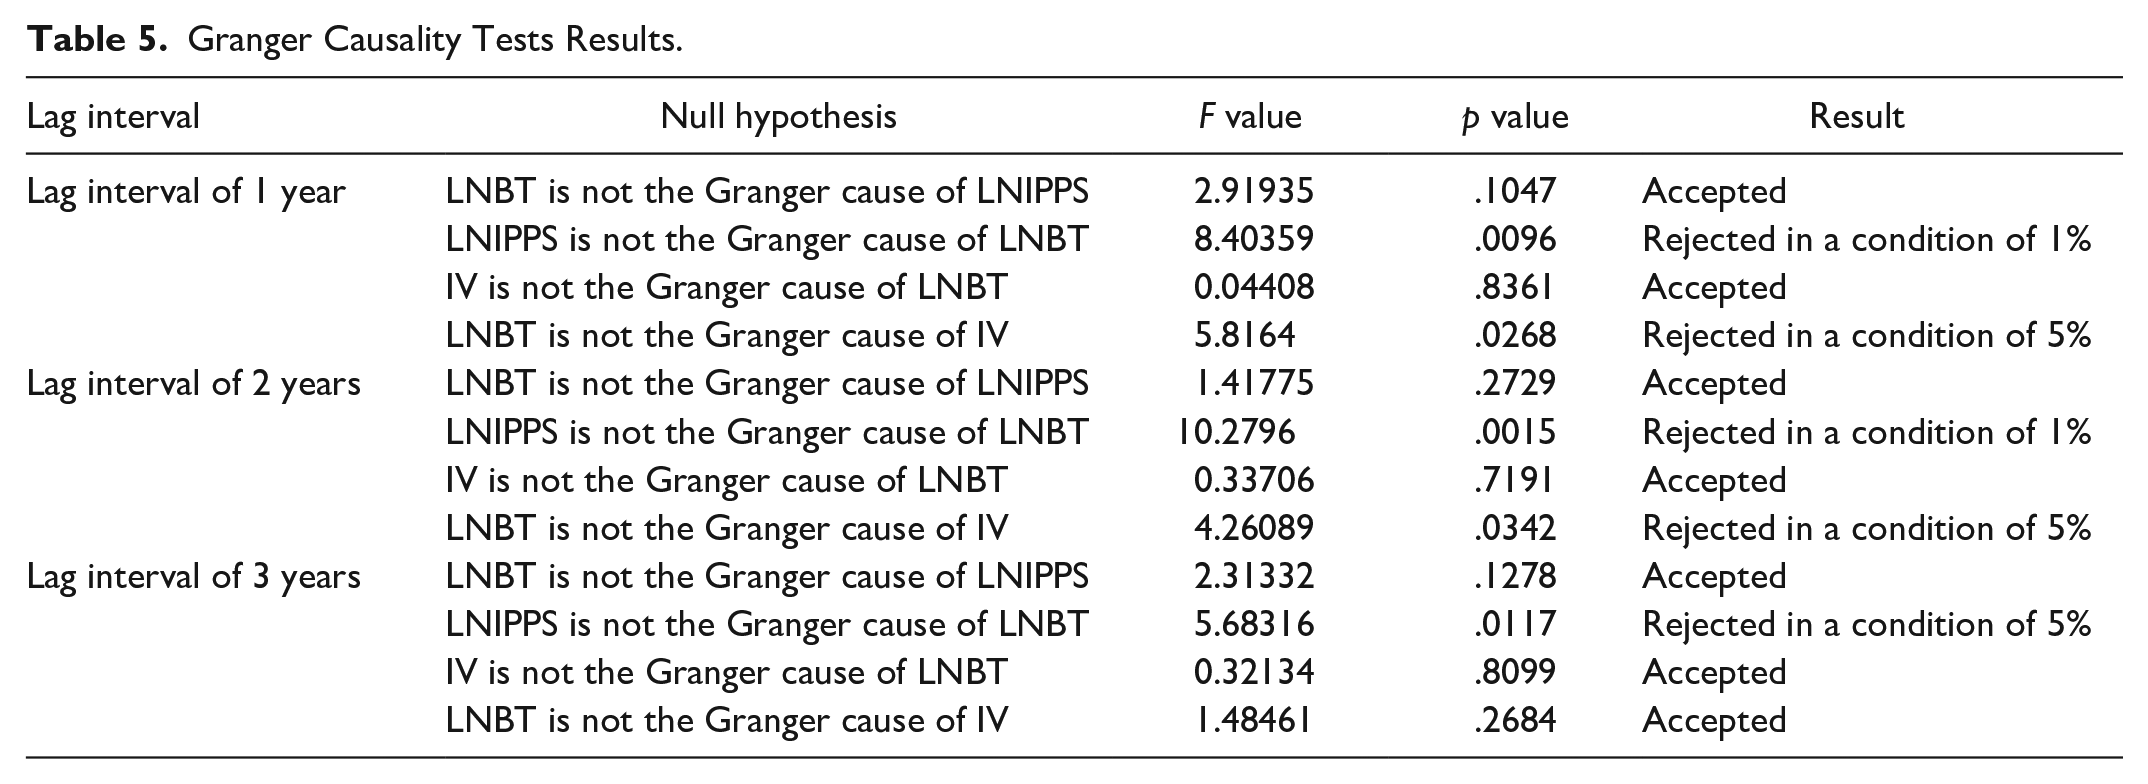
As manifested by the Granger causality test, LNBT is not the Granger cause of LNIPPS and IV is not the Granger cause of LBNT during 1- to 3-year lag intervals. However, LNIPPS and LNBT serve as Granger causes of LNBT and IV, respectively, during 1- to 2-year lag intervals.
Summary
In this article, a VAR model was built to clearly reflect the relationship among intellectual property protection, intellectual property trade barriers, and China–U.S. trade: China–U.S. trade changes under the influence of the past acts of all three, which can be used as an essential reference for the intellectual property–trade relation prediction and the decision making between China and America. The Granger causality tests indicated that the strength of Chinese intellectual property protection is the Granger causality for the China–U.S. balance of trade and that the China–U.S. balance of trade is the Granger cause of the number of Section 337 Investigations concerned with Chinese intellectual property.
The China–U.S. trade structure may result in the fact that the strength of Chinese intellectual property protection is the Granger cause of the China–U.S. trade balance. On one hand, Chinese enterprises lack core competitiveness. Enhancing Chinese intellectual property protection is beneficial to China’s improvement in enterprise innovation ability to increase corporate exports. By probing the enterprise data released by the World Bank, Yin Zhifeng et al. (2013) concluded that enhancing intellectual property protection strength can elevate the enterprise innovation output of the host country by increasing enterprise R&D investments. In addition, Li Chuntao et al. (2015) conducted a survey of the micro-data of transnational companies. Based on his findings, favorable intellectual property protection can accelerate corporate investments in innovation. In contrast, America is unwilling to expand China-oriented high-tech products because of trade control and a blockade on techniques. Intellectual property is viewed as the strategic resource and core competitiveness in the ascendant of America, a great power in the areas of the economy, science, and technology. Therefore, effective intellectual property protection becomes the key to guaranteeing economic and technological progress. For this reason, China maintains its technology trade deficit with America and such a deficit shows an annually progressive increasing tendency during the past 10 years. In December 2010, American exports to China reached US$10.12 billion, with technology imports of US$5.75 billion, representing only 56.8% of this total. As a leading technology country, America exports new and hi-tech products to China; however, the proportion of such products was only 22.4% of the 2010 global total. Apparently, the United States does not have the most technology exports to China, which contradicts its leading position in technology. To break through American technical restrictions, China needs to improve its self-innovation capability, which depends on the steady strengthening of Chinese intellectual property protection.
The China–U.S. balance of trade is the Granger cause of the Section 337 Investigation count involving Chinese intellectual property. Such a fact signifies that the former may exert influence on the intellectual property trade barrier built by America, which is also closely associated with the present China–U.S. trade structure. From the viewpoint of Yu Lefen (2011), the reasons that China runs into the intellectual property trade barrier include trade protectionism, trade friction intensification, and novel advantages of the intellectual property barrier. According to Zheng Minghui et al. (2013), China encounters the intellectual property barrier primarily because trade protectionism caused by an economic recession in America is on the rise. Furthermore, the research findings of Ferrantino (1993) provided that if the country’s intellectual property protection is strong enough, a number of intellectual property treaty members may promote venue-expenditure flows in international fields. Without a doubt, the Section 337 Investigation is one of the major approaches to building intellectual property trade barriers, which reflects America’s attitude and policy on China–U.S. trade to a great extent.
The VAR model in its entirety shows that, when America as the largest developed country throughout the world strengthens its intellectual property trade barrier, China—the world’s largest developing country representing the interests of another group—should enhance its intellectual property protection, persistently make progress in its intellectual property undertakings, and improve its comprehensive intellectual property strength to catch up with America in the area of intellectual property power. The model also shows that the China–U.S. trade balance may suffer relevant impacts and again achieve balance through long-term adjustments. In such an imbalance, immeasurable economic losses together with a series of unnecessary troubles and conflicts may be incurred on both China and America. One country is in a critical period of reform and opening and the other is in a leading global position.
Brander et al. (2017) presented that China should establish legality by fulfilling its current commitment to international intellectual property to play a leading role in its reform. For China, the core competitiveness of Chinese products should be improved by enhancing the country’s product innovation capability, developing core technologies, and forging products “Made in China” into those “Created in China.” In addition, legislative protection and law enforcement for intellectual property should be perfected to address and safeguard against trade attacks, such as the Section 337 Investigation of America. Regarding America, building an intellectual property trade barrier is indeed a territory-protecting approach from commanding heights of the world. The presently leading global position of America determines that it should impose certain suppressions over other countries in certain sectors while seeking development. In addition, both countries’ intellectual property relationship and its negative influence on China–U.S. trade should be taken into reasonable consideration at the time that the intellectual property trade barrier is built to pursue joint development for mutual benefit in a win–win situation.
In summary, in current international relations, America can enact game regulations to a certain extent, whereas China, as a developing country, cannot do anything but accept them passively. Nevertheless, if China enhances its power and the strength of its intellectual property protection subjected to game regulations formulated by America, the original game regulations may turn into China’s rights. Then, China could take the initiative in some aspects of China–U.S. trade and start the game with America. In such a context, America would likely change its game regulations and perform more investigations to restrict China’s development. Accordingly, on this basis, the number of Section 337 Investigations climbs. Regardless of how the game regulations change, the Chinese intellectual property industry should never lag behind the global competition, and this can be avoided through cooperation among multiple parties and the steady improvement of the strength of Chinese intellectual property protection.
Footnotes
Declaration of Conflicting Interests
The author(s) declared no potential conflicts of interest with respect to the research, authorship, and/or publication of this article.
Funding
The author(s) disclosed receipt of the following financial support for the research, authorship, and/or publication of this article: Research was supported by Hangzhou Science and Technology Plan Soft Science Research Project(20190834M08).