
Abstract
Taiwan and Association of Southeast Asian Nations (ASEAN) do not have any diplomatic ties, but they have enjoyed significantly economic benefits, especially bilateral investment and trade cooperation. Over the period 2000–2017, trade between Taiwan and ASEAN had significantly focused on manufactured goods embodied with high-skill and technology-intensive content. Using gravity model with a PPML (Poisson pseudo-maximum-likelihood) estimator, this article explores determinants of bilateral trade flows between them at both aggregate and sectoral levels. We found that economic scale and per capital income of ASEAN have much stronger effects than those of Taiwan at both aggregate trade and the degree of manufacturing. Results also show that bilateral trade between Taiwan and ASEAN has been efficiently performed over recent decades, except for cases of Myanmar and Cambodia. Hence, a dynamic approach should be taken by both sides to promote bilateral trade relations in future.
Introduction
Prior enlarging as the whole regional organization in 1999, Association of Southeast Asian Nations (ASEAN) countries inherently occupied an important role in Taiwan’s foreign economic strategy. This was demonstrated by the introduction of so-called “Go South” policy under President Lee Teng-Hui administration in 1994, with the aim of enhancing Taiwan’s investment and trading activities in Southeast Asian market. In 2002, the government of President Chen Shui-Bian continuously attempted to resuscitate the initiative “Go South.” However, many argue that the implementation of “Go South” policy under Chen administration had gained modest successes in reality because much attention of Taiwanese traders and investors had been paid to the rise of mainland Chinese economy (T. Y. Chen, 1998; Jing, 2016). Under Ma Ying-Jeou administration (2008–2016), to avoid China’s negative response, Taiwan did not use the term of Southbound policy. Yet, Ma’s foreign policy intrinsically emphasized fostering relations with ASEAN which was proved by his proposal for building the so-called “ASEAN 10-plus-Three-plus One (Taiwan)” cooperation initiative (Chiou, 2017).
Recently, the strategic importance of ASEAN to Taiwan has been solidly confirmed when President Tai Ying-Wen released a “New Southbound” policy, aiming at constructing a new platform of foreign strategy in collaboration with ASEAN, South Asia, New Zealand, and Australia. Compared with previous initiatives, this latest “Go South” policy covers larger cooperation areas between Taiwan and participating countries, namely industry, commerce, electronics, agriculture, tourism, cultural exchange, education, and high-quality human resource training (Chow, 2016). Although Taiwan’s New Southbound policy may contradict the Taiwanese “One China Policy,” it arguably could offer Taiwan certain options to prevent any lopsided market unpredictability and to help resolve partially its economic and political weaknesses. On a boarder scope, Taiwan and ASEAN have been working together to enhance regional and international cooperation frameworks such as the Asian Development Bank (ADB), the Asia Pacific Economic Cooperation (APEC), or the World Trade Organization (WTO).
Among economic cooperation fields, bilateral trade between Taiwan and ASEAN has witnessed great achievements over the past decades. Specifically, according to database of United Nations Conference on Trade and Development (UNCTAD), total trade value between Taiwan and ASEAN has impressively grown, from approximately US$11.02 billion in 1990 rising to US$38.71 billion, US$70.85 billion, and US$110.62 billion in 2000, 2010, and 2017 respectively. As a result, Taiwan and ASEAN have become important trading partners to each party, especially from Taiwan side. These outcomes have become increasingly impressive when taking unofficial foreign relations into account of which all ASEAN countries admit the “One China Principle” in favor of China. This puts forward interesting questions as follows: What is the main characteristics in trade pattern between Taiwan and ASEAN over past decades? What are the determinants of trade follows at both aggregate and sectoral levels between two regions during this period? And, how is the bilateral trade potential between the two sides realized?
Looking at literature review, there are various approaches employed to analyze bilateral trade flows between countries, particularly in East Asian region. A number of studies have employed international commodity classification systems such as Harmonized System (HS), Broad Economic Categories (BEC), Standard International Trade Classification (SITC); and trade pattern indices namely Revealed Comparative Advantage (RCA) index, Trade Complementary Index (TCI), Intra-industry Trade (IIT) index, and so on, to investigate trade relations and trade structure between East Asian economies. Notable works include Cheong (2011), Gaulier et al. (2007), Kimura et al. (2007), and Athukorala (2011). Meanwhile, a few studies have capitalized on econometrics models like Global Trade Analysis Project (GTAP) or gravity model to analyze trade flows among East Asian countries such as Phan and Jeong (2016), Armstrong (2015), and Truong et al. (2019a). Those works generally argued that trading activities in manufacturing goods, particularly electronic parts and components have played a crucial role in the whole trading network between East Asian countries. In addition, multinational companies coming from Japan, China, South Korea, and somewhat Taiwan have still been governing trade flows and trade structure in this region. However, ASEAN economies to some degree are also intensifying their position in the regional production and distribution network.
On the other side, there are also studies about trade activities between Taiwan and the whole ASEAN or between Taiwan with individual ASEAN members, such as works of Leifer (2001), Dent (2005), Wu (2008), Hong (2011), Hsiao and Hsiao (2015), Jing (2016), Chow (2016), P. Chen (2016), and Truong et al. (2019b). Yet, these research works have mostly employed qualitative approach and descriptive analyses to discover aspects of Taiwan–ASEAN trade; while less studies have provided empirical evidence (through quantitative approach) to shed light on the determinant factors of trade flows between the two parties. To partially fill this literature gap, the current article, through applying gravity model with a Poisson pseudo-maximum-likelihood (PPML) estimator proposed by Santos Silva and Tenreyro (2006), aims to examine the impacts of economic, political, and cultural factors on Taiwan–ASEAN trade at both aggregate and sectoral levels as well as assess the realization level of their trade potential over 2000–2017. Based on these empirical analyzes, this article provides suggestions for Taiwanese and ASEAN policy makers to upgrade and expand their mutual trade activities in future.
This current study is organized as follows. Following the introduction, Section “Trade Patterns Between Taiwan and ASEAN” investigates the main characteristics of trade pattern between Taiwan and ASEAN. Section “Econometrics Model and Data Analysis” elaborates theoretical framework of gravity model, while Section “Estimated Results” discusses empirical results. Next, Section “Trade Potentials” provides estimation results for trade potential and finally, Section “Concluding Remarks and Implications” summaries the research findings and brings out implications.
Trade Patterns Between Taiwan and ASEAN
Figure 1 shows that over recent decades, there had been a significant growth in both exports and imports value between Taiwan and ASEAN. Specifically, Taiwan’s exports to ASEAN had quickly reached nearly US$42 billion and more than US$70 billion in 2010 and 2017, respectively, compared with only US$18 billion in 2000 and US$15 billion in 1995. Meanwhile, Taiwan’s imports from ASEAN considerably grew from merely US$4 billion in 1995 reaching US$20 billion and US$40 billion in 2000 and 2017, respectively. In terms of growth rate, between 1995 and 2017, Taiwan’s exports to ASEAN had expanded by more than fourfold while the figure for its import was tenfold. Regarding trade balance, Taiwan’s trade surplus over ASEAN market had sharply increased from US$3.53 billion in 1995 to US$11.3 billion and US$30.5 billion in 2010 and 2017, respectively. It is worth noting that Taiwan’s trade balance with ASEAN turned to deficit between 1998 and 2002, which could be attributed to remarkably negative influences of Asian financial crisis 1997–1998 on Taiwan’s export.

Bilateral trade between Taiwan and ASEAN (US$ billion).
Thanks to the rapid trade development between the two sides, ASEAN’s position in the whole picture of Taiwan’s foreign trade activities had dramatically changed, jumping from the fourth place in 1990 to the first place in 2015 in the rank of Taiwan’s biggest trading partners. More specifically, according to data reported by Bureau of Trade of Taiwan, ASEAN’s share in Taiwan’s total trade in 2015 was 30.55%, much higher as compared with shares of mainland China (22.6%), the United States (11.92%), Hong Kong (11.92%), and Japan (11.39%). To compare, in 1990 ASEAN’s share of Taiwan’s trade was just 17.81%, much lower than shares of the United States (28.17%), Hong Kong (28.17%), and Japan (19.96%). In the opposite direction, as for 2015 Taiwan occupied the fifth largest trading partner of ASEAN after China, the United States, Japan, and South Korea (top six if including European Union).
In terms of market distribution, trade exchange between Taiwan and ASEAN principally focuses on the largest member economies, namely Singapore, Malaysia, Indonesia, Thailand, Philippines, and Vietnam (ASEAN-6). Especially, Singapore and Malaysia appeared in top 10, while the remainders ranked in top 20 in terms of Taiwan’s biggest trading partners. On the contrary, trade degree of four remainders consisting of Brunei, Myanmar, Laos, and Cambodia with Taiwan has remained very tiny during that time. To gain insights into the trade pattern between Taiwan and ASEAN, the current article capitalizes on UNCTAD’s classification and database on the degree of manufacturing. Accordingly, manufactured products between Taiwan and ASEAN are classified into main following groups: labor-intensive and resource-based products; low-skill and technology-intensive products; medium-skill and technology products; and high-skill and technology-intensive products. Medium- and high-skill and technology-intensive goods are further divided into following sub-industries: electronics (excluding parts and components), parts and components for electrical and electronic goods, and other (excluding electronics). The results are depicted in Tables 1 and 2.
Taiwan’s Exports to ASEAN as the Degree of Manufacturing (%).

Source. Author’s estimation using UNCTAD’s database.
Note. ASEAN = Association of Southeast Asian Nations; UNCTAD: United Nations Conference on Trade and Development.
Taiwan’s Imports From ASEAN as the Degree of Manufacturing (%).

Source. Author’s estimation using UNCTAD’s database.
Note. ASEAN = Association of Southeast Asian Nations; UNCTAD: United Nations Conference on Trade and Development.
Descriptive Statistics.

Table 1 demonstrates a high concentration on manufactured goods in Taiwan’s export to ASEAN market. Specifically, in 2000 the share of manufactured goods in Taiwan’s exports was very high, at 95.06%. It then declined to 80.05% and 77.35% in 2005 and 2010, respectively. After the decreasing period, the position of manufacturing sector to Taiwan’s export significantly increased, reaching in turn 90.25% and 90.80% in 2016 and 2017. Contributing to the large proportion of this sector was exports of high-skill and technology-intensive products, with the share increasing from 46.87% to 67.46% between 2000 and 2017. Most of high-skill and technology-intensive export products from Taiwan to ASEAN focused on high-skill and technology-intensive electrical and electronic parts and components, reaching 55.15% in 2017 compared with only 33.88% in 2000. By contrast, during this period the share of medium-skill and technology-intensive export products reduced from 22.23% to 10%. The declining trend also took place in export of labor-intensive and resource-based goods, accounting for 6.88% in 2017.
On the other side, Table 2 also shows that ASEAN’s exports to Taiwan were primarily manufactured goods. It is also interesting to note that most manufactured export products to Taiwan concentrated on high-skill and technology-intensive products but its share significantly decreased from 64.67% in 2000 to 51.82% in 2017. In this sector, the contribution of high-skill and technology-intensive parts and components for electrical and electronic goods was the largest. Yet, while the share of high-skill and technology-intensive products in Taiwan’s exports to ASEAN significantly increased between 2000 and 2007, the role of this group in Taiwan’s imports from ASEAN considerably reduced during the same period.
In addition, there was also an opposite direction of the share of medium-skill and technology-intensive products between Taiwan and ASEAN, with the reducing trend in Taiwan’s exports and the growing tendency in ASEAN’s exports. Similar to Taiwan, the role of labor-intensive and resource-intensive goods as well as low-skill and technology-intensive goods to ASEAN’s export remained limited, with the share of each category was below 10%.
In sum, despite not having official diplomatic relations, Taiwan and ASEAN have become crucial trading partners to each party, particularly from Taiwan’s side. Furthermore, trading activities between Taiwan and ASEAN have remarkably concentrated on manufacturing products embodied with high-skill and technology-intensive content, especially in the case of Taiwan’s exports; of which intermediate products such as electrical and electronic parts and components have played a vital role. This reaffirms that ASEAN and Taiwan have become important partners in the regional production and distribution network of each side, especially in Taiwan’s multinational companies.
Econometrics Model and Data Analysis
Augmented gravity equation
Gravity model is among the most well-known and popular approaches in analyzing international trade flows. At the beginning, work by Tinbergen (1962) showed that it is possible to apply gravity model to estimate the relation between scale of economy, distance, and their trade degree. In fact, many scholars have been widely successful in developing the literature of the original gravity model and massively applying its specifications in empirical studies as well. One of the most fruitful variations is a specification proposed by Anderson and van Wincoop (2003) in which traditional gravity equation is argued as being biased because of not taking into account effects of multilateral resistance terms. The equation is presented as follows:
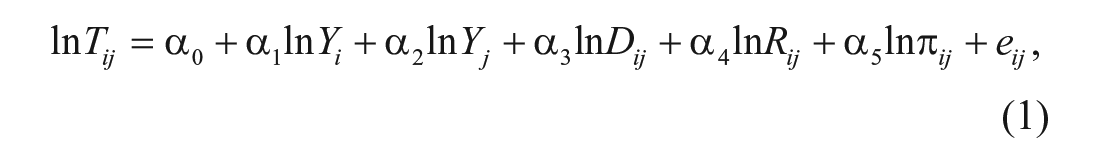
where Tij is bilateral trade flows; Yi, Yj, and Dij, are in turn variables of conventional gravity economic size of two interested partners and geographical distance between them; Rij is trading multilateral resistances, π ij is dummy, and eij is a random error term.
Deriving from the specification suggested by Anderson and van Wincoop (2003), the current article applied an augmented gravity model to examine trade flows between Taiwan and ASEAN countries. The form is as follows:

where T presents bilateral trade flows between Taiwan (i) and its partners in ASEAN (j) in year t. Variables gdp and income stand for gross domestic products (GDP) and per capita income, respectively for sides. Variable distance is physical distance between Taipei (Taiwan) and each capital of ASEAN countries. Variable exrateijt presents foreign exchange rate between New Taiwan dollar and each national currency of ASEAN countries. Variables culdis and polipower are in turn the proxies of cultural distance and different magnitude of geo-political power; while dummy variables of wto and comlang illustrate legitimate membership status in WTO and similarity of language in speaking Mandarin (traditional Chinese) respectively.
It is noteworthy to underline that the specification by Anderson and van Wincoop (2003) has not discussed elements of cultural distance and geo-political power but they suggest that variable can be used as a proxy of multilateral resistances on trade. On the literature, the works by Liu et al. (2018), Beugelsdijk et al. (2014), Quer et al. (2017), and Dong and Truong (2019) indicate that there is a relatively close correlation between the cultural similarity and political effect with the performance of trade relations among countries. Hence, it is rational to take cultural distance and geo-political power into account to strengthen more explanation capacity of estimated gravity equation.
Dummy variables are taken into consideration to enhance the reliability of estimation results and control potential biased issues arisen behind the model. Many believe that mainland China has tried to exercise its political and economic power to affect Taiwan’s foreign ties as well as impede the participation of the island in international-regional platforms. Thus, the accession to WTO in 2002 is acknowledged as a considerably strategic achievement for Taiwan’s efforts to closely take part in the global trading network. Needless to say, the WTO is a global trade system acting as a governing ruler to ensure fundamental principles of multilateral trading system implemented in smooth, predictable and free operation as much as possible. Hence, dummies member of WTO would be inserted into the model to capture effects of WTO on trade flows. Meanwhile, the similarity of language is also treated as a significant dummy in affecting trade flows. The reason is that there are a certain number of people in ASEAN countries speaking Mandarin. As official statistic figures retrieved from Department of Statistic Malaysia, a proportion of Malaysian Chinese reaches 23.4% of total population in 2010. In addition, Mandarin is one of three formal languages (besides English and Malay) educated in school. The same as Malaysia, Mandarin along with English, Malay, and Tamil are official languages used and educated in Singapore.
Estimation issues
Theoretical foundation and experiments on gravity model show that estimating aggregate trade could lead to biased results due to endogenous and intersection effects between subcomponents of trade. To remedy this issue, we treat bilateral trade flows between Taiwan and ASEAN members separately as imports and exports. For some advantages such of mitigating bias caused by unobserved heterogeneity across countries and determining individual effects of undetectable variables (Bacchetta et al., 2012; Egger, 2002; Gomez-Herrera, 2013), panel data will be approached. However, the presence of heteroscedasticity in cross-section data is theoretically unavoidable. Bacchetta et al. (2012) stated that working with gravity equation the assumption of homoscedasticity of error terms could be damaged by heterogeneous observations in many ways.
Note that equation (2) is additionally inserted terms of multilateral resistance which somehow are not directly observed. Therefore, nonlinear least square (NLS) approach is necessary to consider for estimating. Nevertheless, the NLS approach has been crucially arguable since the heteroscedasticity is usually ignored. Anderson and van Wincoop (2003) proposed the use of individual fixed effects in estimating multiplicative model by ordinary least squares (OLS). However, this approach raises a problem of zero trade which possibly leads to biased results in estimating with presence of heteroscedasticity. To resolve this issue, Santos Silva and Tenreyro (2006) introduced a new approach by using a PPML estimator. They found evidence that PPML approach should be applied in estimating gravity instead of OLS and NLS. A subsequent study of Santos Silva and Tenreyro (2011) once again demonstrated the consistence of using PPML in estimating gravity equation. As suggested by Santos Silva and Tenreyro (2006), we also perform Ramsey-reset test (so-called heteroscedasticity-robust reset test) to check the adequacy of estimator.
Now, equation (2) for estimation under PPML can be rewritten as follows:

For reference only, both conventional and Anderson and van Wincoop specifications will be estimated with both estimators of OLS and PPML. However, the estimated result is interpreted given on augmented gravity model proposed by Anderson and van Wincoop under PPML approach only. Noted that the panel is strongly balanced.
Data analysis
Trade flows (import and export) and other variables are compiled in a panel dataset for period of 2000–2017. Data on trade between Taiwan and ASEAN countries, at both aggregate and sectoral levels are retrieved from UNCTAD database, while data on GDP and per capita income are obtained from the World Development Indicators of The World Bank (http://datatopics.worldbank.org/world-development-indicators/). Note that in the model GDP presents as a measurement of economic size, while per capita income is as a proxy to gauge development magnitude of economy. Theoretically, larger and richer countries usually tend to trade more, therefore GDP and per capita income hypothetically have positive impacts. Distance (distance) acts as a proxy of transportation costs and is considered as an impediment of bilateral trade between countries, thus it is expected to have negative effects. Data on distance are retrieved from GeoDist, CEPII.
We also take into account effects of cultural distance and geo-political power on bilateral trade between Taiwan and ASEAN. Capitalizing on the extended Hofstede’s model with six dimensions comprising uncertainty avoidance, power distance, individualism-collectivism, masculinity-femininity, long-term orientation and indulgence versus self-restraint produced (Hofstede, 1980), Kogut and Singh (1998) measure cultural distance index by following function:

where CDij represents the cultural distance between trading partners; Idi, Idj reveal the scores on the cultural dimension; Vi is the variance of the score of the dimension. Beside that, globalization is believed to considerably affect international trade, of which the degree of economic freedom in a country holds an important role to its external trading activities. Thus, it is likely that a higher integration level of an economy is, a more decreased cultural difference between that nation and other countries is (Dong & Truong, 2019). With the purpose to embrace influences of globalization and integration, index of cultural distance will be weighted by square root of multiple of Economic Freedom (EF) index of Taiwan and its counterparts, and is calculated as follows:

Trade patterns between countries with close cultural background have better acceptance in terms of products of each other. Differently stated, cultural distance is believed to obstacle doing business abroad; therefore, it could have a negative sign on trade (Dong & Truong, 2019). However, cultural diversity or a mix of diversity and homophiles could also enhance creativity and consumption of goods, particularly cultural goods. Hence, this variable can take both negative and positive signs. Data on cultural distance are obtained from the official website of Hofstede (https://geerthofstede.com/landing-page/), while economic freedom index is retrieved from The Heritage Foundation (http://www.heritage.org/index).
Besides cultural distance, we conduct the polipower index to consider impact of different magnitude of geo-political power on trade. Variable polipower is employed based on Comprehensive Index of National Capability (CINC) and Economic Freedom Index with the following function:

Relied on six components including total population, urban population, iron and steel production, primary energy consumption, military expenditure and military personnel, J. David Singer created CINC which presents Correlates of War project in 1963. The CINC is widely arguable but many reckon that the index is still among the best-known and most accepted methods for measuring national capabilities. As the same idea with element of cultural distance, polipower index is weighted by EF index to capture globalization effects on trade.
As for dummy variable wto, it is believed that becoming a member of WTO could facilitate trade transactions and foster activities of foreign trade. This dummy also acts as a proxy of global trade agreements network, which encourages constructively trade exchange among them. So, variable wto is expected to have positive signs, and take value of 1 if Taiwan and members of ASEAN are jointly official members of the WTO, other options hold value of 0. Information on members of WTO is attained from the official website of this organization (https://www.wto.org).
Finally, common language could break through barriers in international communication, which in turn helps facilitate trade transactions. Hence, dummy variable of common language is expected to have positive signs. Common language takes value of 1 if Mandarin is spoken by at least 9.00% of total population in both sides, other numbers take value of 0. Data on similarity of language are obtained from database of GeoDist and CEPII.
Estimated Results
Estimated results on separate trade flows with traditional gravity equation under estimators of OLS and PPML are depicted in Table 4. Note that there have huge differences in terms of coefficients in using OLS and PPML to estimate conventional gravity equation. Outcomes of reset tests show that PPML estimator is likely fit well with estimating and in this case, presence of heteroscedasticity suggested is in charge for inconsistence between results of OLS and those of PPML. These results are similar to those in study of Santos Silva and Tenreyro (2006).
Estimated Results With Traditional Gravity Equation.

Note. OLS = ordinary least squares; PPML = Poisson pseudo-maximum-likelihood.
p < .05. **p < .01. ***p < .001.
Table 5 presents the results from estimating of fixed effects gravity equations under PPML technique. Notations (1) to (3) denote the estimation results for equation (3) without-culdis variable, without-polipower variable, and full variables, respectively.
Estimated Results With Anderson and van Wincoop Specification Under PPML.

Note. PPML = Poisson pseudo-maximum-likelihood.
p < .05. **p < .01. ***p < .001.
With respect to size of economy, coefficients of GDP of ASEAN countries are statistically significant at 1% but come up with expected values only for imports model, suggesting that economic growth in ASEAN could have considerably positive impacts on only import sector. Interestingly, GDP of Taiwan is likely to have no effect on trade since its coefficient is statistically insignificant. Regarding market development, estimated coefficients for per capita income of Taiwan turn out with positive values for both exports and imports model but statistically insignificant. Meanwhile, coefficient for per capita income of ASEAN is significant at 1%, and takes expected signs for both imports and exports model. Economic and income growth of ASEAN countries has dramatically increased for study period that has relatively expanded its demand of goods on both exports and imports. This could supportively explain the trend of rapid expansion of Taiwan’s export flows to ASEAN. By contrast, per capita income and GDP of Taiwan have remained stable for the same period, and as a result, they may fail to enhance trade flows of Taiwan to/from ASEAN.
The estimated results of distance and exchange rate are statistically significant at 1% and almost come up with expected signs for both exports and imports model. The results fit with theoretical foundations of gravity model, showing that further distance would harm Taiwan–ASEAN trade. In other words, the development of technology and deep economic integration in East Asia economies have facilitated the delivery of goods between Taiwan and ASEAN, but physical distance still plays an important role in trade pattern between two regions. So interestingly, the coefficients of exchange rate for both exports and imports are purely significant, of which this variable has sizable positive influences on Taiwan’s exports to ASEAN while negatively affecting Taiwan’s imports from ASEAN. Taiwan’s economic growth has considerably relied on export sector, so for a long time Taiwan has adopted a crawling peg foreign exchange control mechanism to keep its exchange rate stable within a range of certainly controlled margin on purpose of supporting export-oriented industries. Thus, the fluctuation between the currency of Taiwan and the banknotes of ASEAN countries reflects in a sense as a surely unchangeable stability. This strategy supportively benefits Taiwan’s exports for a certain stage of history, however, if looking for long-term interests and an irresistible trend of international trade liberalization, the exchange rate needs to be operated freely in line with market principles.
For cultural distance, the estimated coefficients are both statistically significant but come up with complicated signs; while the coefficient of geo-political power is statistically significant on export but turn out with unexpected sign, and statistically insignificant on import side. As expected, cultural distance has negative impacts on bilateral trade, while geo-political power contributes positively to that. Note that degree on polipower coefficient is relatively higher in exports model rather than in imports, implying that geo-political pressure on Taiwan’s export goods to ASEAN is comparatively crucial relative to its imports.
For language similarity, the estimated coefficients for exports and imports are both significant, meaning that common language plays an important for Taiwan in doing business in ASEAN countries. This result is not only consistent with theory but also compatible with the fact that residents of overseas Chinese community are generously vivid in ASEAN countries. In the full augmented model, the coefficient in exports model is negative while this in imports is positive, indicating that effects of Mandarin on Taiwan’s exports to ASEAN countries are less substantial as compared with those on Taiwan’s imports. Interestingly note that without augmenting index polipower the coefficients of common language are statistically significant but likely negative on trade, while without cultural distance that of are insignificant. These suggest that cultural distance and polipower play a very meaningful role in determining effects of language on trade.
Also interestingly, there is no evidence underpinning the hypothesis that accession to the WTO could enhance trade flows between Taiwan and ASEAN countries as wto is statistically insignificant for both exports and imports model. For Taiwan’s status circumstance, under political constraints of mainland China, there is a pervasive worry about a possibility that this island could be further isolated from free trade agreements or other economic cooperation platforms. In fact, Taiwan has been facing huge challenges to maintain and expand economic interactions with Southeast Asian countries. The reason may be that Taiwan and ASEAN could not have a bilateral preferential trade agreement that possibly allows Taiwanese export products to enjoy lower tariffs in ASEAN. This, along with lack of sharply incentive polices from the government reduced the motivation of Taiwanese enterprises to enhance renovation and investment activities in ASEAN countries. Hence, an inferable implication of estimated results for member dummies of WTO is that to foster trade activities in particular and economic collaboration in general, Taiwan needs to take fiercely necessary moves to get closer access to international-regional trade cooperation frameworks. Only by doing so, Taiwan could lower China’s political and economic effects and effectively engage with global platforms. In this regard, ASEAN—one proactively centric pillar in constructing an intensively collaborating merchandise of intra–extra regional integration is one of the best possibly suitable choices for Taiwan. It is not only because both Taiwan and ASEAN countries have enjoyed great achievements in trade and investment cooperation over recent time, but also because two sides have close relations in terms of language, culture, religion, and propinquity. Those outcomes are helpful to explain the estimated results with export model when we take out augmented variable of polipower.
We also measured the determinants of trade between Taiwan and ASEAN according to the degree of manufacturing. The results are illustrated in Tables 6 and 7.
Estimated Results With Manufacturing and Its Sub-Sectors: Export.

p < .05. **p < .01. ***p < .001.
Estimated Results With Manufacturing and Its Sub-Sectors: Import.

p < .05. **p < .01. ***p < .001.
In terms of Taiwan’s export to ASEAN countries, Table 6 demonstrates that the same as aggregate level, there is no evidence found on the effect of Taiwan’s GDP and per capita income at all manufacturing degree. Interestingly, the estimation outcome shows that size of ASEAN economies has negative impacts on many sectors by the degree of manufacturing such as Group e2 (labor-intensive and resource-based goods) and Group e4 (medium-skill and technology-intensive products). Meanwhile, per capital income of ASEAN countries is found to positively affect Taiwan’s export at all manufacturing levels, particularly Group e6 (high-skill and technology-intensive electronic parts and components) and Group e9 (high-skill and technology-intensive electronic products, excluding parts and components). Regarding physical distance, the estimated coefficients are almost statistically significant but come up with unexpected signs, meaning that Taiwan’s export to ASEAN at nearly all degree of manufacturing does not impeded by geographical distance between two sides. This result is understandable since the fast development of technology and transportation means might help partners shrink the barrier associated to physical distance. With respect to political power, estimated outcome shows that this variable has positive effects on medium-skill and high-skill products.
Meanwhile, estimated results show that there is the heterogeneity in the estimation of other parameters at different degree of manufacturing. In particular, variable cultural distance has advantageous effects on Taiwan’s export to ASEAN at many different manufacturing levels, with the exception of labor-intensive and resource-based goods, and high-skill and technology-intensive electronic goods. Variable exchange rate has a positive effect on export of labor-intensive and resource-based goods, low-skill and technology-intensive goods as well as high-skill and technology-intensive electronic goods, excluding parts and components; while it negatively influences export of medium-skill and technology-intensive goods. Amazingly, variable common language is found to disadvantageously affect export of all sub-sections. Also, we detected that variable wto has effects on several sectors, with the positive role on export of high-skill and technology-intensive, and the negative one on export of labor-intensive and resource-based and medium-skill and technology-intensive: electronics (excluding parts and components).
In terms of Taiwan’s import from ASEAN, as the same direction with export flows, Table 7 shows that economic size and per capital income of Taiwan have almost no effects on its import. Meanwhile, economic size of ASEAN has negative impacts on some subindustry such as Group i2 (labor-intensive and resource-based goods), Group i9 (High-skill and technology-intensive: Electronics (excluding parts and components), Group i5 (medium-skill and technology-intensive electronic goods, excluding parts and components), and Group i11 (high-skill and technology-intensive: Other, excluding electronics); and there are no evidence on the other groups. The positive effect on Taiwan’s import from ASEAN is found with variable per capital income of ASEAN at many different manufacturing levels such as labor-intensive and resource-based goods, low-skill and technology-intensive goods, or medium-skill and technology-intensive electronic goods, excluding parts and components. Estimate results also reveal advantageous effects of variable political power on Group i9 from ASEAN, and disadvantageous impact on Groups i2, and i4. The same direction, physical distance is found to have mixed effects on imports which hinders import flows for Groups i8 and i9 while supports for Groups i2, i3, i4, i5, and i7; no impact on other group.
The same as Taiwan’s export to ASEAN, estimated results for Taiwan’s import from ASEAN show the heterogeneity in the estimation of other parameters namely cultural distance, exchange rate, common language, and wto. Specifically, we found that cultural distance positively affects Taiwan’s import from ASEAN over Groups i2, and i4, while this variable negatively impacts import of Groups i4, i8, and i9. Regarding common language, estimation outcome indicates that this variable does support much of import of products embodied with Groups i2, i4, and i11, while does not find evidence on import of Groups i1, i3, i6, i7. i8, i9 and i10. With respect to variable wto, the estimation shows that access to WTO could enhance Taiwan’s import from ASEAN over low-skill and technology-intensive goods, medium-skill and technology-intensive electronic products, excluding parts and components, by contrast this element has a negative effect on import of medium-skill and technology-intensive goods.
Trade Potentials
We employed index of Average Standardized Trade Potential (ASTP) proposed by Benedictis and Vicarelli (2005) to examine trade potential between Taiwan and ASEAN countries . The form presents as follows:

where RT is actual exports/imports values of Taiwan to/from ASEAN countries, ET is estimated value of that from gravity equation. Zero is considered as critical value of ASTP where trade between Taiwan and ASEAN countries seemingly reached the absolute potential. ASTP approaches approximately zero, exports/imports of Taiwan to/from ASEAN countries are close to the critical point. Trade flows are untapped for case of negative ASTP and overtraded for the opposite. The results are illustrated in Table 8.
Trade Potentials Between Taiwan and ASEAN Countries.

Note. Estimated results for Brunei, Cambodia, Laos, and Myanmar from equation (2), others from equation (3) in Table 5. ASEAN = Association of Southeast Asian Nations; ASTP = Average Standardized Trade Potential.
It is worth noting that only Myanmar and Cambodia have more room to trade with Taiwan because indexes of trade potential for both imports and exports are much more far away the critical value of zero. The results are completely compatible with reality of trade activities of both sides. Looking at the absolute volume of imports and exports between Taiwan and those nations, it is easy to see that trade flows are relatively smaller than other countries in ASEAN. And, this can be reasonably explained that economic relation of Taiwan with Myanmar and Cambodia had remained limited for a long time due to economic-closed policy of Myanmar and diplomatic economic limitations of Cambodia.
In general, Taiwan is likely reaching the potential point of trade with the rest nations of ASEAN because ASTP index of those nations is nearly zero. However, in a specific picture of absolute figure as comparing to predicted value, Taiwan still could trade a bit more with those nations. With regard to exports, Taiwan’s actual exports to ASEAN have revealed overtraded status in cases of Malaysia and Thailand, while its exports to the remaining member countries have not yet achieved the perfect potential. In terms of imports, Taiwan’s actual imports from Brunei, Laos, Malaysia and Philippines have been higher than the predicted potential, while its imports from Singapore, Thailand, Indonesia and Vietnam have not reached the forecasted value. Actual trade between Taiwan and ASEAN countries has turned very close to the expected point, suggesting that both Taiwan and ASEAN have performed effectively bilateral trade potential during the last decades. There are several possible explanations for those positive achievements. The geographical distance between Taiwan and ASEAN countries is very close. Along with the rapid development of physical infrastructure in both sides, this has helped significantly reduce the cost of transporting goods between two regions. In addition, ASEAN countries and Taiwan have obtained relatively impressive economic growth and income growth over time that in turn have significantly contributed to intensifying trade relations between the two parties. Furthermore, Taiwan and ASEAN countries not only have been relatively similar in terms of language but also cultural characteristics. Finally, the rising foreign direct investment flows into ASEAN countries from Taiwanese firms have also promoted trade activities, especially in electronic and electrical parts and components between the two sides. Nevertheless, since the current trade potential between Taiwan and ASEAN has been highly exploited over recent decades, Taiwan and ASEAN are in need of creating another new motivation for their bilateral trade expansion in upcoming time.
Concluding Remarks and Implications
Over the past decades, Taiwan–ASEAN economic relations have rapidly expanded even though both sides do not have official diplomatic relations. In trade field, Taiwan and ASEAN countries have currently become key trading partners to each party, particularly to Taiwan side. However, there is a consecutive tendency of trade surplus in favor of Taiwan that would partly reduce real benefit ASEAN countries could enjoy from the fast expansion of bilateral trade with Taiwan. Going into trade patterns, this current paper explores that there is a high concentration on high-skill and technology-intensive goods, especially electronic and electrical products in Taiwan–ASEAN trade. To some degree, this has demonstrated the rising integration of Taiwan–ASEAN trade relations in the regional production and distribution network as well as has represented the development of production capability of the two sides, particularly ASEAN countries.
By employing gravity model using PPML estimator, at aggregate level, we found a vital role of ASEAN’s economic size and per capital income on Taiwan–ASEAN trade; on the contrary, no evidence is found to show the similar effects of those factors from Taiwan side. Estimation results demonstrated opposite effects between physical distance, cultural distance, common language and political power on Taiwan–ASEAN trade flows, with the negative role for physical and cultural distance, and the positive one for the common language and political power. The impacts of exchange rate on trade flows between two sides are different, with the positive role in Taiwan’s export and the negative one in Taiwan’s import. Meanwhile, no evidence is found to express effects of access to WTO on exports and imports between two parties. In terms of the degree of manufacturing, the estimation also showed that effects of ASEAN’s economic size and per capital income on Taiwan–ASEAN trade are much stronger than those of Taiwan. Besides, estimation results showed the negative role of physical distance on Taiwan–ASEAN trade at many different levels of manufacturing. By contrast, variable political power is found to enhance Taiwan–ASEAN trade on several sectors and sub-sectors according to the degree of manufacturing. Another interesting finding is that there is the heterogeneity in the effects of other parameters, namely cultural distance, exchange rate, common language and wto, on export and import between two regions at different degree of manufacturing.
Estimation results also indicated that both Taiwan and ASEAN countries have realized efficiently bilateral trade potential as the ASTP values for export and import between the two sides have mainly turned around the critical point, except for Myanmar and Cambodia. Considering the fading away of comparative advantages of the two sides; higher competition from other countries; and the possible fluctuations in cross Strait relations between Taiwan and mainland China, there should be a dynamic approach implemented to promote Taiwan–ASEAN trade relations toward a more advanced model in the upcoming years.
In particular, Taiwan–ASEAN cooperation initiatives are suggested to focus more on upgrading production capability, particularly in ASEAN’s domestic industries through increasing cooperation programs on discovering and developing new products as well as on skilled human resource training. Then, Taiwan should consider and promote preferential trade agreements with potential ASEAN economies such as Indonesia and Malaysia so that this island could reduce the possibility of being further lagged behind integration course in East Asia region. Taiwan may capitalize on a large number of Southeast Asian migrants living on the island, including second-generation Taiwanese-Southeast Asian families, and numerous Southeast Asian students studying in Taiwan, to act as a potential bridge for its economic activities in ASEAN market. This also helps mitigate the unexpected impacts of cultural differences on Taiwan–ASEAN trade relations. In addition, enhancing reforms in economic environment in ASEAN, associated with providing incentive programs, particularly under Taiwan’s New Southbound Policy are measures that possibly foster Taiwan’s abroad business into Southeast Asia nations which in turn helps to intensify trade activities between the two sides.
Research Data
Culture-distance_data for Determinants of Trade Between Taiwan and ASEAN Countries: A PPML Estimator Approach
Culture-distance_data for Determinants of Trade Between Taiwan and ASEAN Countries: A PPML Estimator Approach by Nhan Thanh Thi Hoang, Hoan Quang Truong and Chung Van Dong in SAGE Open
Research Data
Dofile for Determinants of Trade Between Taiwan and ASEAN Countries: A PPML Estimator Approach
Dofile for Determinants of Trade Between Taiwan and ASEAN Countries: A PPML Estimator Approach by Nhan Thanh Thi Hoang, Hoan Quang Truong and Chung Van Dong in SAGE Open
Research Data
Politic-Power_data for Determinants of Trade Between Taiwan and ASEAN Countries: A PPML Estimator Approach
Politic-Power_data for Determinants of Trade Between Taiwan and ASEAN Countries: A PPML Estimator Approach by Nhan Thanh Thi Hoang, Hoan Quang Truong and Chung Van Dong in SAGE Open
Footnotes
Acknowledgements
The third author Chung Van Dong deeply thank Prof. Peicuyan Shih at Ming Chuan University, Taiwan for her guidance and support on the content of the manuscript. We also thank three reviewers so much for their constructive and useful comments and suggestions on our manuscript that have helped improve the quality of paper.
Author Note
Chung Van Dong is now affiliated to National Dong Hwa University, Hualien, Taiwan.
Declaration of Conflicting Interests
The author(s) declared no potential conflicts of interest with respect to the research, authorship, and/or publication of this article.
Funding
The author(s) received no financial support for the research, authorship, and/or publication of this article.
References
Supplementary Material
Please find the following supplemental material available below.
For Open Access articles published under a Creative Commons License, all supplemental material carries the same license as the article it is associated with.
For non-Open Access articles published, all supplemental material carries a non-exclusive license, and permission requests for re-use of supplemental material or any part of supplemental material shall be sent directly to the copyright owner as specified in the copyright notice associated with the article.