
Abstract
This study explores the Taiwan Dollar (TWD) as the currency of a small island economy, uses the trading information sets from overseas and the market itself to examine the impacts on the adjustment of daily spot exchange rates. The daily USD/TWD is explained by the trading information sets, contain which the daily trading activities and the ratio of the real body on the daily candlestick chart of technical analysis on the Taipei Foreign Exchange Market, as well as the US-dollar index return to explain the USD/TWD spot rate change. The results showed that some of the USD/TWD changes were related to the US-dollar index return on overseas, and that the effect of the US-dollar index return was not limited to the adjustment rate from the previous closing rate to the opening rate on the day, which would affect the adjustment spot exchange rate in the intraday opening-to-closing period. There is a significant positive relationship between the real body ratio of the daily candlestick chart and the return of the exchange rate, supporting the real body ratio related to the change of the exchange rate. The study model can greatly improve the model interpretation ability of the change of exchange rate by about 50% after considering the trading activity factors. Finally, this study found that the volatility has a positive effect on Mondays and the 2008-financial crisis, and based on the shock that the news of depreciation was higher than the news of appreciation, so there exist asymmetry volatility.
Introduction
The foreign exchange market is the world’s foremost financial market for liquid currency. In particular, the exchange of currencies determines the exchange value of goods imported and exported among countries. Accordingly, the study of exchange rate changes has always been a hot topic in the discussion of international financial markets. Many prior theories have sought to explain long-term changes in exchange rates, including the international payments balance theory based on payment imbalances (IPBT) (Iyoboyi et al., 2014; Shahbaz et al., 2012), and the resultant difference in the value of the two currencies from the perspective of the purchasing power parity theory (PPPT) (Abuaf & Jorion, 1990; Clements & Lan, 2010; Jiang et al., 2016). Moreover, arbitrage activities arising from differences in interest rates among different financial markets are explained by the interest rate parity theory (IRPT) (Baba & Packer, 2009), suggesting that financial assets are subject to the risk effect of equal and perfect substitution based on the monetary method (MAT) (Melvin & Norrbin, 2013). Relevant references have been widely discussed.
Most theories focus on explaining monthly rather than daily exchange rate changes. Especially with the development of modern networks, exchange rates change with the rapid transmission of information so that market participants have increasingly focused on daily exchange rate change patterns. This study explores explanatory key factors for short-term changes in the exchange rate and volatility of the daily spot rate of the United States dollar against the Taiwan dollar (USD/TWD). Based on multi-regression and GJR-GARCH models, this research uses the return rate of the USD index (USDX) as a proxy variable for USD changes in international foreign exchange markets and tests the relationship between the USDX return rate and USD/TWD spot rate changes. USDX is calculated using the weighted geometric mean of six major currency pairs: EUR/USD, USD/JPY, GBP/USD, USD/CAD, USD/SEK, and USD/CHF. The value 100 was adopted as a benchmark to measure the overall performance of the USD in the international foreign exchange market. That is, the USDX measures the volatility of the USD relative to the portfolios of the six currencies. Our information sets include the USDX return rate of the previous trading day (overseas), the real body ratio of the daily candlestick chart (as technical analysis of the market), and daily trading on the Taipei foreign exchange market (TFEM). We analyze the impacts of daily exchange rate adjustments comprising the overnight effect (from the previous closing-to-opening rates), intraday adjustments (from the opening-to-closing rate), and the characteristics of exchange rate volatility.
The research contributions of this study are as follows: First, it is confirmed that USDX return rates can explain the extent of USD/TWD rate changes and the associated impact on the TFEM. The explanatory power of spot rate changes is used to clarify the reference position and value of USDX on the TFEM. Second, our study supplements current information on the impact of the 2008 financial crisis, particularly on USD movement, changes in the USD/TWD spot rate, and their volatility. Third, we examine the movement in the international USD passed over a longer period (Saturday and Sunday) with enhanced explanatory ability on Mondays—compared to other trading days of the week—for changes in TFEM exchange rates. Finally, from the exchange rate model established in this study, we can understand the efficiency of price adjustments of the USD/TWD spot rate on the TFEM. Reference information on exchange rate changes is also presented, including candlestick charts, USDX, and daily trading values.
This study is structured as follows: section 1 discusses the Literature Review; section 2 presents Data and Methodologies; section 3 shows the Empirical Results; and section 4 is our Discussion and Conclusions.
Literature Review
Some studies have found that, in many developing countries, exchange rate adjustments are relatively inefficient for the flow of information sets in foreign exchange markets. For example, Al-khazali et al. (2011) examined the random walk hypothesis (RWH) for five Asian emerging currencies against three benchmarks; the results supported their assertion of currency inefficiencies. Chen (2018) evaluated China’s foreign exchange market efficiency for changes in the Renminbi (RMB) against major currencies and found that market inefficiencies prevailed. Baharumshah et al. (2011) examined the responsiveness of exchange rate changes by comparing the official market to the black market—black market exchange rate adjustments were far quicker than official markets and official exchange rates were slower to adjust to information flows and inefficiencies.
Katusiime et al. (2015) examined Ugandan foreign exchange market efficiencies and found that buy and sell signals could be used to accurately predict exchange rate movements and yield higher returns, supporting the hypothesis that weak-form inefficiency exists in this market. When previous and current information sets flow to the foreign exchange market, inefficiencies influence exchange rate changes. In this trading market environment past information sets cannot fully reflect exchange rates, thus only contributing reference values.
Previous studies have found that exchange rate returns or changes may be influenced by technical analysis or trading factors. Nevertheless, questions remain concerning the application of technical analysis in understanding exchange rate changes. Chang and Osler (1999) use technical trading signals in the head-and-shoulders pattern as a potential source of exchange rate prediction that defies reason; this rule is profitable, but not effective. Osler (2003) used the document clustering of currency stop-loss and take-profit orders to explain and support two common technical analysis predictions. Bauer and Herz (2004) examined technical trading and exchange rate changes, particularly the excessive volatility of those foreign exchange markets with flexible exchange rate regimes. They found that chartists changed the composition of the foreign exchange market and caused excessive volatility. Hsu et al. (2016) used a large-scale investigation to confirm the substantial profitability of technical trading rules for specific periods, examining the temporary role of not-fully rational behavior and market immaturity in generating technical predictability and potential excess profitability.
Moreover, some studies have found that some foreign exchange trading activities and rate changes have a significant relationship. Mansfield (1997) explored the relationships between Australian-dollar rate changes and the daily trading activities of the Reserve Bank which improved predictions of the daily returns gained by holding Australian dollars. Tsuyuguchi and Wooldridge (2008) investigated the evolution of trading activity in Asian foreign exchange markets and found that volumes grew rapidly from 2004 to 2007 with an increase in the diversity of market participants. Except for the Japanese Yen (JPY), Hong Kong Dollar (HKD), and Singapore Dollar (SGD), the proportion of non-resident activity is relatively small, and markets are still in their infancy. Offshore non-performing markets developed insufficient control measures, causing fragmentation in trading activity, with Herstatt risks in Asian foreign exchange markets remaining high.
Payne (2003) confirmed information asymmetries in interdealer forex markets using the USD/DEM dataset, which includes the activities of multiple dealers over one trading week. Lei and Wu’s (2005) discussion of trading activity is divided into informed and uninformed. Moore and Payne (2011) use trading data and counter-party identities to explore sources of information advantage in inter-dealer forex trading among traders and found that in liquid dollar exchange rates, information was concentrated on the rate of the most frequently traded and special dealer activities, indicating that specialist traders can forecast exchange rate changes.
Bajo (2010) supported trading volume as an efficient proxy for information flow, thereby enhancing the information set of investors. Daníelsson et al. (2012) found that changing the frequency of data verification of four exchange rates—EUR/USD, EUR/GBP, GBP/USD, and USD/JPY—from 5 minutes to 1 week, and the order flow for exchange rate changes had strong explanatory power. Chaboud and LeBaron (2001) analyzed the relationship between daily trading volumes on the currency futures market and foreign exchange intervention by the Federal Reserve; their results showed a significant positive correlation. However, neither contemporaneous nor predicted volatility can fully explain the increase in trading activity; publicly reported interventionist activities appear to be an important determinant of trading volumes.
Evans (2002) examined the sources of exchange rate dynamics by focusing on the information structure of forex trading and found that public news is rarely the main source of exchange rate volatility. Frömmel et al. (2008) posit exchange rate volatility as private information and news as public information and found that larger-sized order flows could explain volatility expressed as informed trading, but that order flows from commercial customers did not, thereby supporting exchange rate volatility as reflecting information processing. Menkhoff et al. (2016) showed that order flows are valuable predictors of future exchange rates, supporting the argument that different client groups exhibit different predictive abilities, trading styles, and risk exposures, and that risk can be effectively mitigated through foreign exchange brokers.
Hagiwara and Herce (1999) supported endogenous sources of exchange rate volatility. McKenzie and Mitchell (2002) believed that in capturing exchange rates’ stylized features of volatility, the GARCH (1, 1) model captured the presence of symmetric responses (Aziz et al., 2020), and will be preferred. Kwek and Koay (2006) explored the conditional volatility of the daily spot nominal exchange rate and found it reasonable to use the GARCH class as an explanatory model. As for asymmetric effects in unexpected appreciations and depreciation of currencies, the GJR model was deemed suitable as an analytical method (Bedoui et al., 2019). The results showed that although most currencies’ volatility indicated little evidence of the existence of asymmetric effects (such as the Japanese Yen and UK Pound), indicating that currency volatility was not asymmetric.
Finally, there were differences in the movements of South Korean and Japanese currencies during the 2008 financial crisis (Choi et al., 2010). Khademalomoom and Narayan (2019) found that the bilateral exchange rates of these currencies exhibited strong time-of-the-day effects and supported the existence of three new intraday effects on local markets post-opening activities and market overlapping times; the monetary behavior caused by these intraday effects had an impact on investors.
Data and Methodologies
Daily USD/TWD spot rate data were collected from the Taipei Foreign Exchange Market Development Foundation website (http://www.tpefx.com.tw/web/index/index.jsp)—this data comprised the opening rate, high rate, low rate, closing rate, and trading value (USD 1 million) on the TFEM. Daily USDX data were derived from the Trade Weighted U.S. Dollar Index, code-named DTWEXM. DTWEXM was collected from the Economic Research Division of the Federal Reserve Economic Data website (https://fred.stlouisfed.org/series/DTWEXM/) between January 2, 2001, and October 31, 2018. Overall, 4,449 sets of daily trading data were collected.
The Percentage of the Daily Exchange Rate is Calculated as:

where:
We observe the information of the previous day generated by the international USDX change and the real body ratio of the daily candlestick chart, together with the impact of the opening price of the USD/TWD spot exchange rate on the TFEM. It is further established whether past daily information sets and trading activities still have a significant impact on the opening-to-closing period.
We can observe the information of the previous day generated by the international US-dollar index change and the real body ratio on the daily candlestick chart, as well as the impact of the opening price of USD/TWD spot exchange rate in the TFEM. In addition, it is further understood whether the past information sets and trading activities on the day still have a significant impact on the opening-to-closing period.
The Real Body Ratio of the Daily Candlestick Chart
Candlestick charts are often used by technical analysts as a method to analyze the price movements of financial assets, using the frequency of the data observed, such as daily, weekly, and monthly trading information; this study was based on daily candlestick charts. For the observed data, the information on the four daily exchange rates—such as the opening rate, high rate, low rate, and closing rate—on the trading day is plotted in Figure 1.

Candlestick chart.
In Figure 1, when the closing rate is higher than the opening rate, a hollow candlestick is drawn (left chart)—the top of the body represents the closing rate, and the bottom represents the opening rate. When the closing rate is lower than the opening rate, a full candlestick is drawn, the bottom of which represents the closing rate (right chart), and the top represents the opening rate. For a larger ratio of the real body of the daily candlestick chart, the degree of difference between the opening and closing rates is greater, indicating that changes in the exchange rate appreciation or devaluation during the observed period are more divergent. This study uses the candlestick chart in the foreign exchange market of the previous day as information sets—transformed into a proxy index using the ratio of the real body of the daily candlestick chart—to determine whether the exchange rate signal for the previous trading day's USDX information can be used to explain (i) the daily change ratio of the USD/TWD spot exchange rate on the TFEM; (ii) whether the daily exchange rate changes can be divided into changes from the closing price of the previous trading day to the opening price of the day (overnight changes); and (iii) changes from the opening to closing prices of the day (intraday changes).

where:
Models of Previous Day Trading Information Sets
Our models were developed to assess the relationship between the return rate of the USDX in recent trading information passed from overseas financial markets on the t-1th trading day and the ratio of the real body of the daily candlestick chart from the USD/TWD spot rate on the t−1th trading day. The USDX’s return is used to proxy an index of the performance of the USD in the international foreign exchange market, and to evaluate the sensitivity of the USD/TWD spot rate for international USD changes. The information set at this time, as a measure of the rate change trended by the USD in international financial markets, is relevant to the change in the TWD exchange rate on the TFEM. The model is expressed as:

In equation (3),
If the p-value of the ARCH effect test is less than .05, this signifies the heteroscedasticity of the residual terms in equation (3). We consider the heteroscedasticity of the conditional variance in equation (3). Assuming that the residual term is

In equation (4), p, r, and q are the length of lags for the ARCH terms, asymmetric terms, and GARCH terms, respectively. ω is an intercept,

Equations (3) and (5) use the maximum likelihood (MLE) method to estimate the parameters:
In equation (5), ω is an intercept,
Extended Model Under Information Set of Daily Trading Activity
This study explores the relationship between the USDX’s return rate, daily trading activity, and exchange rate changes, and the Monday effect and the financial crisis on the conditional variance. Equation (3) joins the trading activity variables, and equation (5) adds dummy variables for the Monday effect and 2008 financial crisis. The equations are expressed as:
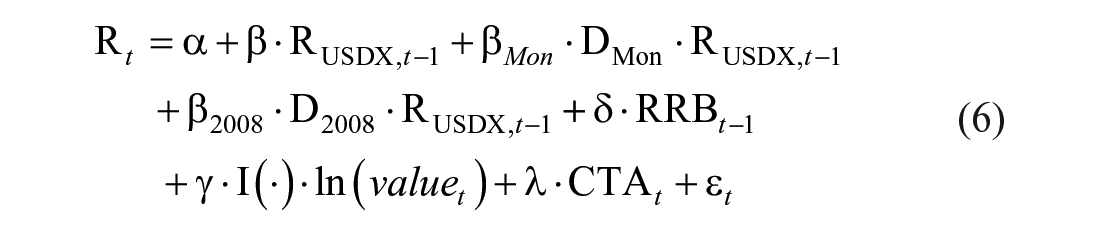

In equation (6)—because foreign exchange trading can be based on an appreciation or depreciation trend—
In equation (6), γ is the coefficient of trading activity. When γ is positive, the depreciation (appreciation) of the USD/TWD spot rate increases as the exchange rate market activity increases. This definition supports the argument that the absolute change rate of the USD/TWD currency pair (
Adjustment Intraday Spot Exchange Rate Model: Opening-To-Closing Period
We further explore the relationship between the closing rate on the t−1th trading day and the opening rate on the tth trading day (

where:
Equation (8) is the conditional volatility equation (7), which together with the use of MLE, was used to estimate the parameters. In Equations (8) and (7), the results of the estimated parameters are used to explore the relationship between the adjustment rates in the daily intraday trading period from opening to closing. If ρ > 0 (ρ < 0), then the adjusted past closing-to-opening rate (
Empirical Results
Figure 2 shows the statistical graphs for the sample of 4,449 data sets from the 2nd of January 2001 and the 31st to October 2018. The line graph in Figure 2(a) shows the bimodal distribution range of the USD/TWD (28.8–35.2). In Figure 2(e), the line graph of the daily USDX closing rate ranges from 68 to 113, with most values between 70 and 94. The spike graph in Figure 2(b) shows that most of the daily change rates of USD/TWD are between −1% and +1%, and not exceeding ±3%, although the daily change rate of the USDX fell over 2% to −4.107% on March 19, 2009, as indicated in Figure 2(f). The daily change rates of the USDX are slightly higher than those of the daily USD/TWD spot rates. Figure 2(c) shows that most of the daily trading values of USD/TWD on the TFEM lies between 500 and 1,000 (USD 1 million), while the daily trading value in TWD during the 2008 financial crisis was larger. Finally, it can be seen from the dot plot graph in Figure 2(d) that, during the period from 2007 to the end of 2015, the ratios of the real body were not uniformly distributed in 2007, but rather concentrated between 0 and 0.75; most of the values fell in the range from 0.0 to 0.5, during 2011 to 2015.

Statistics graph.
Table 1 lists the results of the summary statistics and Augmented Dickey-Fuller (ADF) tests. The mean USD/TWD (
Descriptive Statistics (Observations = 4,449).

Note. This table reports the descriptive statistics for a sample of 4,449 from 2 January 2001 and 31 October 2018. In part A,
and ** represent significance at the 5% and 1% levels, respectively.
represent significance at the 5% using the result of ANOVA tests.
The mean of the daily USD/TWD rate change during the study period indicated appreciation (
In Table 1, one-way ANOVA was used to determine whether there was a significant difference in the average level of these study variables between groups, such as Monday versus non-Monday trading days, and the 2008 financial crisis versus non-2008. There was a significant difference, at the 5% level, in the mean of the close rate between the 2008 financial crisis and non-2008 (mean
Table 2 shows the correlation matrix for correlations among
Correlations Matrix.
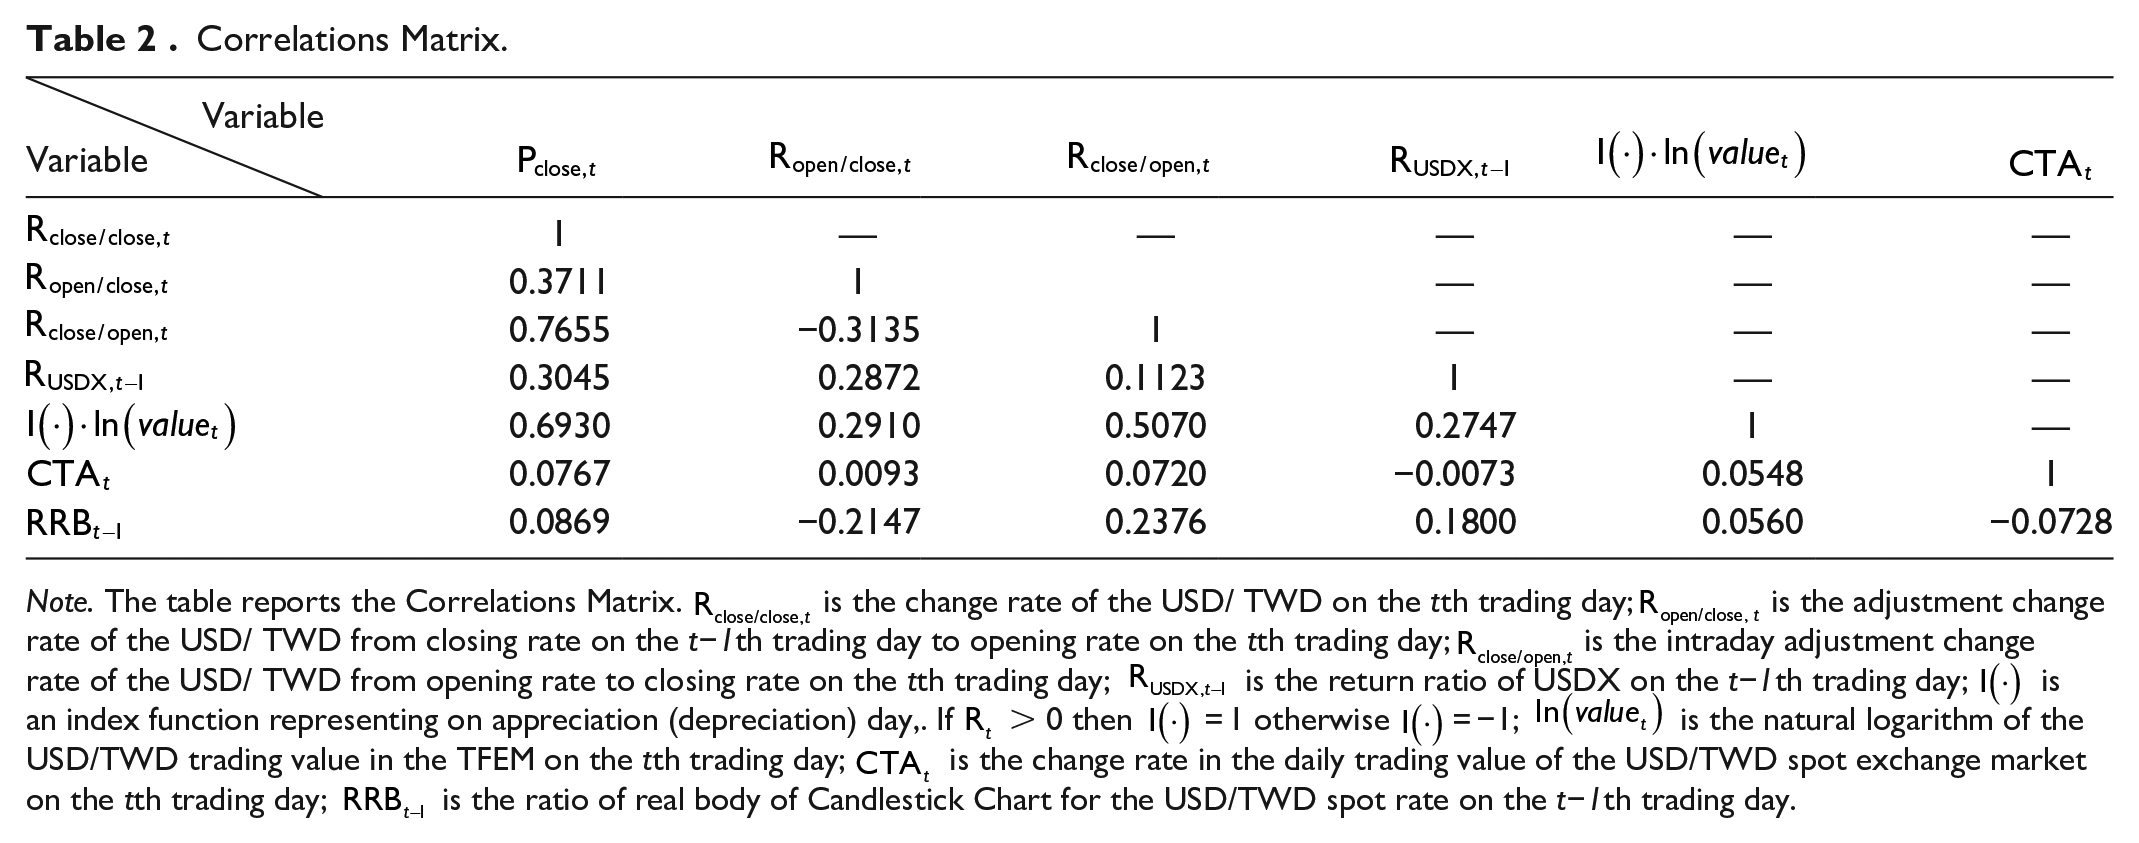
Note. The table reports the Correlations Matrix.
Table 3 shows results using the ratio of the international USDX return and the ratio of the real body of the daily candlestick chart for the previous day as the explanatory variable of the daily USD/TWD spot rates; the parameter estimation results of the model were carried out in OLS without consideration for the heterogeneity of model residuals. Then, considering the heterogeneity of model residuals and using the GJR-GARCH (1, 1) model, conditional volatility was captured. Table 3 shows the regression models A1, B1, and C1. The variance inflation factor (VIF) was employed to test the multicollinearity of the explanatory variables in the multiple regression equations. Generally, a VIF of greater than 4 represents multicollinearity. In model A1,
The Results of Estimated Parameters in Six study Models Under Three Change Rates of USD/TWD Spot Exchange Rate.

Note. This table reports the results of estimated parameters in six study models. The models examine on the relationships between the US-dollar index return, the trading activity, uncertainty and the change ratio of the USD/TWD. The dependent variable,
and ** represent significance at the 5% and 1% levels, respectively.
In model A1 equation (2),
Based on the results of the ARCH test, Model A1 was used as a conditional variance model to capture the heterogeneity of volatility, and the estimated parameters of Model A2 were estimated by MLE. In model A2 equations (2) and (5), in Table 3, the results of the estimated ARCH test were p > 0.10, offering no support for heterogeneity in the residuals of the model. In the conditional volatility of the GJR-GARCH (1, 1) model, at a significance level of 1%, the coefficient of the ARCH item
In Table 3, the opening price was adjusted from the closing price on the t−1th trading day to the opening price on the tth trading day (
In Table 3, the price adjusted for the opening-to-closing price on the tth trading day (
Model D1 (daily change rate of USD/TWD as the dependent variable) is from the original equation (3), adding the change rate of trading value (
In Model D1, at a significance level of 1%, the BETA values of the International USDX (β), the Monday (
Considering the heterogeneity of the residual item in the conditional volatility, the estimated parameters of Model D2 were obtained using equation (7), and the parameters of the mean equation were the same as the Model D1 estimations. This supported the BETA value of the International USDX (β), and the parameters of the real body ratio of the candlestick chart ((δ = 0.0165). The market trading activity variables (γ), such as trading activity (λ), exhibited a significant positive relationship with the daily USD/TWD rates. The BETA values of the International USDX traded on Mondays (
On the right half of Table 4, the previous closing to opening price adjustments (
The Results of Estimated Parameters in Four Study Models.
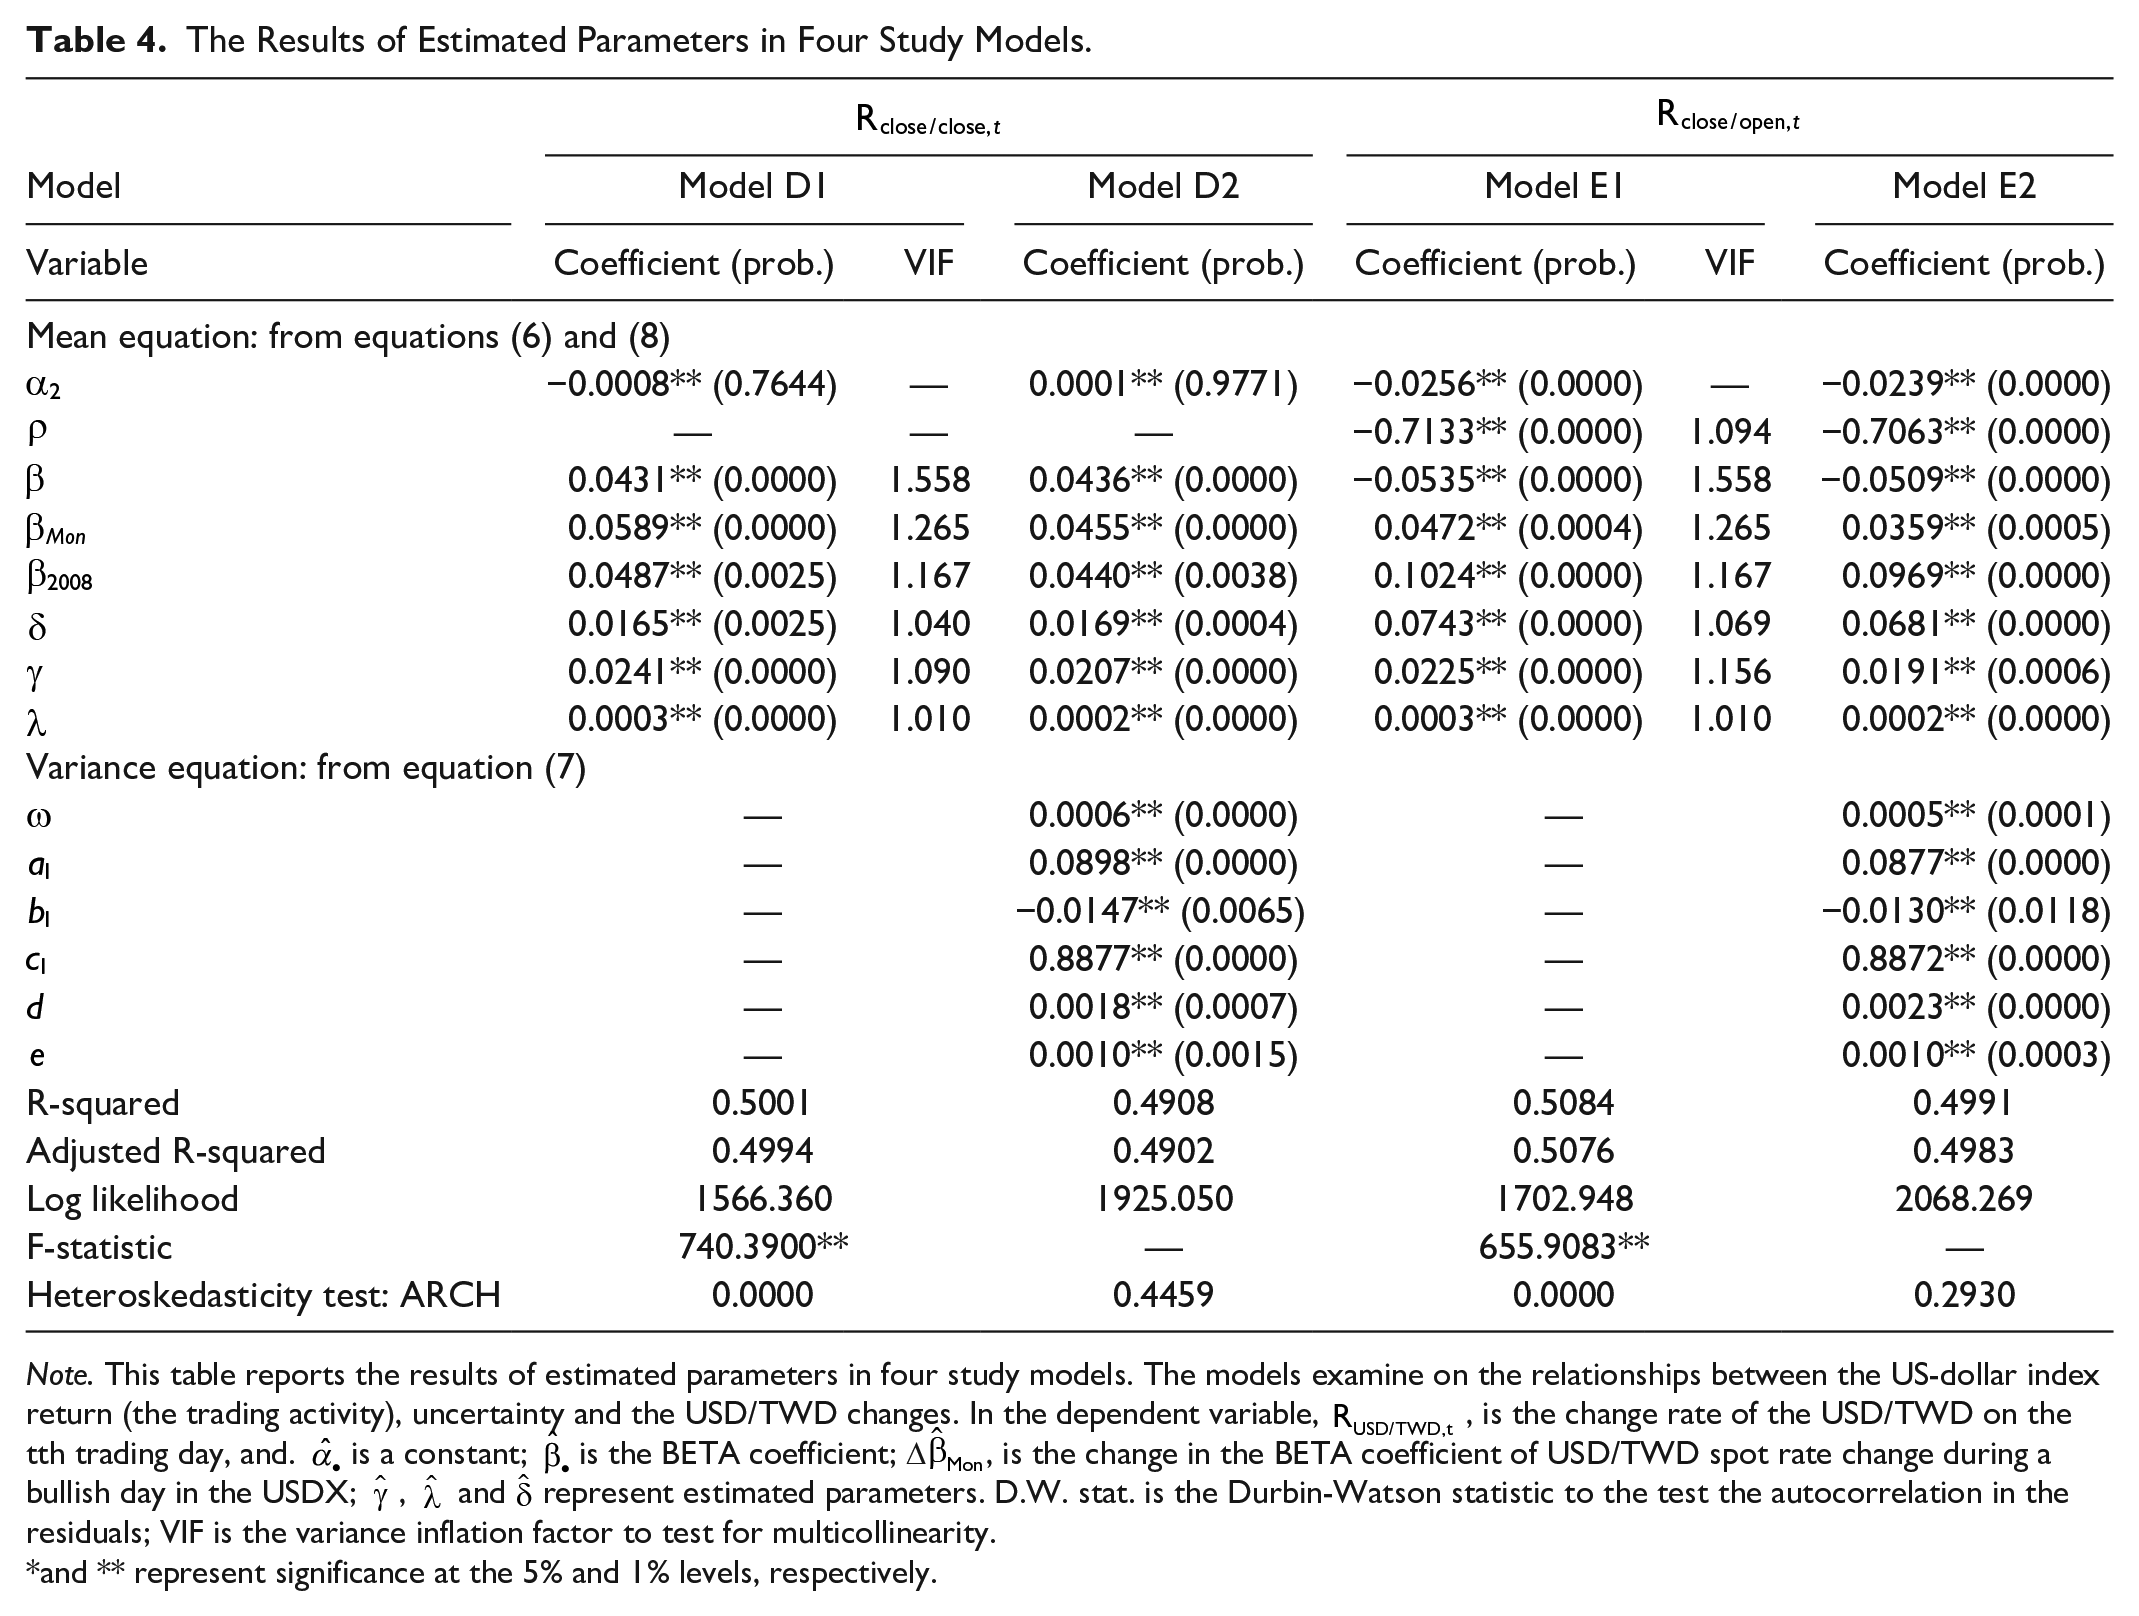
Note. This table reports the results of estimated parameters in four study models. The models examine on the relationships between the US-dollar index return (the trading activity), uncertainty and the USD/TWD changes. In the dependent variable,
and ** represent significance at the 5% and 1% levels, respectively.
In Models E1 and E2, the ρ values of −0.7133 and −0.7063 were significantly negative, representing the opening-to-closing price adjustment (
Discussion
To establish an explanatory model for exchange rate changes and volatility, this study used the return on overseas USDX of the previous trading day, as well as the real body ratio of the daily candlestick chart of the exchange rate of the previous day, and the daily trading activity to explain the causal factors of exchange rate changes. The results of these models show that part of the USD/TWD spot rate change had a significant relationship to information about changes in the USDX overseas from the previous trading day, thus proving the important reference position of USDX in the TFEM. It was found that the impact of trading information from overseas USDX on the rate adjustment of the USD/TWD spot rate was not limited to the exchange rate adjustment at the opening time, but had a sustained positive effect on the adjustment of the intraday spot exchange rate during the opening-to-closing period.
Moreover, a significant positive relationship between the ratio of the real body of the daily candlestick exchange rate chart from the previous day was proven, rendering it of some reference value to support the analysis of the exchange rate change by the ratio of the real body of the daily candlestick chart in technical analysis. This result confirms that the technical analysis, based on the candlestick chart, can be applied to TFEM. The daily trading value, with consideration for the direction of depreciation and appreciation, showed positive correlations among daily trading value, rate of daily trading value change, and exchange rate change; with these models including the variables of trading activity, we greatly improved the interpretation ability of models of exchange rate changes and indicated the importance of their related trading activities.
The USD/TWD spot rate indicated a lower average daily trading value, and the change ratio of trading value was negative on Mondays, which may be related to the closure of foreign exchange markets in Europe and America at that time. The BETA value of the USDX had a positive effect and a higher level on Mondays, so the sensitivity of the information of international transactions in the transmission time persists for longer, and there will be a past holiday effect on the exchange rate change. In the financial turmoil of 2008, there were significantly higher average daily trading values, with the USD/TWD spot rate undergoing an appreciation effect. In 2008, especially, there was a significant decline in the risk of international USDX changes, with a more stable TWD exchange rate to the USD compared to other important international currencies.
Whether the daily exchange rate or the daily intraday exchange rate changes, the volatility of the USD/TWD spot rate exhibits heterogeneous, clustered, and asymmetric qualities; the news of the depreciation of the TWD in the exchange rate adjustment was significantly more sensitive than corresponding new on currency appreciation. The trading days during the 2008 financial crisis and on Mondays for exchange rate volatility indicated positive effects and significantly larger volatility.
Finally, from our research findings on the TFEM, there has long been a special phenomenon; the closing rate was lower than the opening rate—the closing rate exhibited appreciation compared to the opening rate. Whether this phenomenon was related to the price-making behavior of market markers on the exchange rate, or the market size of currency transactions was too small, requires further study.
Conclusions
This study does not consider the trading costs of exchange rates, central bank adjustments to monetary policy, interest rate changes, and other economic factors that may affect exchange rate movements. We focused on the explanatory power and direction of exchange rate changes in the USDX, the indicators of the candlestick chart, and currency trading activity. Based on empirical results, we found that daily trading activity was the primary explanatory factor for the change in the USD/TWD spot rate on the TFEM and that daily exchange rate changes were mainly caused by the trading behavior of participants. This study proved the important reference position of the USDX on the TFEM and found that the impact of information by USDX return rate on exchange rate adjustment was not immediate, indicating the weak efficiency of the TFEM. Moreover, our model results were verified by the defined candlestick line indicator, which confirmed that technical analyses based on the candlestick chart can be used for the TFEM.
The daily USD/TWD exchange rate changes and volatility existed in the Monday and 2008 financial crisis effects. These two effects caused the daily USD/TWD exchange rate in TFEM to show a significant depreciation trend, and the daily volatility was significantly larger. Finally, this study supported the daily volatility of the USD/TWD spot rate with heterogeneity, clustering, and asymmetry. The asymmetry of the volatility of the USD/TWD spot rate was different from that of the UK Pound and Japanese Yen, but the same as that of the Swiss Franc, Canadian Dollar, Australian Dollar, and Singapore Dollar (Kwek & Koay, 2006).
Footnotes
Declaration of Conflicting Interests
The author declared no potential conflicts of interest with respect to the research, authorship, and/or publication of this article.
Funding
The author received no financial support for the research, authorship, and/or publication of this article.
Research Involving Human Participants and/or Animals: Ethical Approval
This article does not contain any studies with human participants performed by any of the authors.