
Abstract
The primary objective of this paper is to empirically examine the nature and statistical significance of the news effect on conditional volatility of unpredictable components of stock returns. Daily stock return data of 12 local and multinational companies on Dhaka Stock Exchange Ltd., Bangladesh, for the period 1990 to 2011 were used in this study. The likelihood of asymmetric effects of news on conditional volatility was tested using a set of diagnostics under the Generalized Autoregressive Conditional Heteroscedasticity (GARCH) framework. The results fail to reject the null hypothesis of symmetric effects, thereby suggesting that the conditional volatility of unpredictable components of stock returns is affected equally by positive and negative news. The robustness of the results was further checked by using three widely used asymmetric models, namely exponential GARCH (EGARCH), Glosten, Jagannathan & Runkle (GJR)-GARCH, and a partially non-parametric Autoregressive Conditional Heteroscedastic (PNP-ARCH) models. Yet again, the results do not provide any evidence of significant asymmetric effects in the volatility process. In addition, the descriptive results confirm the stylized facts of unpredictable return series such as non-normal distribution, time variant conditional volatility, and persistence in return volatility. Collectively these findings, perhaps, indicate the adequacy of the GARCH (1,1) model in representing the data generating process. A number of regulatory and behavioral factors that are anticipated to be accountable for the absence of asymmetric news effects are underlined. Finally, some policy implications of the results and possible extensions of the present paper are also conveyed.
JEL codes: G10, G12, G14
Introduction
With the growing interest in financial markets worldwide, empirical investigation of the manifestation and statistical significance of the effects of bad and good news on conditional volatility of stock returns is of practical importance for policy makers and financial market participants. With particular reference to Bangladesh stock market, the importance of such investigation cannot be overlooked as the effective functioning of the stock market is pivotal to the country’s economic growth. The inherent link between a well-functioning stock market and the country’s economic growth is not only stipulated in the vision and mission statements of the Dhaka Stock Exchange Ltd. (hereafter, DSE), Bangladesh (https://www.dsebd.org/, accessed July 28, 2021) but its statistical significance is also observed by Banerjee et al. (2017).
While the asymmetric effects of bad and good news were documented in many studies, disagreement on the results also prevails in the financial market literature (see the review of relevant literature below). The asymmetry is stemming from the assertion, as indicated by Zivot (2009), that negative news generates more volatility in stock returns than that of its equal-sized counterpart. Engle and Ng (1993) noted that this asymmetric phenomenon is popularly labeled as “leverage effect”- a term first coined by Black (1976) and subsequently by Christie (1982).
During the last decade or so, several studies have investigated a number of pertinent issues regarding the functioning of DSE, Bangladesh. Examples of such issues include non-normality, volatility clustering, presence of autoregressive conditional heteroscedasticity (ARCH) and generalized autoregressive conditional heteroscedasticity (GARCH) effects in stock returns (Aziz & Uddin, 2014; Basher et al., 2007; Bose & Rahman, 2015; Siddikee & Begum, 2016), role of trading volume in reducing stock return volatility (Bose & Rahman, 2015), role of regulators and return volatility (Rahman & Golam Moazzem, 2011), impact of lock-in and circuit breaker measures in curbing return volatility (Basher et al., 2007), impact of circuit breaker measure in halting trade (Chowdhury & Masuduzzaman, 2010), effect of dividend policy on stock prices (Masum, 2014), day-of the week effects in stock returns (Bose & Rahman, 2015; Rahman, 2009), herding behavior among traders and seasonal influence (Ahsan & Sarkar, 2013; Bepari & Mollik, 2009), relationship between financial leverage and stock returns at firm level (Abdullah et al., 2015), stock market reaction to dividend announcement (Hossain et al., 2006; Rahman et al., 2012), market and informational inefficiency (Afzal & Hossain, 2011; Arefin & Rahman, 2011; Joarder et al., 2014; Mobarek et al., 2008), disparity in trading behavior of investors with respect to gender, age and education level (Arifuzzaman et al., 2012), prohibition of short-selling and market inefficiency (Sochi & Swidler, 2018), among others.
The selection of Bangladesh stock market as a case study is prompted by the country’s economic potential depicted through its highest average GDP growth record (about 6.04% with SD = 1.18) in South Asia during 2000-2020 (International Monetary Fund & World Economic Outlook Database, April 2021) which is projected to be even higher (7.1%) in 2023 by the Asian Development Bank (Bangladesh and ADB, Asian Development Bank accessed 12 April, 2022). Furthermore, the recognition as a frontier market by the International Finance Corporation (IFC) since 1997 (Gilbert, 2019), its ambition to achieve the status of a higher middle-income country by 2031 (Bangladesh Overview: Development news, research, data, World Bank, accessed April 16, 2022) and government’s concerted efforts to make the country as an investment destination for foreigners by making necessary regulatory changes and offering various incentives, etc. (Islam, 2014) make the present case study selection very much compelling.
However, to the best the of authors’ knowledge, there is a genuine dearth of empirical research in the country on the empirical assessment of news effects on stock return volatility using sophisticated econometric models. A recent study by Arefin and Ahkam (2017) used asymmetric GARCH models to ascertain volatility transmission between commercial banks, non-bank financial institutions and insurance companies of Bangladesh and found asymmetric effects only in case of non-bank financial institutions. However, the present paper differs from Arefin and Ahkam (2017) in terms of both data range and empirical approach. It considers traded stocks from various industry categories, includes firm-level data with longer time span, and more importantly, ensures robustness of empirical results by employing a set of diagnostic tools and sophisticated econometric models following Engle and Ng (1993). Furthermore, the investigation of the asymmetric relationship between returns and implied volatility for DSE has been lacking from global studies on stock market of emerging economies. For instance, DSE was not considered in their comparative global study of developed and emerging markets by Bekiros et al. (2017).
In comparison with other studies of emerging markets (see the review of literature section below), the novelty of the present paper lies with the use of firm-level data rather than aggregated stock index. Furthermore, in evaluating the extent and nature of news effects in the emerging markets, the present paper complements the existing asymmetry volatility literature of emerging markets by adopting an alternative non-parametric modeling procedure proposed by Engle and Ng (1993) to estimate the news impacts function directly from the data.
The present paper has relevance from academic, policy and industry perspectives. From an academic perspective, the examination of the nature of news effects on stock return volatility involving DSE would not only fill the existing knowledge gap in the context of financial market research in the country but would also complement the existing regional and global literature, specifically the emerging markets. The results from the empirical approach adopted in this paper would also provide useful hint to the choice of appropriate techniques in carrying out further research on return volatility for DSE. From a policy perspective, the present paper is useful for regulatory authority as the sensitivity of DSE to global shocks was observed by Kumar and Dhankar (2009). Additionally, the provision for an open investment opportunity for foreign investors (https://www.dsebd.org/, accessed July 28, 2021) necessitate frequent scrutiny of return volatility for taking appropriate actions to stabilize the market. This study also contributes to the practical realm as it provides both local and foreign traders with the knowledge of return-volatility relationship and, hence, enables them to take appropriate portfolio decisions to minimize risks.
In view of the above discussion and with particular reference to Bangladesh capital market, the present paper examines the following two null hypotheses:
Hypothesis 1: The individual return series and their unpredictable component are normally distributed with time-invariant conditional variance.
Hypothesis 2: The volatility of unpredictable stock returns is affected equally by positive and negative news (i.e., symmetry).
Brief Market Profile
The Dhaka Stock Exchange Ltd. (DSE)—formerly known as East Pakistan Stock Exchange Association Ltd. in 1954, East Pakistan Stock Exchange Ltd. in 1962 and Dacca Stock Exchange Ltd. in 1964—has been guided by three main undertakings such as the adoption of technological innovation, contribution to economic growth, and introduction of corporate governance. As of July 28, 2021, there were 610 companies in DSE. In 2020, the market operated for 208 days and the highest market capitalization and total turnover were 3,395,510.63 million Taka (1 USD ≈ 85.20 Bangladeshi Taka, on September 7, 2021) and 1,349,812.24 million Taka, respectively. Bangladesh Securities and Exchange Commission (BSEC) established under the BSEC Act, 1993 is the responsible authority for Bangladesh capital market. DSE is currently managed by a 12-member Board of Directors and a senior management team of eight-members (https://www.dsebd.org/, accessed July 28, 2021).
Notable changes have occurred to the DSE during the last two decades starting with the introduction of automated trading in 1998. During the recent decade the DSE has become a correspondent member of World Federation of Exchanges in 2012 leading to full membership in 2017 (Dhaka Stock Exchange becomes permanent of World Federation of Exchanges (bdnews24.com), accessed September 27, 2022), transformed into a demutualized exchange in 2013, signed an agreement with S&P and Dow Jones to launch Shariah Index in 2013 (Search | S&P Dow Jones Indices (spglobal.com), accessed September 27, 2022), and achieved ISO 9001:2008 in 2016 (Dhaka Stock Exchange becomes permanent of World Federation of Exchanges (bdnews24.com), accessed September 27, 2022). In September 2018, a consortium of Shenzhen Stock Exchange and Shanghai Stock Exchange joined Dhaka Stock Exchange as strategic investors and 25% of DSE share was transferred to the consortium. A representative of the consortium now serves as a member of the DSE Board of Directors (https://www.dsebd.org/ accessed July 28, 2021).
According to the DSE Annual Report 2018, market capitalization of the stock exchange stands at USD 38.86 billion which accounts for 14.53% of GDP. It is similar as percentage of GDP to other small exchanges in the region such as Colombo Stock Exchange (16.92%) and Pakistan Stock exchange (18.21%). However, some other stock exchanges in the region have higher capitalization such as Indonesia Stock Exchange (44.60%), BSE India (72.20%), Philippine Stock Exchange (75.5%), and The Stock Exchange of Thailand (107.00%). With reference to the structure of market capitalization, it is observed that equities represent about 85% of the total with government treasury bond accounting for about 14% while mutual funds and corporate bonds playing a very negligible role. Chowdhury and Rahman (2004), Basher et al. (2007), and Hassan and Chowdhury (2008) provided detailed synopsis of the Bangladesh capital market and the DSE. Further details on DSE can be obtained from DSE website (at http://www.dsebd.org/).
Review of Relevant Literature
A number of studies, involving both developed and emerging financial markets, find evidence of asymmetric effects of news on return volatility. Examples of such studies include Pagan and Schwert (1990) and Dzieliński et al. (2018) for US market, Engle and Ng (1993) for Japanese stock market, Rabemananjara and Zakoian (1993) for French stock market, Henry (1998) for Hong Kong stock market, Koutmos (1999) for six emerging Asian stock markets namely Korea, Malaysia, Philippines, Singapore, Taiwan, and Thailand, Yeh and Lee (2000) for Taiwan and Hong Kong stock markets of greater China, Hou (2013) for Chinese stock markets, Apergis and Eleptheriou (2001) for the Athens stock market, Blasco et al. (2002) for Spanish stock market, Alberg et al. (2008) for the Tel Aviv stock exchange, Charles (2010) for France, Germany, USA and Japan stock markets, Tanha and Dempsey (2015) for Australian stock market, and Banumathy and Azhagaiah (2015) for Indian stock market. In examining the presence of volatility feedback and leverage effects for a set of 16 developed and developing country markets for the period January 2001 to October 2014, Jin (2017) claimed that the inverse association between stock returns and volatility is primarily caused by the leverage effect and the association was found to be intensified during market unrest.
Nevertheless, non-uniformness in the extent of and the absence of asymmetric effects are also evident in the empirical literature. For instance, Brooks (2007) found that the extent of asymmetry in conditional volatility vary across the set of emerging markets, with the highest average (3.817) for the Latin American markets followed by Asia (2.179), Europe (1.806), and the Middle Eastern and African markets (1.197) and with no apparent link to market size measured by market capitalization. In ascertaining volatility transmission between commercial banks, non-bank financial institutions and insurance companies in Bangladesh Arefin and Ahkam (2017) observed a lack of asymmetric effects in case of commercial banks and insurance companies. In a global case study involving 20 developed and emerging markets categorized into advanced, Asian, Latin American and Europe and South African, Bekiros et al. (2017) noted the presence of asymmetric phenomenon (excluding Australia and China) and it varied in magnitudes across regions. Bekiros et al. (2017) also observed that market reaction to negative returns differed within Asian markets and they attributed such finding to cultural dissimilarities and a lack of institutional uniformity.
In examining asymmetry in conditional volatility of unexpected stock returns of the greater China stock markets, Yeh and Lee (2000) found no evidence of asymmetry for the Shanghai and Shenzhen markets. Similar findings are also reported by Bahadur (2008) for Nepal, Mun et al. (2008) for Kuala Lumpur Composite Index, Alagidede and Panagiotidis (2009) for Morocco and Zimbabwe, Alagidede (2011) for Egypt and Tunisia, Jayasuriya et al. (2009) for Brazil, Chile, Indonesia, Pakistan, and Taiwan, Charles (2010) for UK, and Oskooe and Shamsavari (2011) for Iranian stocks. In analyzing volatility of Malaysian stock market Lim and Sek (2013) found that symmetric GARCH model performed better than their asymmetric counterpart models in normal economic period, while the opposite held true for crisis periods. In examining the impact of macroeconomic news (comprising inflation, unemployment and trade deficit etc.) on exchange rates (i.e., dollar-Mark and dollar-Yen) returns-volatility relation using a high-frequency data Pearce and Solakoglu (2007) found no persuasive evidence of asymmetric news effects.
Various reasons have been cited in the literature to interpret the asymmetry phenomenon. Poterba and Summers (1986), Campbell and Hentschel (1992), and Awartani and Corradi (2005) provide indication of “volatility feedback” that asserts a positive association between an anticipated volatility and equity return. Wu (2001) found that the leverage effect and volatility feedback effect both contributed to asymmetric volatility. Bekiros et al. (2017) noted “behavioral heterogeneity” of economic agents (such as irrationality, extrapolation bias etc.), Lo and MacKinlay (1988) speak of non-synchronous trading, firm size effects are noted by Cheung and Ng (1992), and market size (measured by average market capitalization) by Brooks (2007). Based on the analysis of daily stock return from 49 countries, Talpsepp and Rieger (2010) observed that the extent of economic development, the ratio of market capitalization to GDP and investors’ sentiment contributed to volatility asymmetry. In case of Bangladesh stock market Chowdhury et al. (2014) found evidence of significant positive influence of investors’ sentiment on portfolio returns. Andrei and Hasler (2015) found positive association between investors’ attention to news and stock-return volatility and mentioned that low attention to news generates low return volatility as low attention results in slow learning that leads to slow integration of new information into market prices. Dzieliński et al. (2018) found a positive association between asymmetry in stock return volatility and investors’ asymmetric attention to good and bad news and heterogeneity of opinion.
In analyzing reactions to local and global macroeconomic policy announcements (comprising GDP, trade balance, inflation, unemployment etc.) of mature (i.e., US and Germany) and emerging bond markets (such as Brazil, Mexico, Russia, and Turkey), Nowak et al. (2011) found close links between emerging and mature bond markets and evidence of asymmetric effects of macroeconomic announcements, both local and global, on volatility. They also pointed out that emerging markets are slow to integrate new information compared to mature markets. McKenzie (2002) documented asymmetry for exchange rates caused by the intervention of the Reserve Bank of Australia in the foreign exchange market.
In addition, investors’ overconfidence (Dumas et al., 2009) and their under- and over-reaction to good and bad news (Barberis et al., 1998) could also be offered as reasons for asymmetric volatility. For example, Boubaker et al. (2015) found evidence of short-term overreaction to specific events such as regional tensions and terror attacks in case of Egypt stock market. Influence of investors’ sentiment on returns-volatility relation is also observed by Uygur and Taş (2014) and Bahloul and Bouri (2016).
Methodology
Data
Data for daily average closing price for 12 selected relatively actively traded stocks with the trading record ranging from 172 to 245 days per annum from DSE covering the period January, 1990to December, 2011 are used in this study. It should be noted that random selection of stocks was not possible as majority of stocks were not actively traded and hence would fail to generate high-frequency data required for modeling volatility. The selected stocks comprise of various spectrum of companies (local as well as multinational) dealing with automobiles and related parts, electrical and other industrial products, pharmaceutical products, export-import industrial products, insurance, mutual fund, medical and industrial products supply, and chemical products. The list of selected stocks (with the serial number) is as follows: Aftab Automobiles Limited (S1), Ambee Pharmaceuticals Limited (S2), Atlas Bangladesh Limited (S3), Bangladesh Export Import Company Limited (S4), Bangladesh General Insurance Company Limited (S5), Bata Shoe Company (Bangladesh) Ltd. (S6), Boc Bangladesh Limited (S7), Eastern Cables Limited (S8), Kohinoor Chemical Company (Bangladesh) Ltd. (S9), Quasem Drycells Limited (S10), Sixth ICB Mutual Fund (S11), and Usmania Glass Sheet Factory Limited (S12).
The selection of stocks is constrained by the need of high frequency data for GARCH modeling. With that in mind, the modeling exercise of the present paper set a minimum of 100 trading records per annum for stocks for the entire study period. The initial scrutiny of the data set revealed that in the first year (1990) only 26 stocks out of 109 had greater than 100 observations. Although the number of stocks in the collected data set increased over time (277 stocks in 2011) and the stocks demonstrated increasing trading activity (all but 14 having 100 or more observations in 2011), any selected stock that did not have at least 100 trading records per annum for the entire data period could not be included in the selection. These requirements are fulfilled by the 12 stocks used in the study.
The sample period of 1990 to 2011 covers various economic episodes witnessed by DSE. In addition to normal period noted by existing studies (e.g., Bose & Rahman, 2015) there were two drastic price falls in 1996 and 2011 (Siddikee & Begum, 2016) and the global financial crisis in 2008 (Rastogi, 2014), covering some very significant events in the stock market. The sample period also spans over four consecutive 5-year plans in Bangladesh. It is believed that the coverage of various significant economic episodes in existing data provides a large enough sample period to allow the unfolding of any asymmetric behavior which is the subject matter of the study. However, the investigation of any potential effect of an extension of the sample period is left for future research.
The return series (Rt) for each stock “i” is calculated using “average closing price” as follows: Rit = 100*ln(Ρit/Ρit−1). Further characteristics of the calculated return series are presented in Table 1.
Summary Statistics of the Return Series
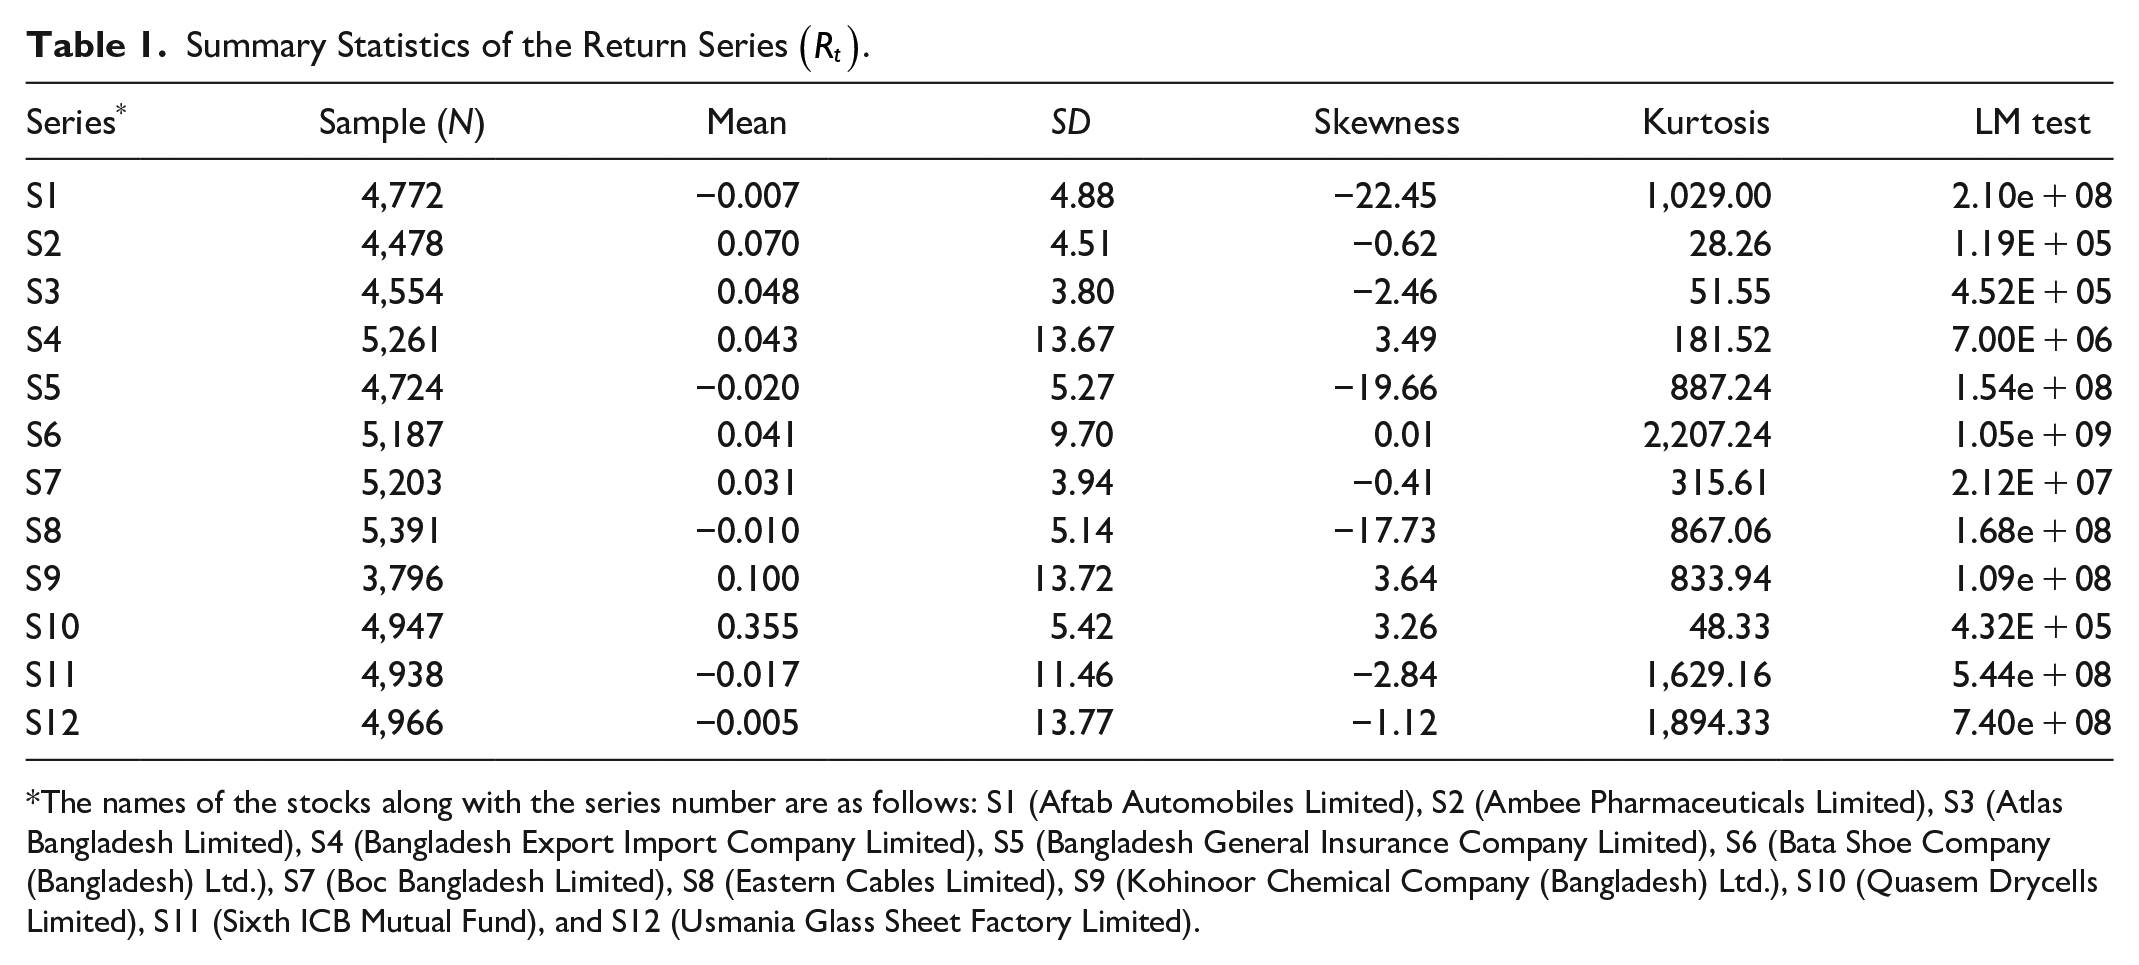
The names of the stocks along with the series number are as follows: S1 (Aftab Automobiles Limited), S2 (Ambee Pharmaceuticals Limited), S3 (Atlas Bangladesh Limited), S4 (Bangladesh Export Import Company Limited), S5 (Bangladesh General Insurance Company Limited), S6 (Bata Shoe Company (Bangladesh) Ltd.), S7 (Boc Bangladesh Limited), S8 (Eastern Cables Limited), S9 (Kohinoor Chemical Company (Bangladesh) Ltd.), S10 (Quasem Drycells Limited), S11 (Sixth ICB Mutual Fund), and S12 (Usmania Glass Sheet Factory Limited).
Empirical Model
While the ARCH model by Engle (1982) and Engle and Bollerslev (1986), and the GARCH model by Bollerslev (1986) are successful in capturing some of the empirical regularities (e.g., volatility clustering and thick-tailed characteristics) of stock returns (Bera & Higgins, 1993; Bollerslev et al., 1992) the failure of such models in capturing asymmetric feature of volatility in stock return is well documented (Engle & Ng, 1993; Glosten et al., 1993; Nelson, 1991; Pagan & Schwert, 1990). To rectify such failure various refinements are proposed that include exponential GARCH (EGARCH) by Nelson (1991), threshold GARCH (TGARCH) by Rabemananjara and Zakoian (1993) and Zakoian (1994), GJR-GARCH proposed by Glosten et al. (1993), and a partially non-parametric ARCH (PNP-ARCH) models suggested by Engle and Ng (1993), among others. In these models the impact of asymmetric or leverage effects are revealed through the use of so-called news impact curve. The conditions and specifics of estimating news impact curve under the above-mentioned asymmetric GARCH and PNP-ARCH models can be found in Engle and Ng (1993) and Zivot (2009).
It should be mentioned that the performance superiority—measured by the predictive power—cannot be assigned to one particular asymmetric GARCH model as it is case specific. While superior performance of the GJR model of Glosten et al. (1993) was noted by Engle and Ng (1993) and Brailsford and Faff (1996), such superiority of the EGARCH model was observed by Pagan and Schwert (1990), Alberg et al. (2008) and Tanha and Dempsey (2015).
Banumathy and Azhagaiah (2015) found TGARCH (1,1) to be the best fitted model to capture asymmetry. Apergis and Eleptheriou (2001) and Henry (1998) found support for quadratic GARCH (QGARCH) and generalized quadratic ARCH (GQARCH) models respectively.
To this end, the empirical analysis adopted in this paper involves the following steps. First, a range of descriptive statistics of the return series of the selected stock is computed to examine the presence of ARCH effects. Second, the unpredictable component of the stock return series is derived by following the day-of the-week effects and autocorrelation adjustment procedures adopted by Engle and Ng (1993). The day-of-the-week effects adjustment involves the derivation of first-stage residuals by regressing each return series on a constant, and 5 day-of-the-week dummies. The adoption of this step apart from non-normal characteristics, daily stock returns may be influenced by the day-of-the-week effects as documented in several studies (see for instance, Charles, 2010; Yunita & Martain, 2012; Zhang et al., 2017, to name a few) comprising both developed and emerging markets. With particular reference to DSE, Bose and Rahman (2015) investigated the day-of-the-week effects and found some evidence of such effects. On the other hand, the autocorrelation adjustment involves the removal of potential autocorrelation problem by regressing the first-stage residual series on a constant and on the sufficient lag terms of the dependent variable. The residual series derived from the autocorrelation adjustment process is termed as the unpredictable return series (denoted as
Diagnostics for Asymmetry: The Sign and Size Bias Tests
The sign and size bias tests proposed by Engle and Ng (1993) for the unpredictable stock return series (

where,
As the sign and size bias tests are based on the residuals derived from the symmetric GARCH (1,1) process represented by equation (2), the robustness of such tests results was further checked by using the following conditional variance specifications of the EGARCH (1,1), GJR (1,1) and the PNP-ARCH models represented by equation (4), (5), and (6), respectively.
Following Bera and Higgins (1993), the conditional variance function of EGARCH (1,1) model of Nelson (1991) can be expressed as follows:

where,
The conditional variance function of the basic GJR (1,1) model can be expressed as follows (Laurent, 2009):

In GJR (1,1) formulation represented by equation (5), the dichotomous variable
Following by Engle and Ng (1993) the conditional variance function of the PNP-ARCH model is represented by equation (6) as follows:

where,
It should be noted that the threshold effects that are related to both the sign and size of shocks are incorporated in the GARCH family such as TGARCH model of Zakoian (1994) which is similar to the GJR model used in the present study. More importantly, split sample idea of threshold model is captured through the sign-biased tests based on sign and size effects of shocks of the innovation series. The JGR and PNP-ARCH models used in the present paper already contain threshold property. The issue of endogeneity arises in regression analysis when contemporaneous covariates are included in the analysis. This issue does not arise in the present context as all covariates in the conditional variance equation are exogenous in nature as they represent lagged values. The maximum likelihood estimates of the variance equations along with the corresponding standard errors were obtained by using the Berndt, Hall, Hall and Hausman (BHHH) and /or Marquardt algorithm in G@rch and Eviews (version 10) programs.
Results and Discussion
Table 1 presents a range of descriptive statistics for the daily return series of selected stocks. All series display the evidence of fat tails as the estimate of the moment coefficient of kurtosis is considerably higher than the normal value 3. For 8 out of 12 cases, there is evidence of negative skewness, while the remaining four demonstrate positive skewness. For one case (S6) the estimate of the moment coefficient of skewness is close to the normal value zero but has the highest estimate of the moment coefficient of kurtosis. The Lagrange Multiplier (LM) test results reject the null hypothesis of normality for all cases at the 1% level of significance. This infers that the distribution of all daily return series exhibits a clear departure from the Gaussian distribution. The finding is not only corroborating with the empirical evidence provided recently by Bose and Rahman (2015) in case of DSE, but is also consistent with the commonly observed phenomenon in global financial (Bera & Higgins, 1993; Bose, 1993; Jin, 2017, to name a few) and primary commodity markets (Baillie & Bollerslev, 1989; Bollerslev et al., 1992; Bose, 2004).
Table 2 presents the results of the day-of-the-week effects adjustment process. The t-test results indicate that Sunday and Monday were significant (at the 5% level) for four (S2, S3, S8, and S10) and five (S1, S3, S5, S10, S12) cases, respectively. For two cases (S3 and S10) both Sunday and Monday were significant and for only one stock (S3), Sunday, Monday, and Tuesday were significant at the 5% level. The results of the F-test (a joint-test) reveal that the presence of day-of-the-week effects for five stocks (S1, S3, S5, S8, and S10). Therefore, the removal of the day-of-the-week effects, as proposed by Engle and Ng (1993), seems appropriate in deriving the unpredictable component of the stock return series. While the presence of day-of-the-week effects in case of DSE corroborates with the findings of other financial market studies comprising both developed and emerging economies (Engle & Ng, 1993; Yunita & Martain, 2012; Zhang et al., 2017), the pattern of the day-of-the-week effects is dissimilar to Bose and Rahman (2015). Also, the results revealed that for the significant cases the coefficient estimates were negative and greater in absolute value compared to insignificant cases.
Regression Results of Day-of-the-Week Effect Adjustment Procedure.
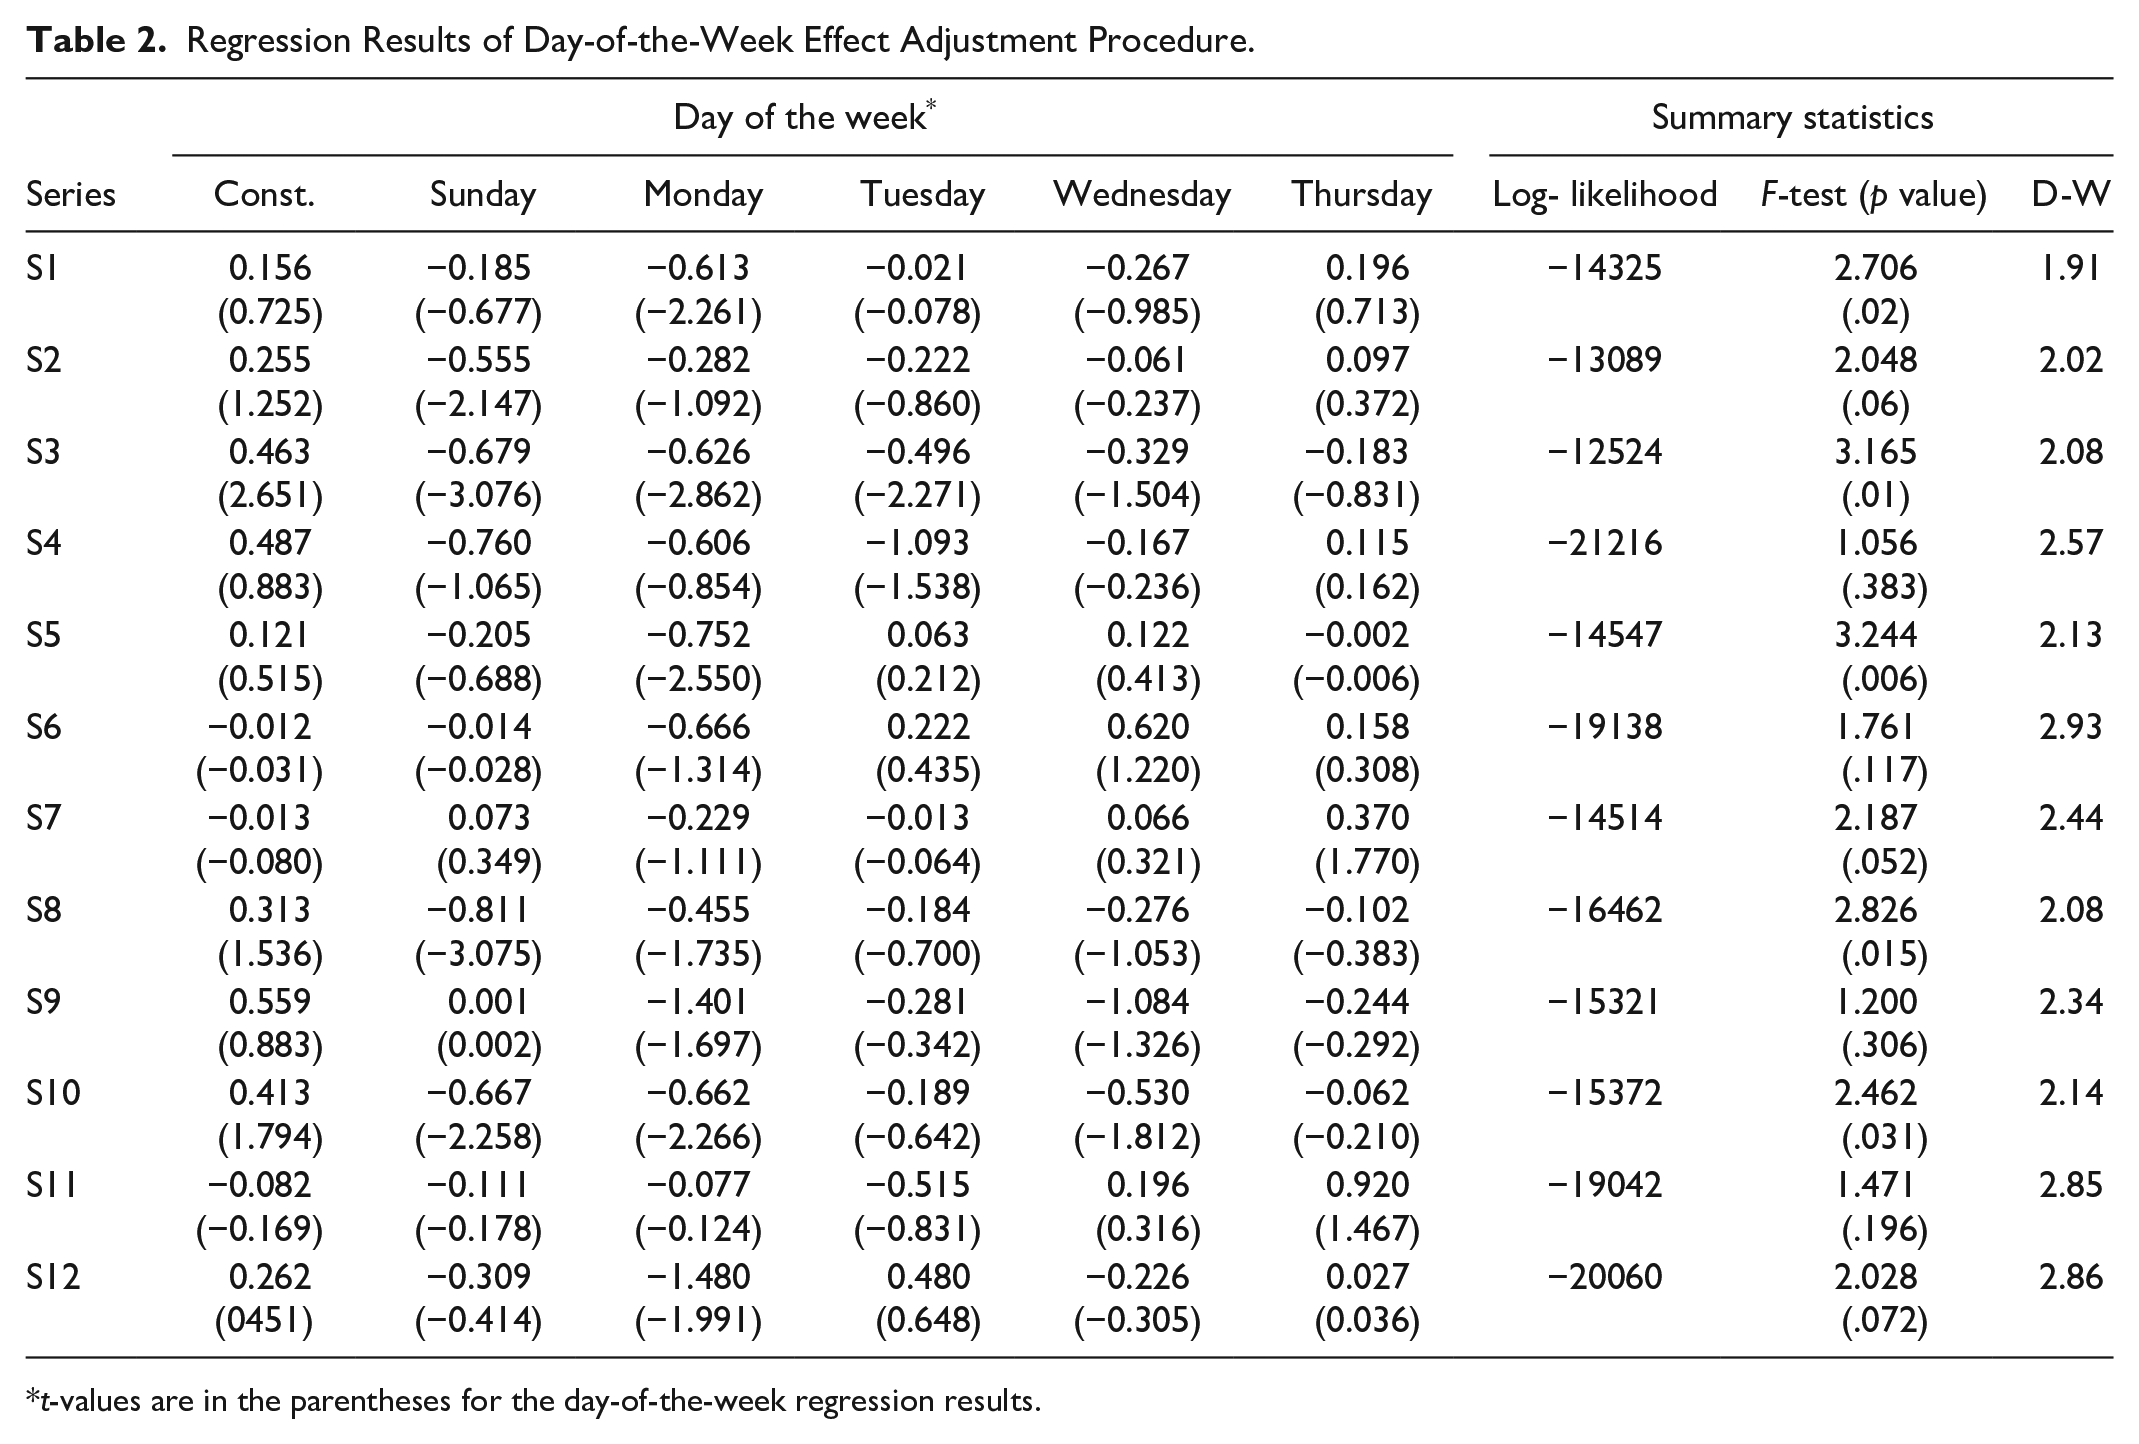
t-values are in the parentheses for the day-of-the-week regression results.
The results of the autocorrelation adjustment are presented in Table 3. Based on the Q(k)-test (Ljung-Box-Pierce test statistic which has an asymptotic chi-squared distribution of with k degrees of freedom) of lag-order up to 12, as reported in Table 3, the null hypothesis of no-autocorrelation is not rejected for all cases at the 5% level. This shows that the autocorrelation adjustment process did successfully remove significant autocorrelation from the unpredictable component of the stock return series.
Regression Results of Autocorrelation Adjustment.

p < .05.
However, the Q2-test up to 12 lags rejects the null hypothesis of conditional homoscedasticity for 9 out of 12 cases, indicating the presence of ARCH effects in those nine cases (Table 3). This signals time-varying nature of conditional variance of the daily returns of these nine stocks that causes volatility clustering as described by Engle and Bollerslev (1986). While the Q-test detected the presence of ARCH effects for nine cases, the high value of kurtosis was noted for the remaining (S1, S5, and S8) cases. Baillie and Bollerslev (1989) indicated that high value of kurtosis is likely to reduce the power of the Q-test used for detecting the presence of ARCH effects. This concern led to the application of the GARCH (1,1) model represented by equations (1) and (2) to examine the presence of ARCH effects in unpredictable return series. The results of this exercise are reported in Table 4.
Summary Statistics for the Unpredictable Stock Returns
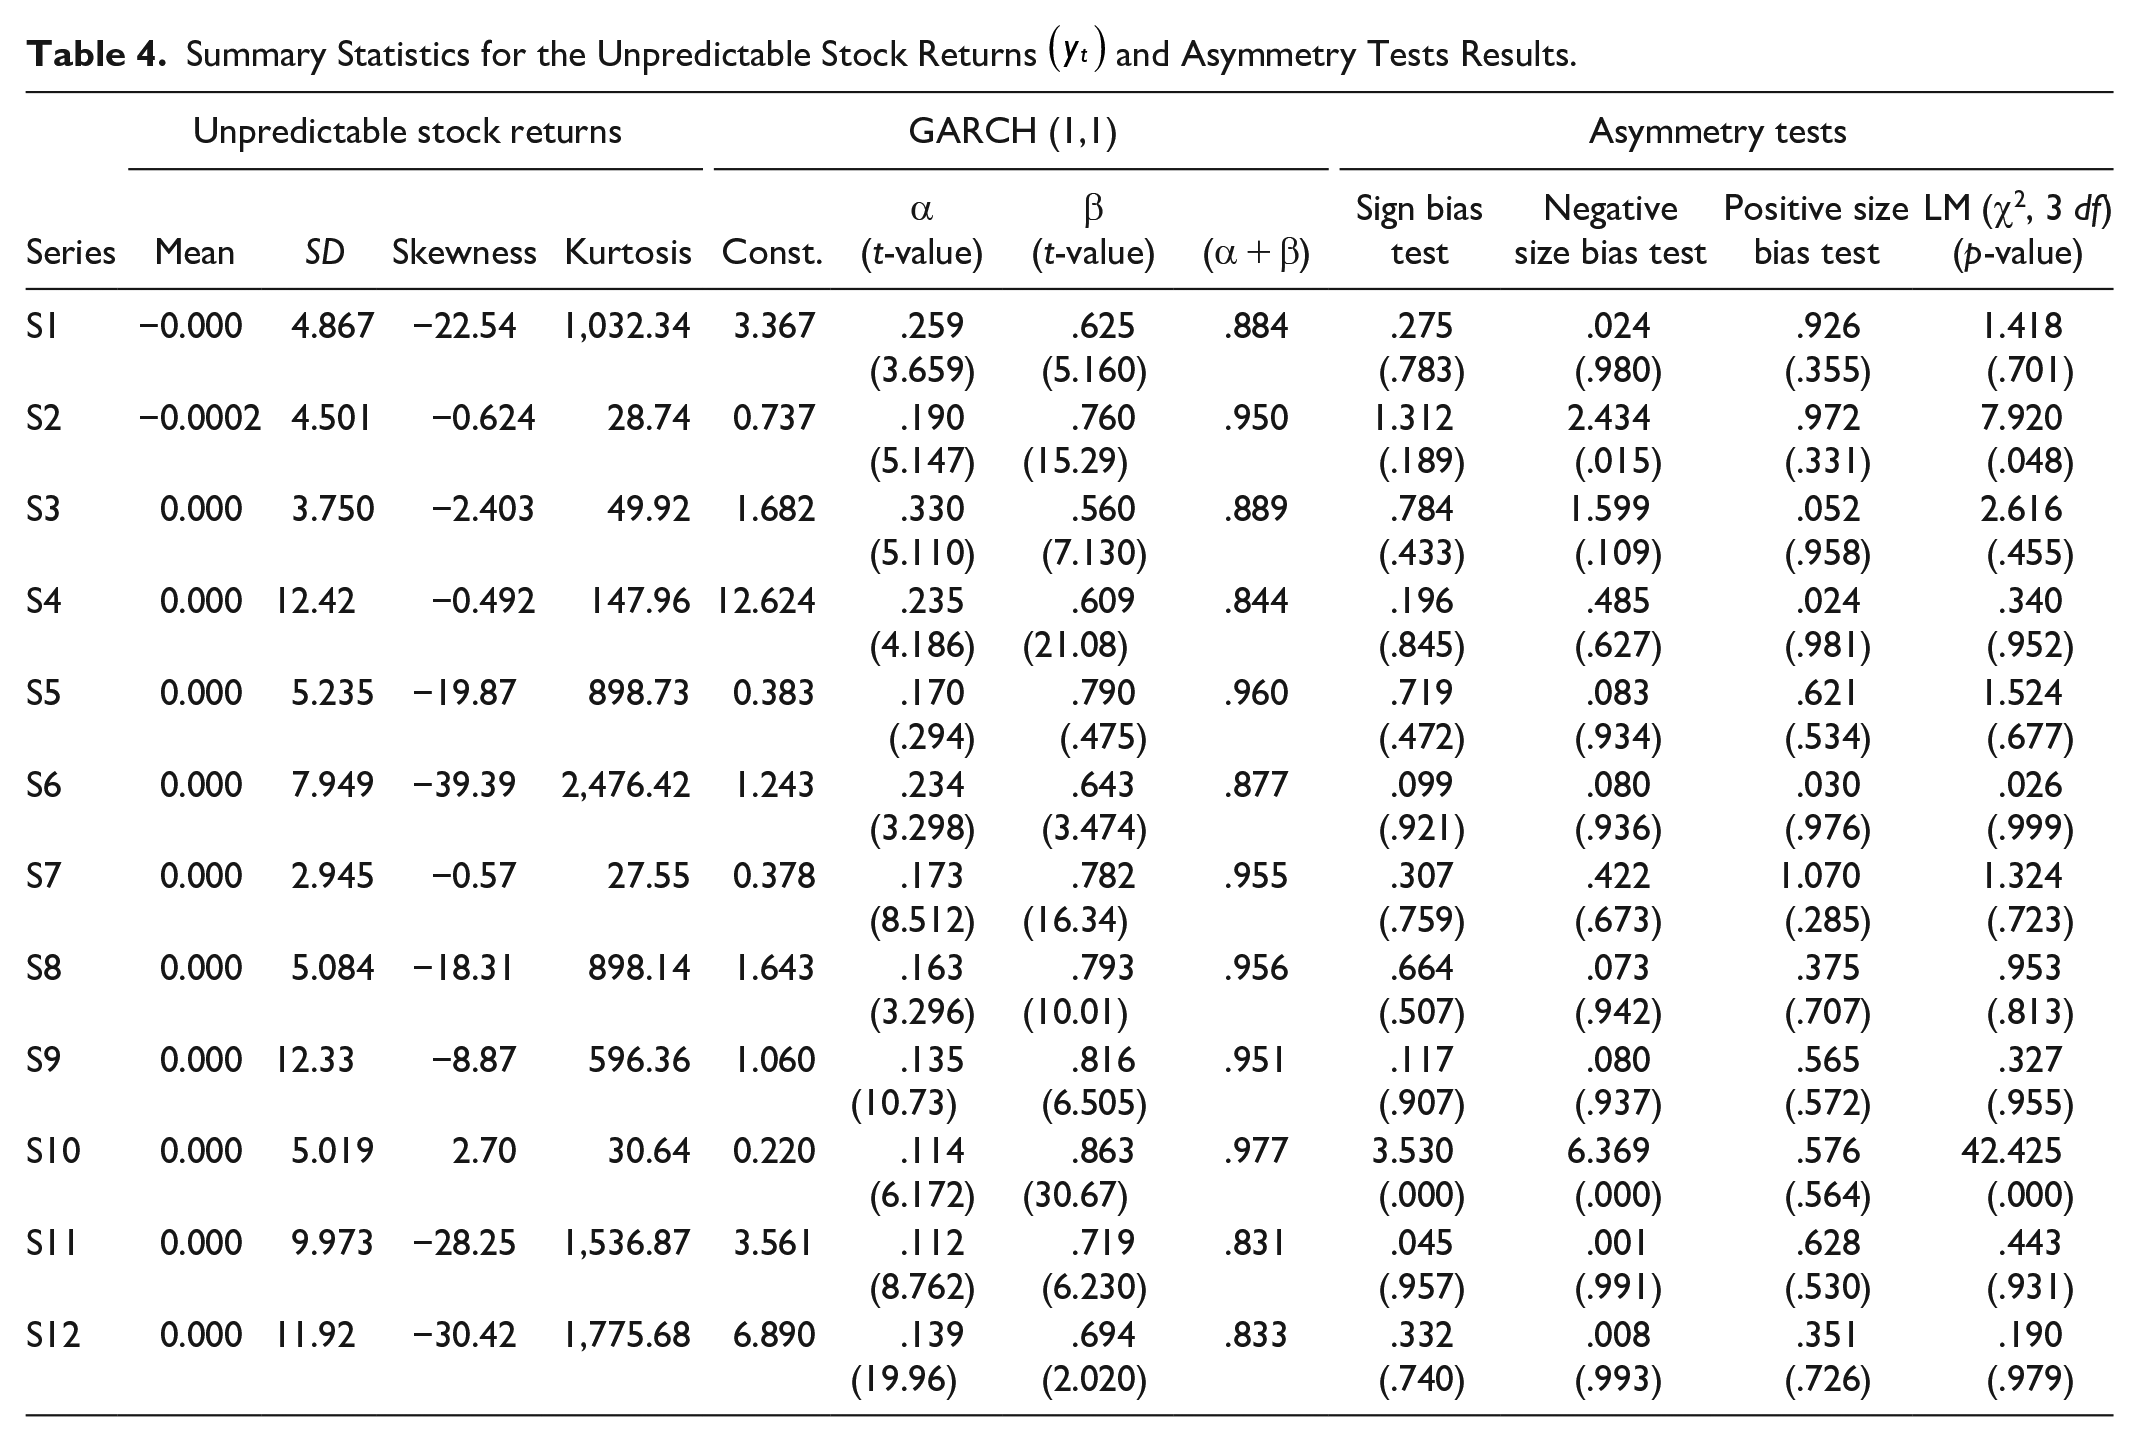
Table 4 presents the descriptive statistics of the individual unpredictable return series. The estimates of the third moment coefficient indicate asymmetry in the unconditional distribution of the individual unpredictable return series. The estimates of the fourth moment coefficient are considerably greater than 3 indicating that the unconditional distribution of the individual unpredictable return series is fat tailed. Jointly, these findings suggest non-normality in these series. In all cases, GARCH (1, 1) model was found to be parsimonious as its parameter estimates satisfy the essential parameter restrictions both individually and jointly as discussed earlier in section 4. From the results, significant ARCH and GARCH effects were evident in 11 out of 12 cases. In addition, the persistence of volatility measured by the magnitude of (α + β) ranges from 0.831 to 0.977, indicating the extent of volatility persistence. In sum, the findings of non-normality and time-variant characteristics of return series reject the null hypothesis 1 and provide support to the application of GARCH modeling approach to examine the behavior of the unpredictable return series in case of DSE.
Table 4 also presents the test results for asymmetry comprising the sign bias, negative size bias, positive size bias, and joint tests. They are found to be statistically insignificant for 11 out of 12 cases, thereby indicating that the null hypothesis 2 of “symmetry” cannot be rejected at the 5% level.
Tables 5 and 6 present the empirical results of EGARCH, GJR-GARCH, and PNP-ARCH models, respectively. It is interesting to note that the results of EGARCH and GJR models (Table 5) are consistent with the asymmetry tests results based on GARCH (1,1) model for all cases, thereby failing to reject the null hypothesis 2 of “symmetry.” In addition, the statistical insignificance of a majority of parameter estimates in the PNP-ARCH model (Table 6), signals the same conclusion of no asymmetry. This finding is not unusual as seen earlier in the review section. Kumar and Dhankar (2009) observed a lack of asymmetric volatility in case of emerging markets in South Asia like India, Bangladesh and Sri Lanka. Bahadur (2008) makes similar observation in the case of Nepal. With reference to the asymmetric effects, the consistency in results from the models represented by equations (4), (5), and (6) seems to give credence to the results from the sign and size bias tests.
Results of EGARCH (1,1) and GJR (1,1) Model.
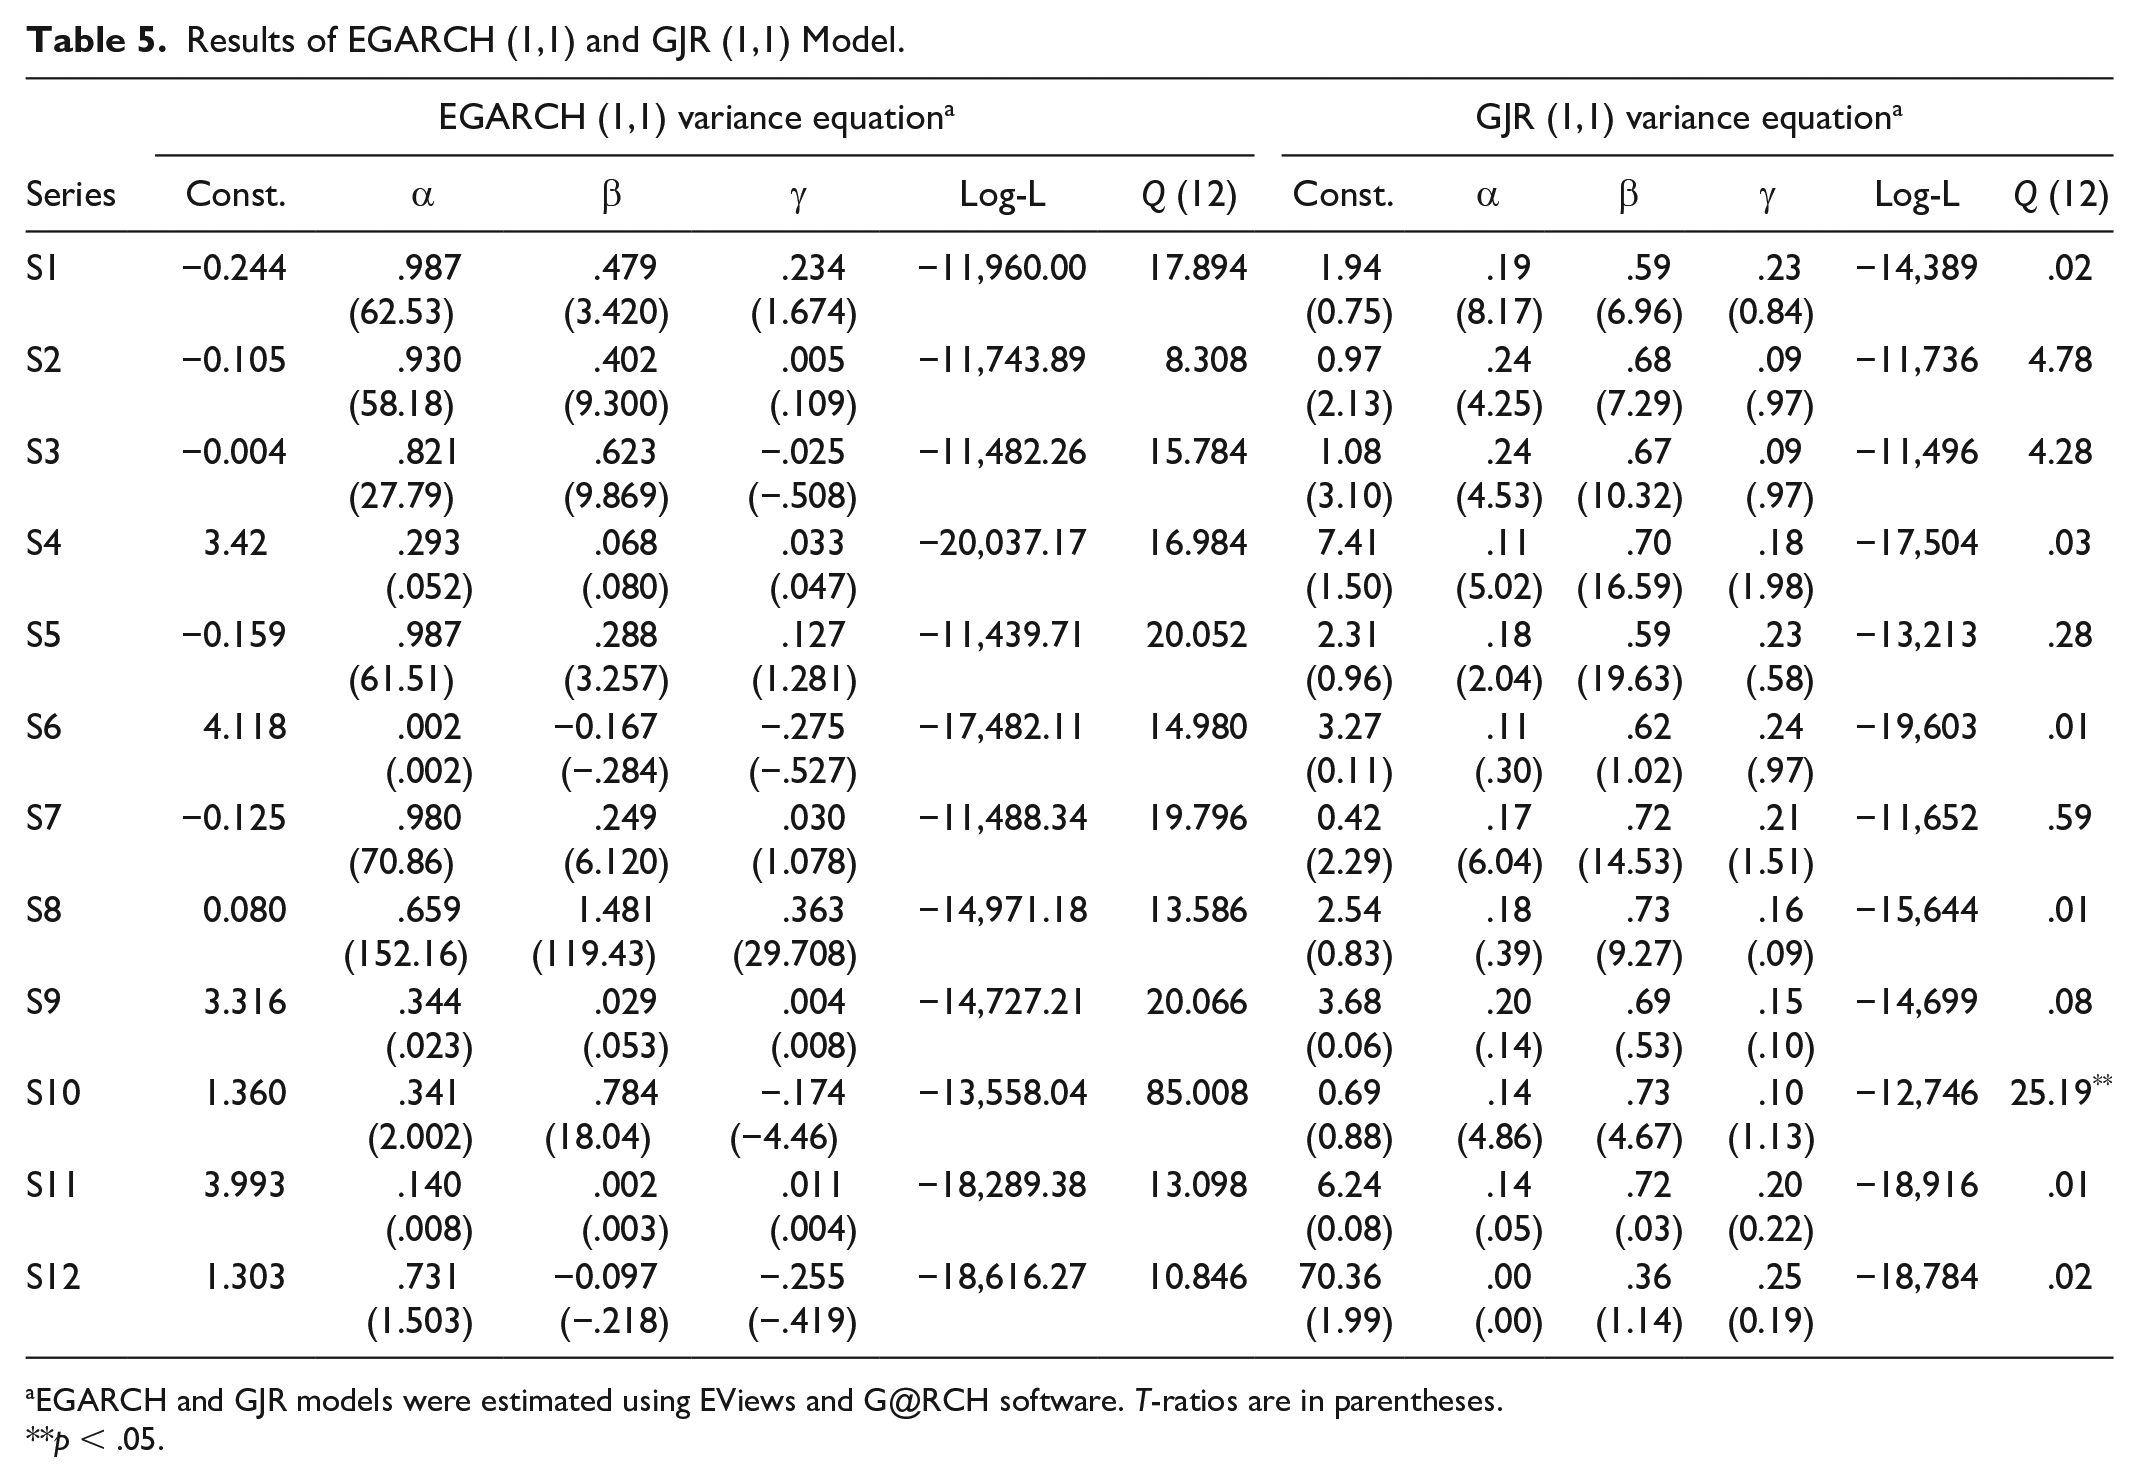
EGARCH and GJR models were estimated using EViews and G@RCH software. T-ratios are in parentheses.
p < .05.
Results of the Partially Non-parametric News Impact Model.

Note. T-ratios are in parentheses. Significant estimates are bold faced.
The possible explanations for the absence of asymmetry in return volatility discussed below can be broadly classified into two categories—regulatory and behavioral. Understandably, these two categories are interconnected as traders’ behavior is influenced by regulatory measures and vice versa.
Regulatory intervention through measures such as the circuit-breakers system, prohibition of short sale under the short sale regulation of 2006, and communication with stakeholders through online news bulletin with the verified price sensitive corporate news and rumor and daily scrutiny of press articles etc. under the surveillance functions of price and position monitoring are exercised in DSE (https://www.dsebd.org/ accessed July 28, 2021; Basher et al., 2007; Sochi & Swidler, 2018). These measures may have contributed to curb the asymmetric effects of news. With reference to DSE, Basher et al. (2007) found that the imposition of circuit breaker measure resulted in significant decrease in daily equity returns volatility. Oskooe and Shamsavari (2011) alluded to the price limit as one of the reasons for the observed lack of asymmetric effects in Iranian case. A survey on various aspects of circuit-breakers can be found in Sifat and Mohamad (2020).
With reference to DSE, the prohibition of short-selling, as argued by Sochi and Swidler (2018), hinders the price discovery process, and therefore, market efficiency. The prohibition also has the potential to influence overconfident investors and traders and negatively affects trading volume as envisaged by the over-confidence literature (Daniel & Hirshleifer, 2015; Glaser & Weber, 2007). Glaser and Weber (2007) found evidence in favor of this prediction for market participants who rank themselves above others. In case of DSE, the empirical finding of the presence of informational inefficiency in Sochi and Swidler (2018) and Mobarek et al. (2008), perhaps, signals the impact of such restrictions on traders’ confidence. See Reed (2013) for more details on short-selling and its role in financial markets.
If the news bulletin by the regulatory agency maintains the balance between the positive and negative characters of the news, then it could facilitate to level the effects of news (Dzielinski, 2012). Furthermore, irregularity in the release of such news bulletin can have a dampening effect on volatility response of traders. In a Russian case study, Nowak et al. (2011) observed investors’ slow reaction to domestic news caused by the irregularity in news release that resulted in the weakest volatility response from economic agents.
On the other hand, the attitude of economic agents toward news and their assessment of market environment they face could be another factor. The absence of asymmetric effects, perhaps, indicates that the DSE market environment is either treated as unambiguous by market participants or their decision-making is uninfluenced by ambiguity. Williams (2015) claimed that in an ambiguous market environment, investors’ asymmetric reaction to good and bad news is caused by their pessimistic approach to decision-making. However, in the absence of such ambiguity, Williams (2015) found that good news and bad news were treated equally by investors as signaled by the statistically indifferent magnitude of estimated coefficients .6503 and .6508, respectively.
Other factors such as traders’ reluctancy to take short position in the market and their under-reaction to bad news may also have contributed to curb the extent of volatility response to negative news. With reference to DSE, Joarder et al. (2014) pointed out that investors are reluctant to take short positions due to knowledge deficiency or behavioral biases generated by the manifestation of information inefficiency in the market. Delay in information absorption into market and behavioral bias of traders were also mentioned as probable causes of informational inefficiency in Mobarek et al. (2008). Furthermore, Maher and Parikh (2011) found evidence of under-reaction to negative shocks in all periods excluding post-crisis period in case of medium and small size indices in Indian stock market.
The research on volume-volatility relations examines news effect on conditional variance by incorporating trading volume as a proxy for the arrival of news into market (see e.g., Carroll & Kearney, 2012; Girard & Biswas, 2007; Lamoureux & Lastrapes, 1990, to name a few). This line of research assumes, as pointed out by Andersen (1996), that there exists a high degree of positive contemporaneous correlation between trading volume and return volatility. This implies that news causes change in trading volume (Scott et al., 2003). However, the empirical evidence is not universal. With regard to DSE, Bose and Rahman (2015) found no significant influence of trading volume (both current and lagged) to reduce ARCH and GARCH effects in daily returns. Furthermore, according to Hong and Stein (2007) and Banerjee and Kremer (2010) major disagreements among economic agents on the interpretation of news encourage generating positive link between trading volume and change in returns over time. The failure of trading volume in reducing volatility persistence as noted by Bose and Rahman (2015), perhaps, signals a lack of influence of public information on trading volume due to transactional barriers caused by the imposition of regulatory measures as discussed earlier, or a higher degree of agreements among market participants in the interpretation of the news that arrives in the market, or both.
Finally, if asymmetric reactions of traders are linked to the day-of-the-week effects as argued by Chang et al. (1998) and Charles (2010), then the removal of the day-of-the-week effects from the unpredictable stock return series in the case in hand may have dampening effect on asymmetric effects.
Policy Implications and Conclusions
One of the important policy implications with regard to the absence of asymmetric news effects is that it, perhaps, signals the efficacy of government intervention through regulatory measures as discussed above. Shleifer (2005) indicated the insufficiency of market discipline in effectively controlling disorders and fraudulence behavior in emerging market cases. In case of DSE, symptom of inefficiency in market functioning is observed by Basher et al. (2007) and Joarder et al. (2014). This is not surprising. For DSE, Chowdhury et al. (2014) points out that investors’ sentiment is probably influenced by investors’ unawareness, unreliability of earnings information, inferior information, lack of expert services etc., rather than market fundamentals. In addition, the size of non-institutional investors in DSE is identified by Chowdhury and Rahman (2004) as another reason for the failure of the stock market to predict macroeconomic volatility.
Furthermore, Kumar and Dhankar (2009) observed association between Dhaka stock market with Pakistan stock market and global counterparts, and sensitivity of DSE to economic and non-economic shocks of global origin. Given the empirical evidence of market inefficiency in DSE together with its connection with the regional and global stock markets, government intervention would not only be desirable to correct market functioning but would also help protect DSE from the potential influence of regional and global financial crisis by reducing the negative effects of foreign investors’ reaction. The desirability of government intervention for DSE is also resonated in Chowdhury and Masuduzzaman (2010).
While a case for government intervention as a means of controlling market anomalies and restoring stability can be made for DSE, the analysis of trade-off associated with such intervention should be pursued to determine efficient regulatory choices. This is because excessive intervention may generate inefficiency in the decision-making process of economic agents involved in the market and consequently upset their confidence. The finding of a lack of asymmetry in returns volatility and its potential reasons identified in the paper should be of practical relevance to decision-makers and market traders. If the regulatory interventions, as described in the paper, contribute to dampen the asymmetric news effects, decision makers should regularly monitor their potential negative effects on market efficiency and the behavior of market traders. Xiong and Bharadwaj (2013) suggested that the asymmetric effects of news can be effectively tackled by adopting appropriate marketing approach by individual firms that aids to amplify positive effect of good news and vice versa.
This case study has examined the presence of significant asymmetric effects of news on conditional volatility of stock returns using daily stock return data from Dhaka Stock Exchange. While the empirical results confirm the stylized facts such as the presence of non-normal distributional properties of the daily stock return series, time variant conditional second moment and presence of volatility persistence, the results fail to reject the null hypothesis of symmetry in 11 out of 12 cases. This signals, perhaps, that the data-generating process in DSE can be adequately represented by the symmetric GARCH model. This is also echoed in Kumar and Dhankar (2009) with reference to DSE.
Although the potential reasons for the absence of asymmetric effect of news are itemized, the present paper lacks the empirical determination of the extent of their influence. This is simply because this paper does not investigate the empirical determination of the extent of their influence as such undertakings are beyond its scope. In this regard, further empirical research might prove worthwhile to examine the impact of such policy measures on market performance, price discovery process, and traders’ confidence using other econometric models such as quantile regression (see for instance, Cappiello et al., 2014; Engle & Manganelli, 2004; Mensi et al., 2014) and threshold autoregression (see e.g., Hansen, 2011; Hossfeld & MacDonald, 2015). Additional research on the behavioral aspects of market participants and the factors influencing their response to news would be useful to consider Finally, future work can also be pursued to validate (or otherwise) the empirical findings of the present paper by extending the time period and/or selecting additional stocks.
Footnotes
Acknowledgements
The authors would like to thank the Associate Editor and three anonymous reviewers for their helpful comments and suggestions. The authors would also like to thank Dr. Toufic Ahmad Choudhury, former Director General of Bangladesh Institute of Bank Management for facilitating access to the data used in this study.
Authors’ Note
The author was working at Sultan Qaboos University when the research was initiated and the draft manuscript was written. Currently he is not working at Sultan Qaboos University.
Declaration of Conflicting Interests
The author(s) declared no potential conflicts of interest with respect to the research, authorship, and/or publication of this article.
Funding
The author(s) received no financial support for the research, authorship, and/or publication of this article.